

Gold got the perfect reason to rally. That was the trap.
Forexia Academy
Why is gold falling when the weakest US jobs report in months handed it the perfect reason to rally? Gold bounced on the number, the bounce died the same morning, and by 7 October it was near its lowest levels since August. If you bought that bounce you were not reckless: the data agreed with you, and the reason you were given was the trap.
In brief
- What happened: September payrolls came in at 29,000 against about 90,000 expected. Gold spiked at the 08:30 New York release on 2 October, then fell 101 pips in 3 hours 15 minutes.
- The trap: Weak jobs, a Fed that backs off, buy gold. Everyone taught that chain bought at the same minute.
- The tell: Lower highs since January, and $12bn out of gold futures in September while $10bn went into gold funds.
- The rule: News gives you the time, never the direction. Wait for the stop hunt and the close back inside.
What happened to gold after the jobs report
The September nonfarm payrolls report showed 29,000 new jobs against expectations of around 90,000. Unemployment edged up to 4.2%, annual wage growth slowed to 3%, and earlier months were revised lower. FXStreet's analysis of 7 October says expectations for an October Federal Reserve rate increase collapsed with it, and tells the rest in eight words: "Gold initially responded, but the rally quickly faded." Gold was then around $4,110.
The slide began earlier. The World Gold Council's September commentary has gold finishing September at $4,176 an ounce, 8.5% lower on the month, with the US 10-year yield up 53 basis points to 5.3% and the dollar index up 2%. On 28 September gold had already touched its lowest since 5 August, in a Reuters report relayed by USAGOLD. The record high is $5,405, set on 29 January 2026, and FXStreet counts lower highs ever since, the latest a recovery that failed around $4,700 in late August.
Why did gold fall on a weak jobs number? How the trap was built
Retail's seat: the number said buy
You were taught a chain: weak jobs, a Fed that backs off, falling yields, rising gold. You were also taught to wait for confirmation, and the release handed you both at a minute every calendar had shown for weeks. It felt like discipline, not a gamble. We have been there too.
But a reaction a whole crowd is taught is not an edge. It is a schedule: buyers, arriving together, at a known minute.
The market maker's seat: who needed those buyers
Now take the other chair. You have a lot of gold to sell, and your problem is not direction. It is finding enough buyers without pushing the price away from yourself. The positioning figures show that selling.
"Gold specs cut their long exposure while adding shorts for the third consecutive week, as rates across the curve and the greenback continue to drift higher."
TD Securities, quoted by FXStreet
The World Gold Council puts a number on the month:
- Out of gold futures: net managed money positions on COMEX fell by $12bn, or 84 tonnes, in September.
- Into gold funds: global gold ETFs took in $10bn, or 67 tonnes, with North America leading.
The Council says the futures liquidation likely contributed to September's fall, and all of it was done before the jobs number existed. Then the number brought a new crowd of buyers: from this chair, liquidity delivered on time.
TD Securities and the Council report the flows, and neither calls the jobs report a trap. FXStreet puts the fade down to long-term yields that did not fall and a firm dollar, and notes that ETFs, discretionary funds and central banks are still buying. That the release called the crowd is our reading.
The observer's seat: a time, not a direction
The observer does not ask whether the number is good or bad for gold, only what was on the chart before it printed. The trap has three parts every time: consolidation, induction, reversal. Before the number, the structure already pointed down. On it came the induction, the final move against the direction price is about to take. Then the reversal: OCBC, quoted by FXStreet, wrote that gold's rebound "faded quickly despite a softer US labour report".
The calendar told you when the crowd would show up, never where price would go next.
Gold on jobs report day: the XAUUSD chart, 2 October 2026
The release itself, on real 15-minute candles.
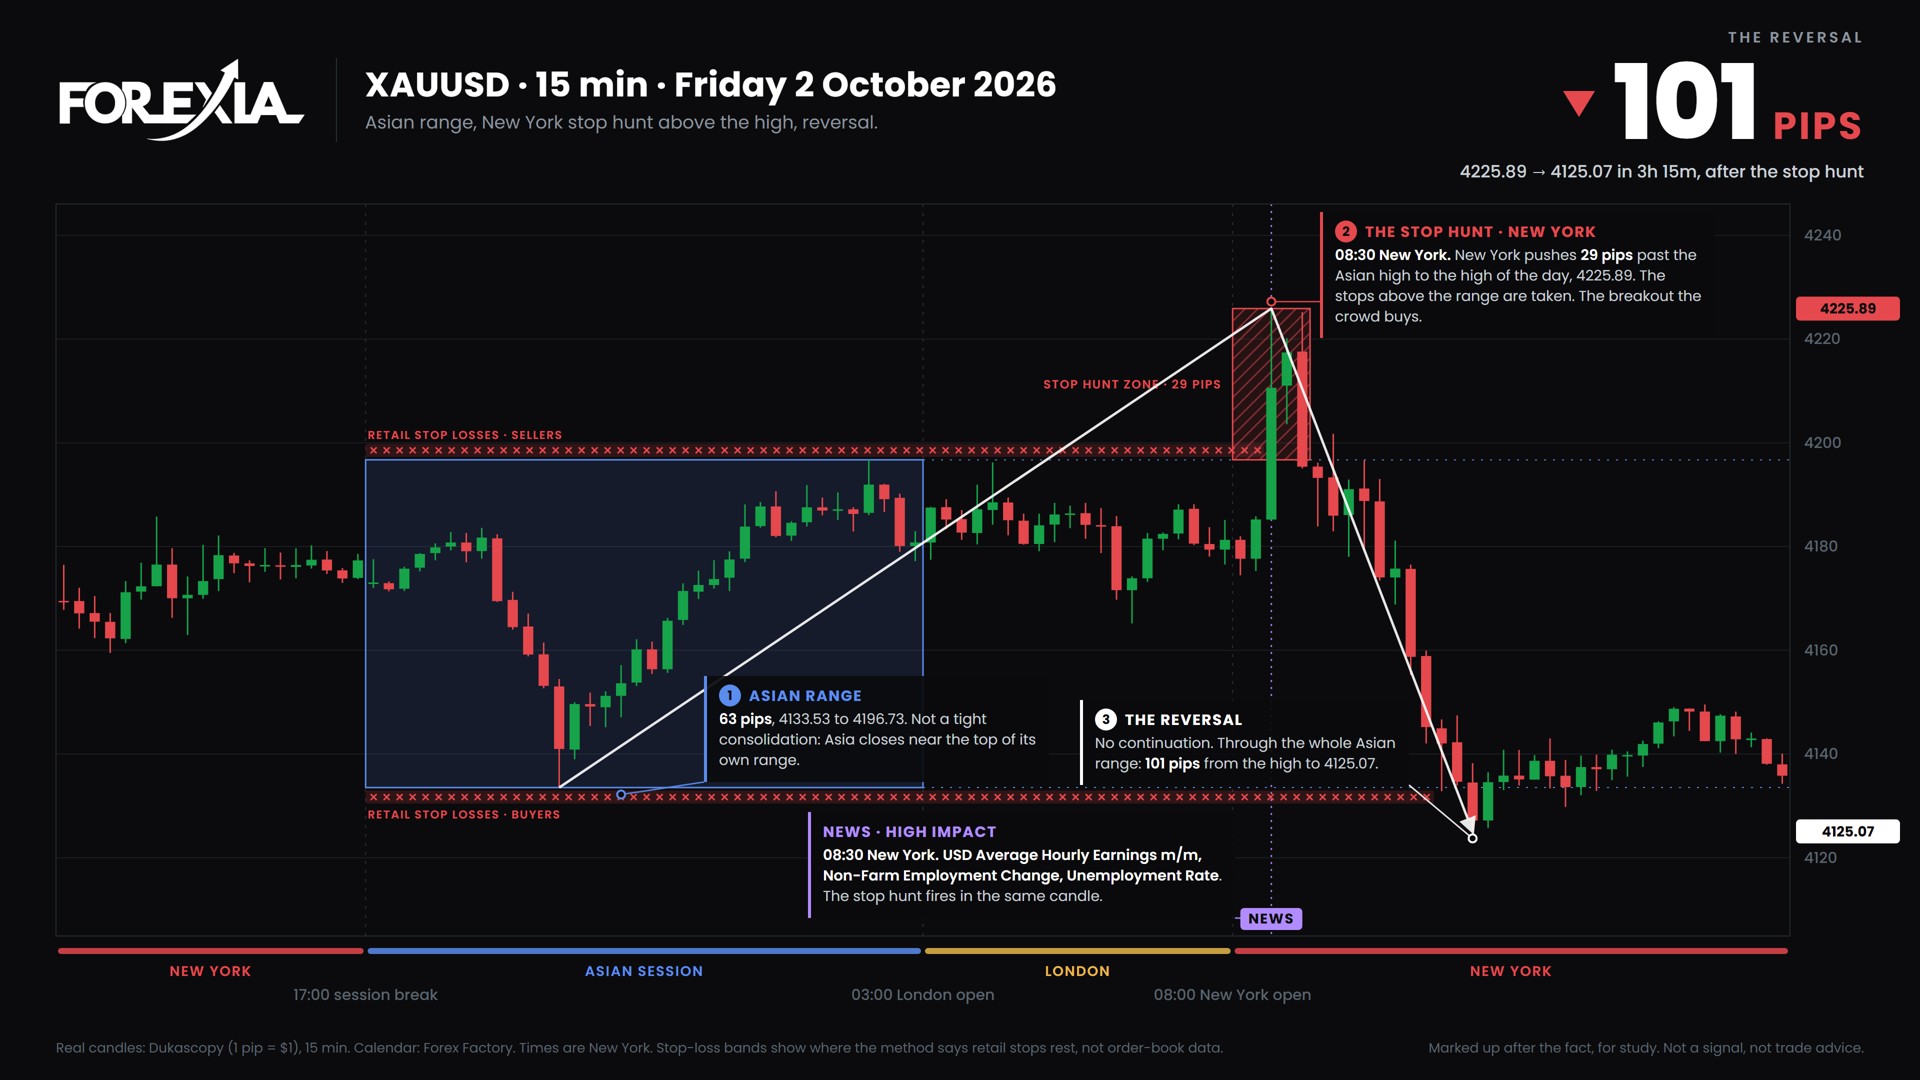
XAUUSD, 15 min, Friday 2 October 2026. Asian range 4133.53 to 4196.73, 63 pips. Stop hunt zone 29 pips, to 4225.89 at 08:30 New York. The reversal: 101 pips, 4225.89 to 4125.07 in 3h 15m.
- The Asian range. Gold built a 63-pip range between 4133.53 and 4196.73 before London opened. Sellers' stops rest above the high, buyers' stops below the low.
- The stop hunt. At 08:30 New York, as Non-Farm Employment Change, the Unemployment Rate and Average Hourly Earnings came out, price pushed 29 pips past the Asian high to 4225.89, the high of the day. The stops above the range are taken; the breakout the crowd buys is the top.
- The reversal. No continuation. Price closed back under the Asian high at 09:15 and reached 4125.07 by 11:45: 101 pips in 3 hours 15 minutes, through the whole Asian range and the buyers' stops beneath it.
Read it honestly: 2 of the method's 8 confirmations, about 1 to 2.3 from the close back inside, under the method's 1 to 3. These are the structure's numbers, not a result anyone booked.
Where gold went next: the weekly cycle, week of 5 October 2026
The next week's 1-hour chart shows the same parts on a bigger scale, with no release lined up with the trap.
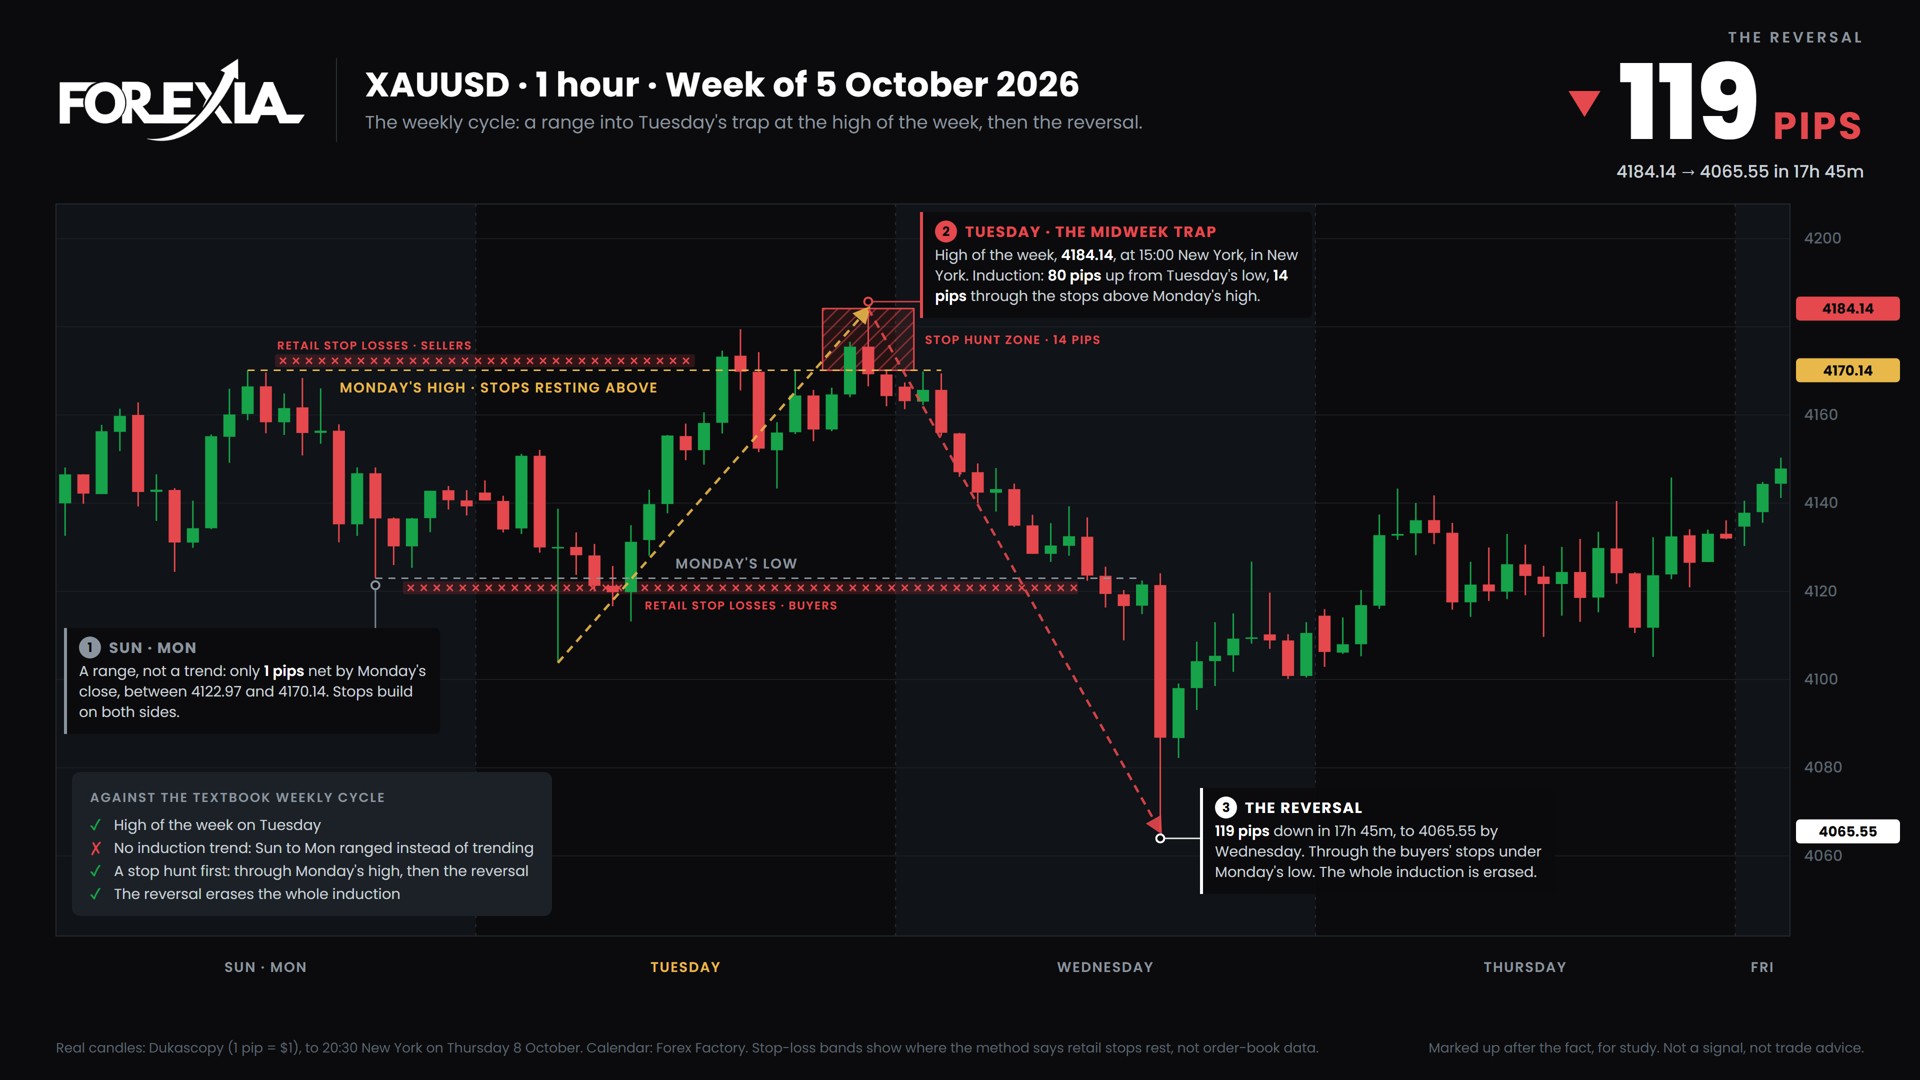
XAUUSD, 1 hour, week of 5 October 2026. Stop hunt zone 14 pips above Monday's high, 4170.14. The reversal: 119 pips, 4184.14 to 4065.55 in 17h 45m. Candles to 20:30 New York on Thursday 8 October.
- Sunday and Monday: a range, not an induction trend. Only 1 pip net by Monday's close, between 4122.97 and 4170.14. Stops build on both sides.
- Tuesday: the midweek trap. The high of the week, 4184.14, at 15:00 New York: 80 pips up from Tuesday's low and 14 pips through the stops above Monday's high.
- The reversal. 119 pips down in 17 hours 45 minutes, to 4065.55 by Wednesday, through the buyers' stops under Monday's low. The whole induction is erased.
The reversal took gold under the 4125.07 low of jobs report day.
The rule to keep: how to read a jobs report on the chart
News gives you the time, never the direction. On a release day:
- Treat the release as a time. It tells you when the crowd arrives, not where price goes.
- Mark the range price built before it. Its high, its low, and the stops behind each edge.
- Wait for the stop hunt. A spike through one edge is the first move, and it is there to recruit.
- Wait for the close back inside. No close back inside, no trade.
That rule says nothing about where gold goes next, and neither do we: FXStreet's own conclusion is that the next move may depend on which group of investors is forced to change position. A free account at https://forexiapro.com opens the first COT report of each month, where speculators' positions are charted. More days read this way: the Forexia Playbook and our markup of the 5 June jobs report.
Frequently asked questions
Why is gold falling after a weak jobs report?
OCBC, quoted by FXStreet, points to long-term yields that did not fall and a firm dollar. Our reading: the release supplied buyers, at a known minute, to a market already being sold.
Does gold always go up when nonfarm payrolls are weak?
No. On 2 October a figure of 29,000 against about 90,000 expected pushed gold 29 pips above its Asian range before it fell 101 pips. A release tells you when a crowd will act, not where price ends the day.
What is a stop hunt on a news release?
A push through an obvious high or low, where stops and breakout orders are clustered, timed to the release and followed by a reversal. That burst of orders is the liquidity larger players need.
Sources
- FXStreet, 7 October 2026: the payroll figures, gold near $4,110, the lower highs, and what TD Securities and OCBC said.
- World Gold Council, September 2026 commentary: the September close, yields, the dollar, the record high, the futures and ETF flows.
- USAGOLD, 28 September 2026: gold's lowest since 5 August, as Reuters reported it.
Learn to read the chart this way. The next time a release hands you the perfect reason, ask who needs you to buy right now. Signing up is free. Browse the courses.
Written after the fact, for study: not a signal and not trade advice. Candles: Dukascopy. Calendar: Forex Factory. Times are New York. Stop-loss positions are the method's reading of the structure, not order-book data.