Risk Management
Forex Beginner Mistakes: The 7 Most Common, and the Fix
Forex beginner mistakes in the order they usually cost: size, stops, no record, revenge, news, small samples and paying for promises, with a fix.
6 min read

The Forexia blog
Weekly forex chart markups on the majors and gold: stop hunts, M and W formations and midweek reversals on real candles, with the reasoning written out.
Forex beginner mistakes in the order they usually cost: size, stops, no record, revenge, news, small samples and paying for promises, with a fix.
6 min read
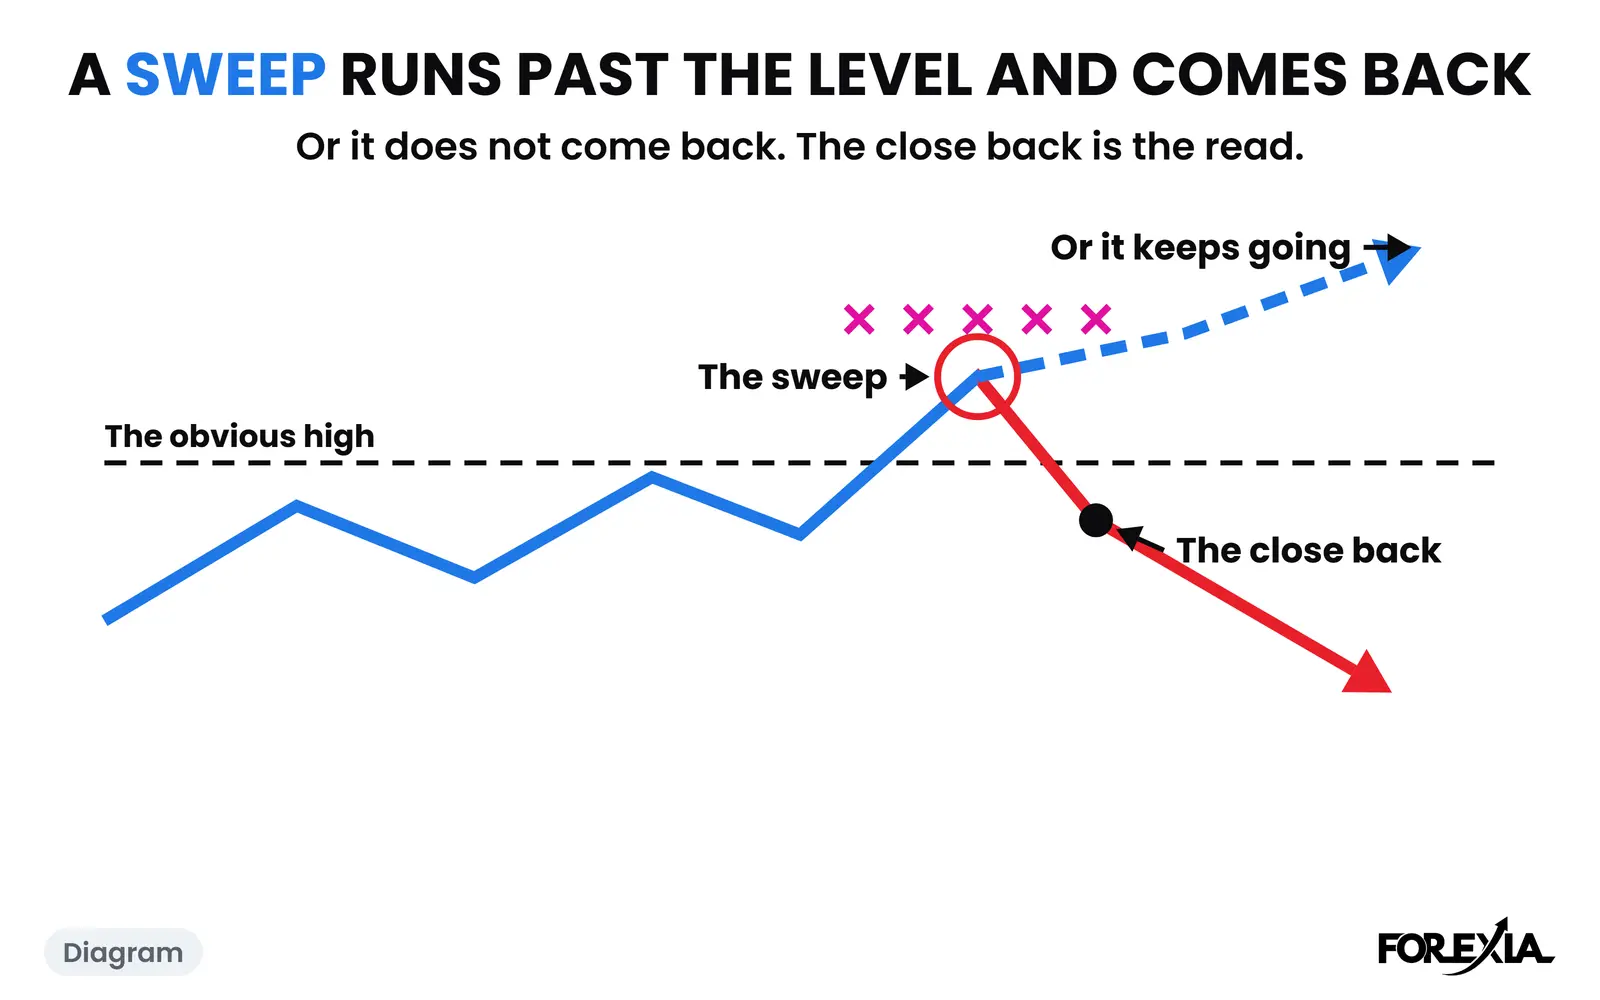
A gold liquidity sweep on real days: six London XAUUSD sweeps with the level, the size and the close back, and one that kept going. Counts included.
7 min read
A forex research archive of our own studies: each test, its result after costs and what it does not prove. Losses are listed like everything else.
6 min read
Forex myths debunked on our own data: eight popular beliefs, what is true in each, and what our counts and tests show. No promises, no results, no signals.
6 min read
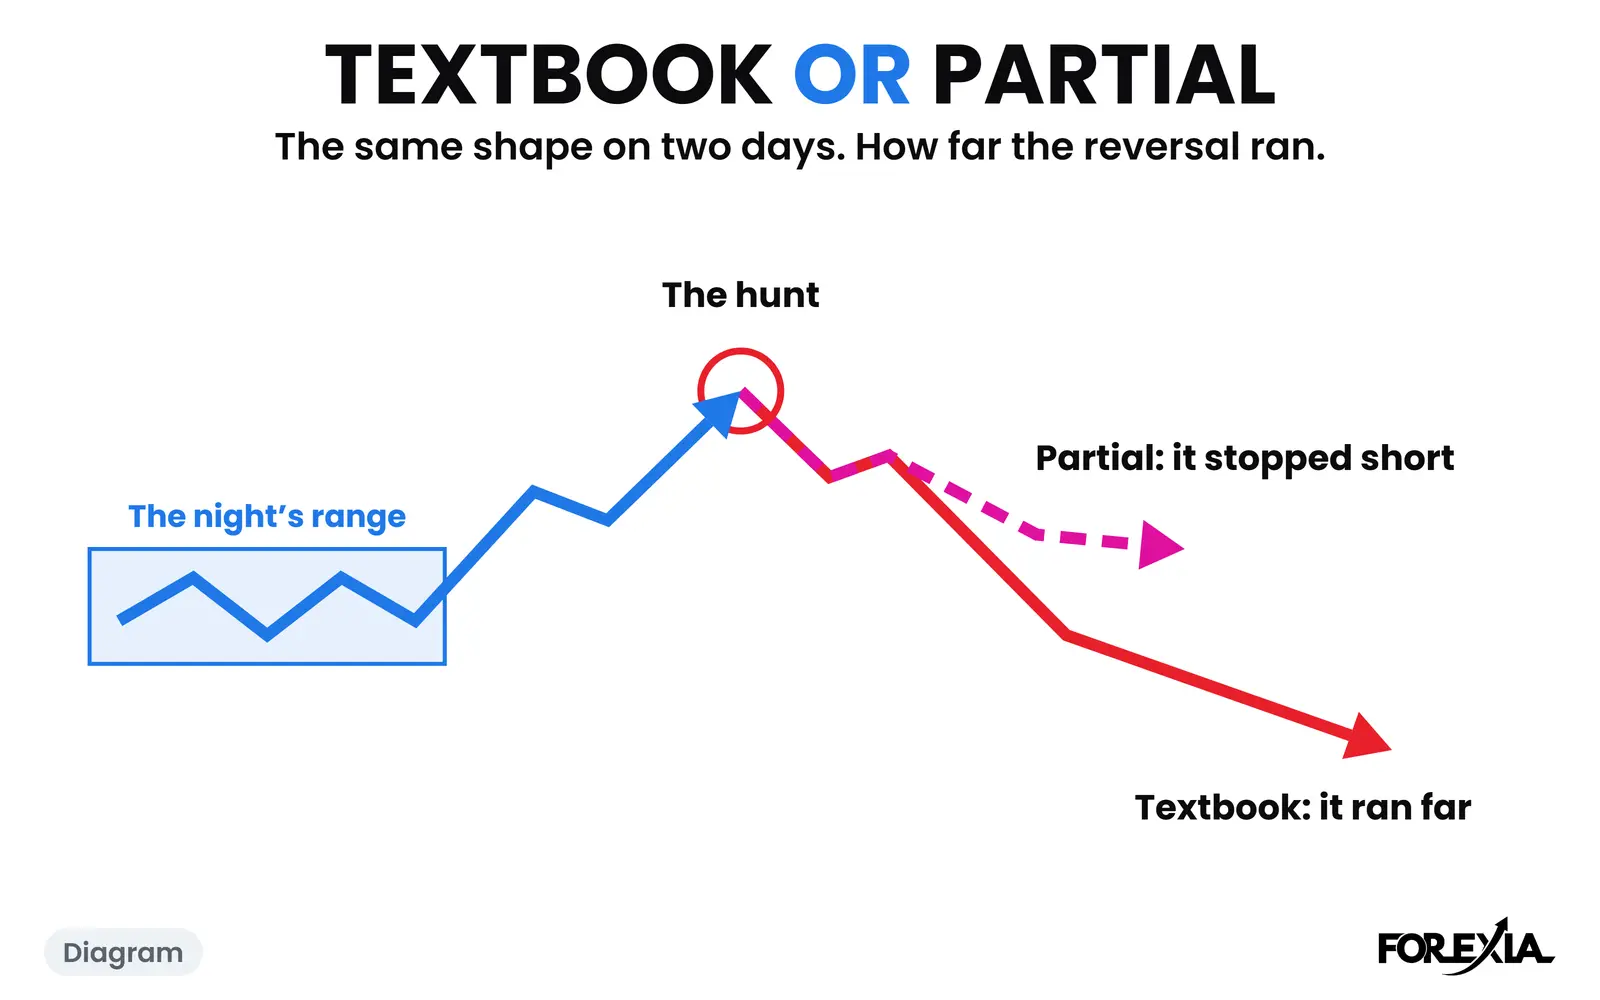
The Forexia Playbook: 58 real trading days in six volumes, each read from three seats and scored on eight confirmations. What is in it and how to read it.
6 min read
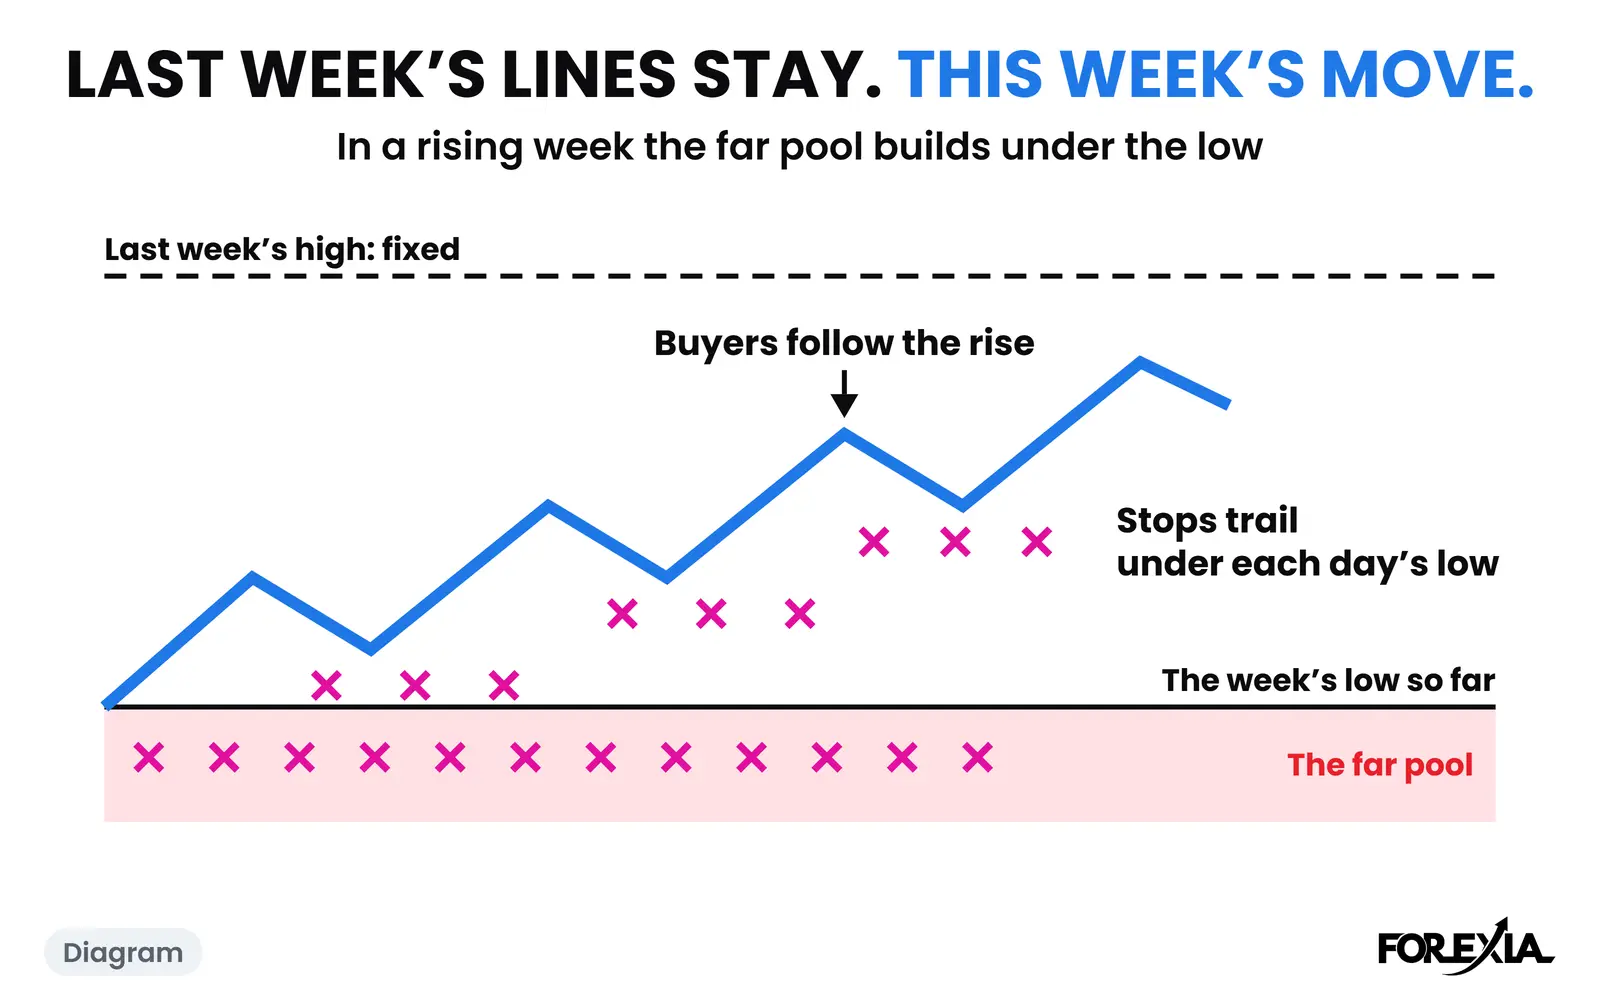
Our forex weekly outlook starts with last week's high and low, the COT stance and the calendar, not a forecast. One real Sunday and what it could not say.
6 min read
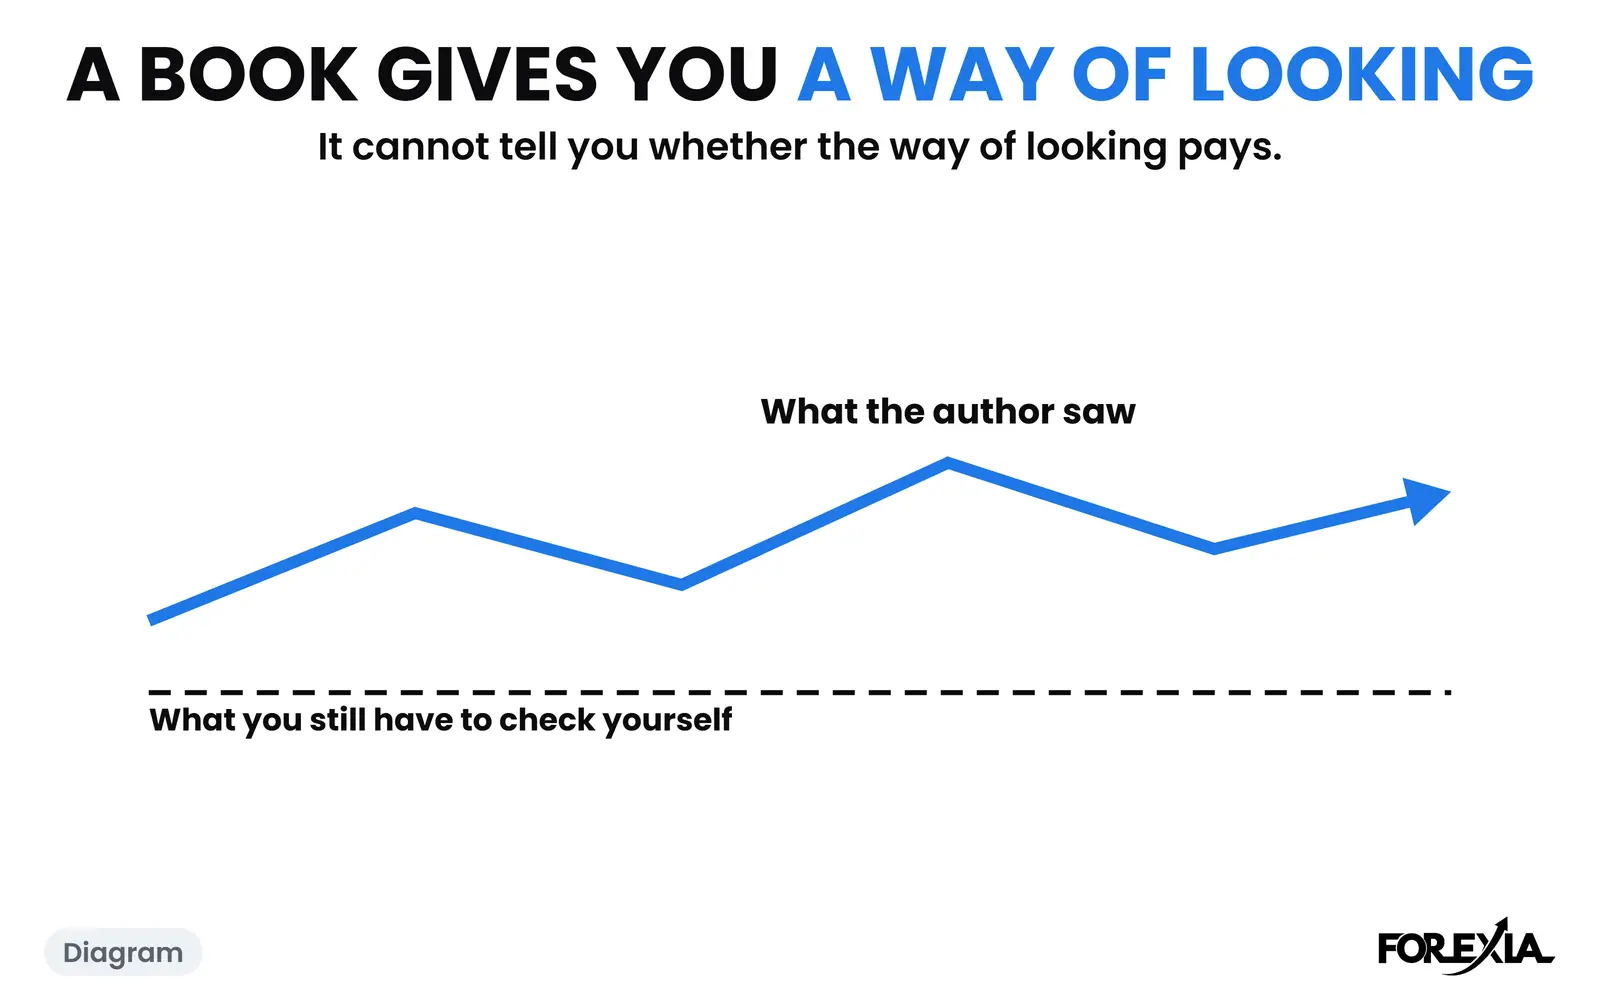
Best forex trading books: seven worth reading, from psychology to candles, and what each gets wrong. A reading order for beginners. No returns promised.
8 min read
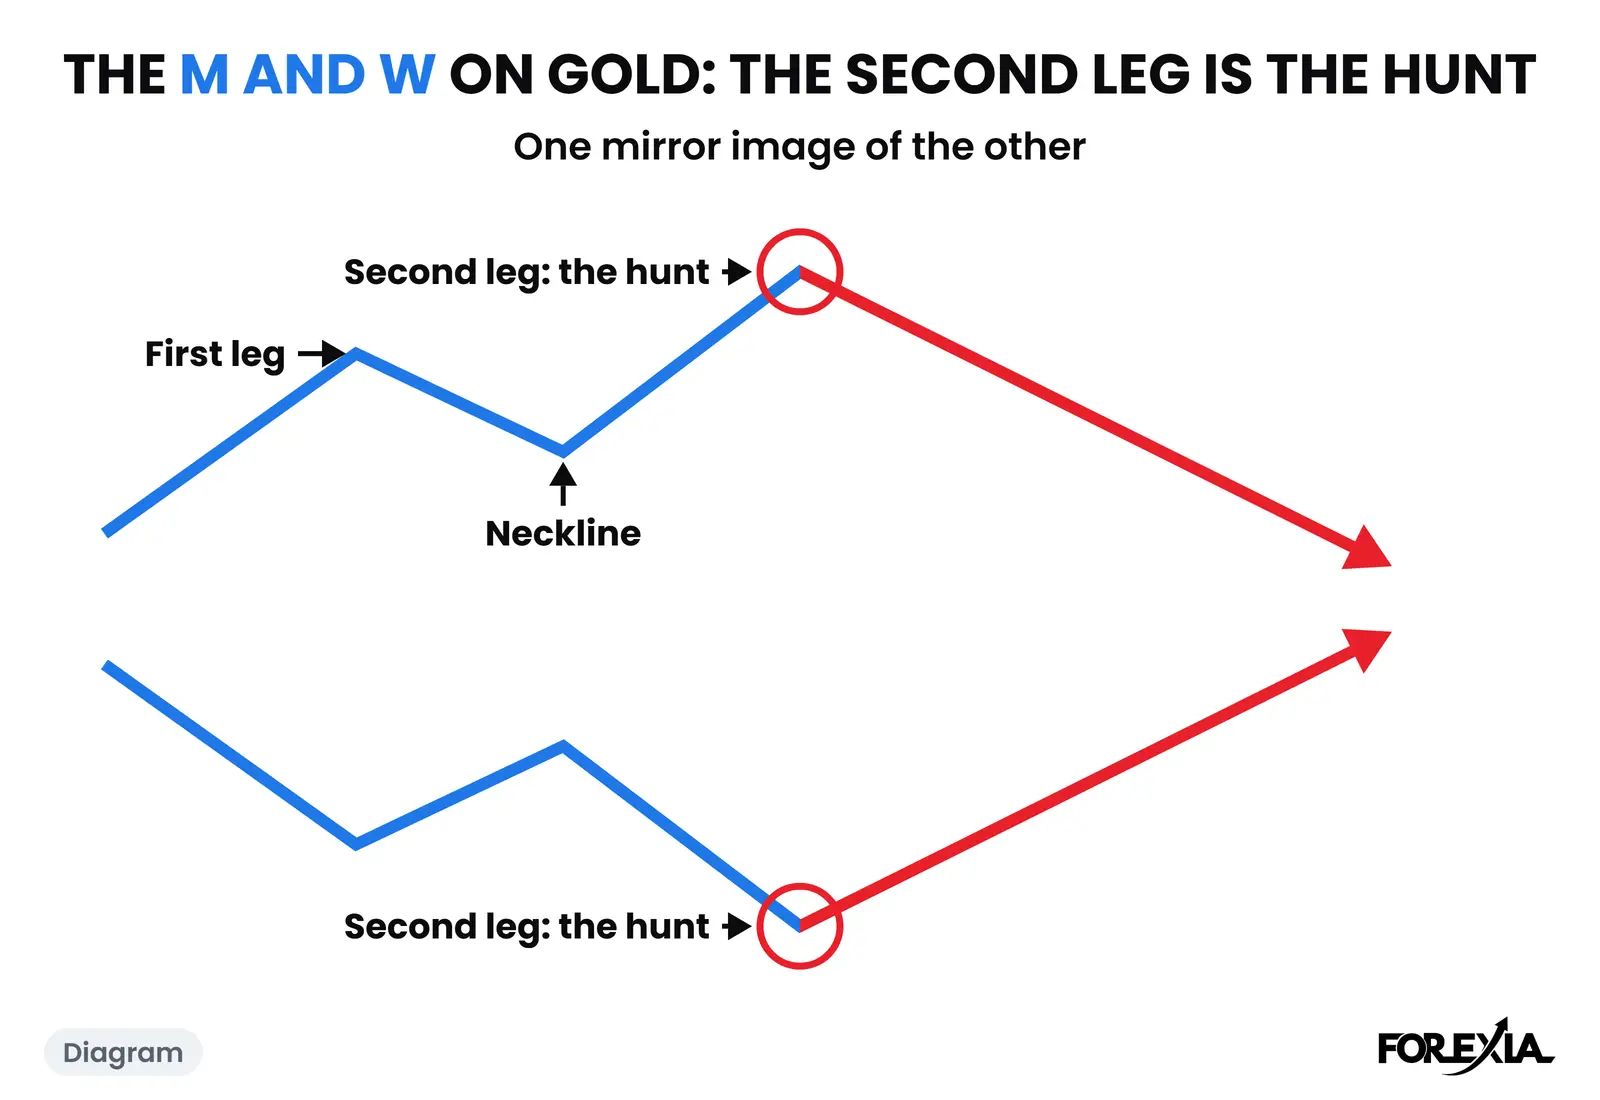
The gold M and W pattern on real days: sixteen marked XAUUSD days from May to September 2026 with the second leg and the reversal, and two worked in full.
7 min read
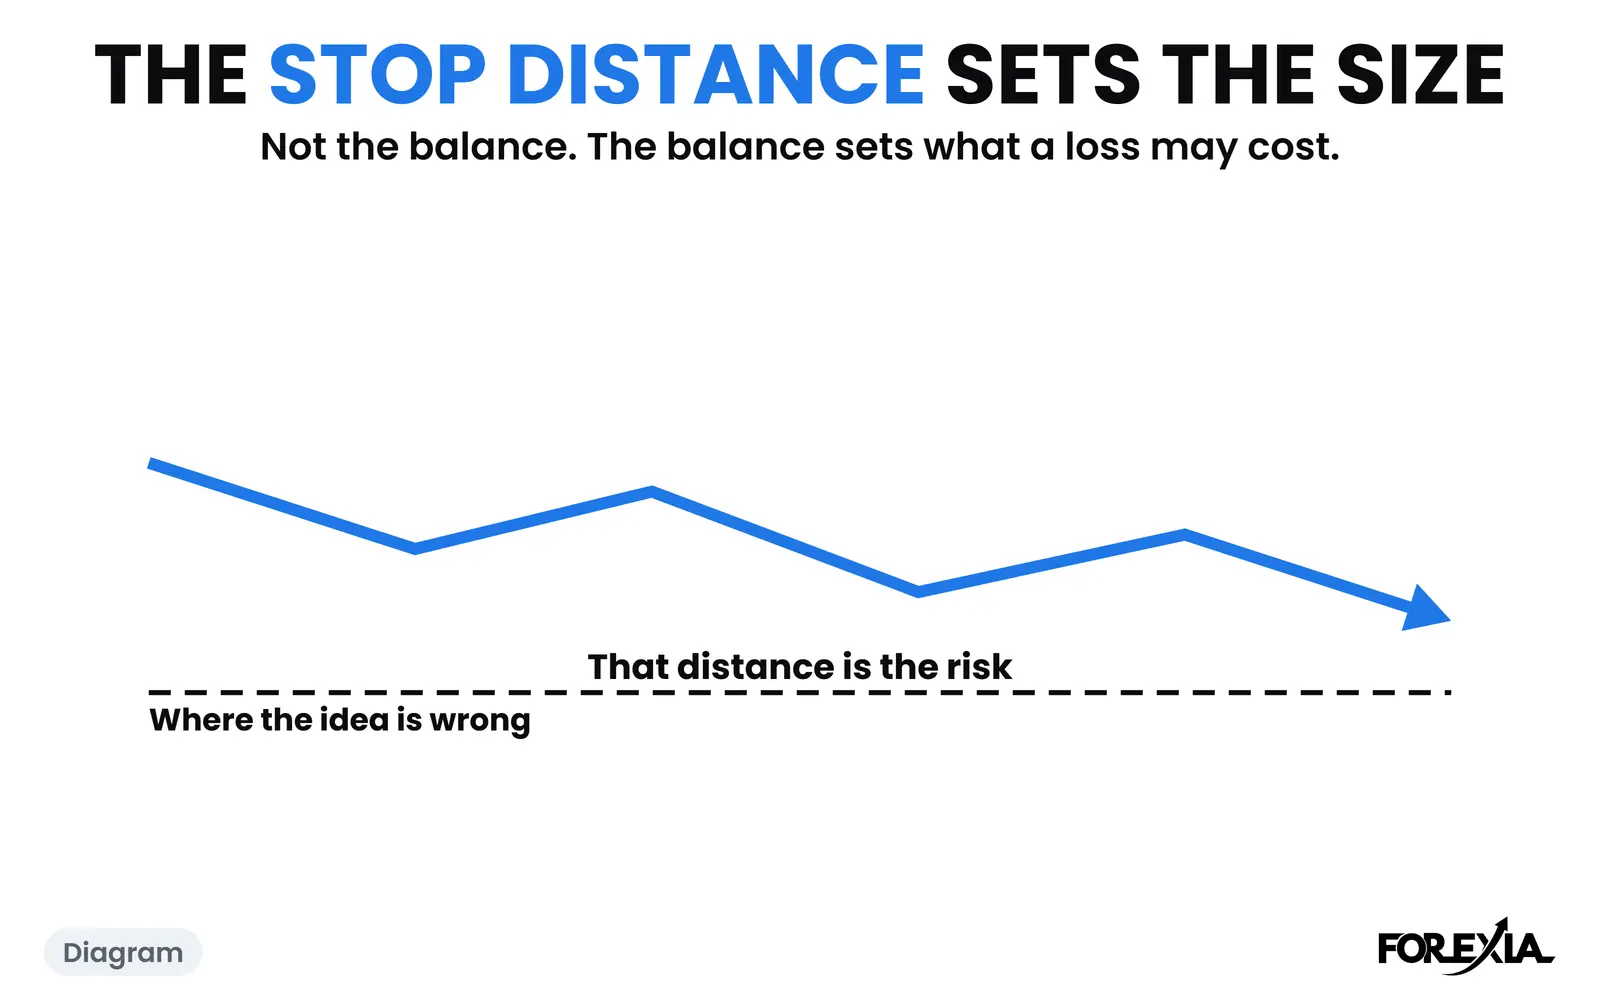
How much to risk per trade in forex: pick a loss in dollars first, then size from the stop. A losing-streak table in plain arithmetic, one real stop.
6 min read
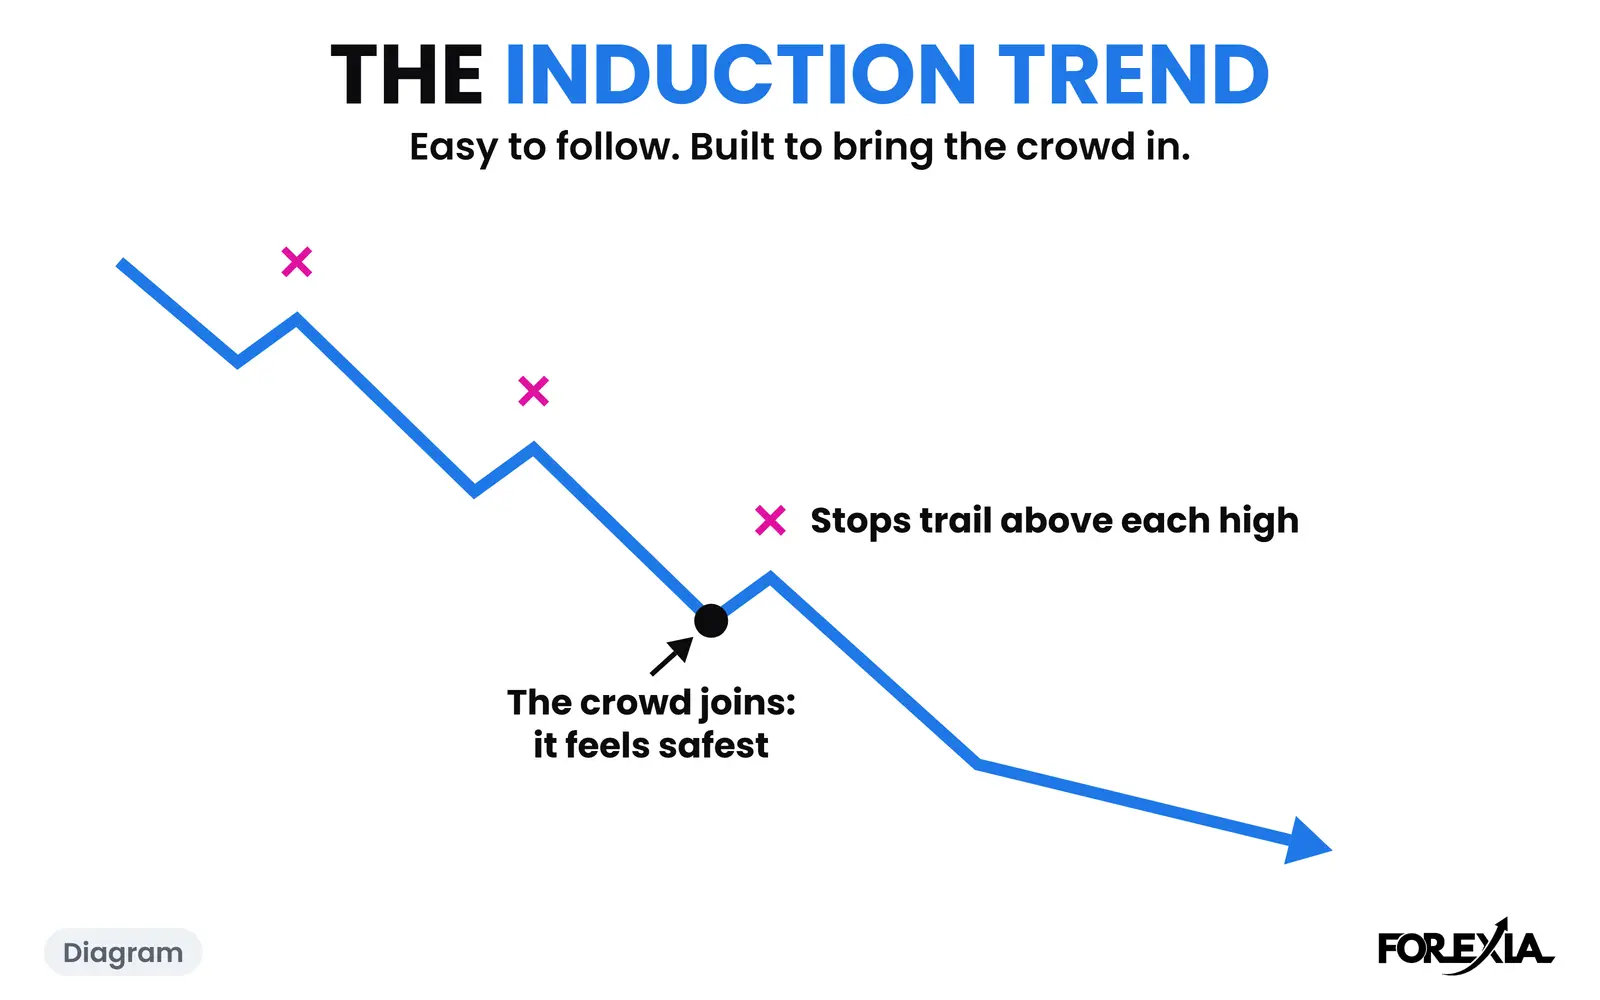
Ahead on Monday and Tuesday, behind by Friday: why you can lose money trading a trend. The Induction Trend on a real EUR/USD week, and where it stops.
6 min read
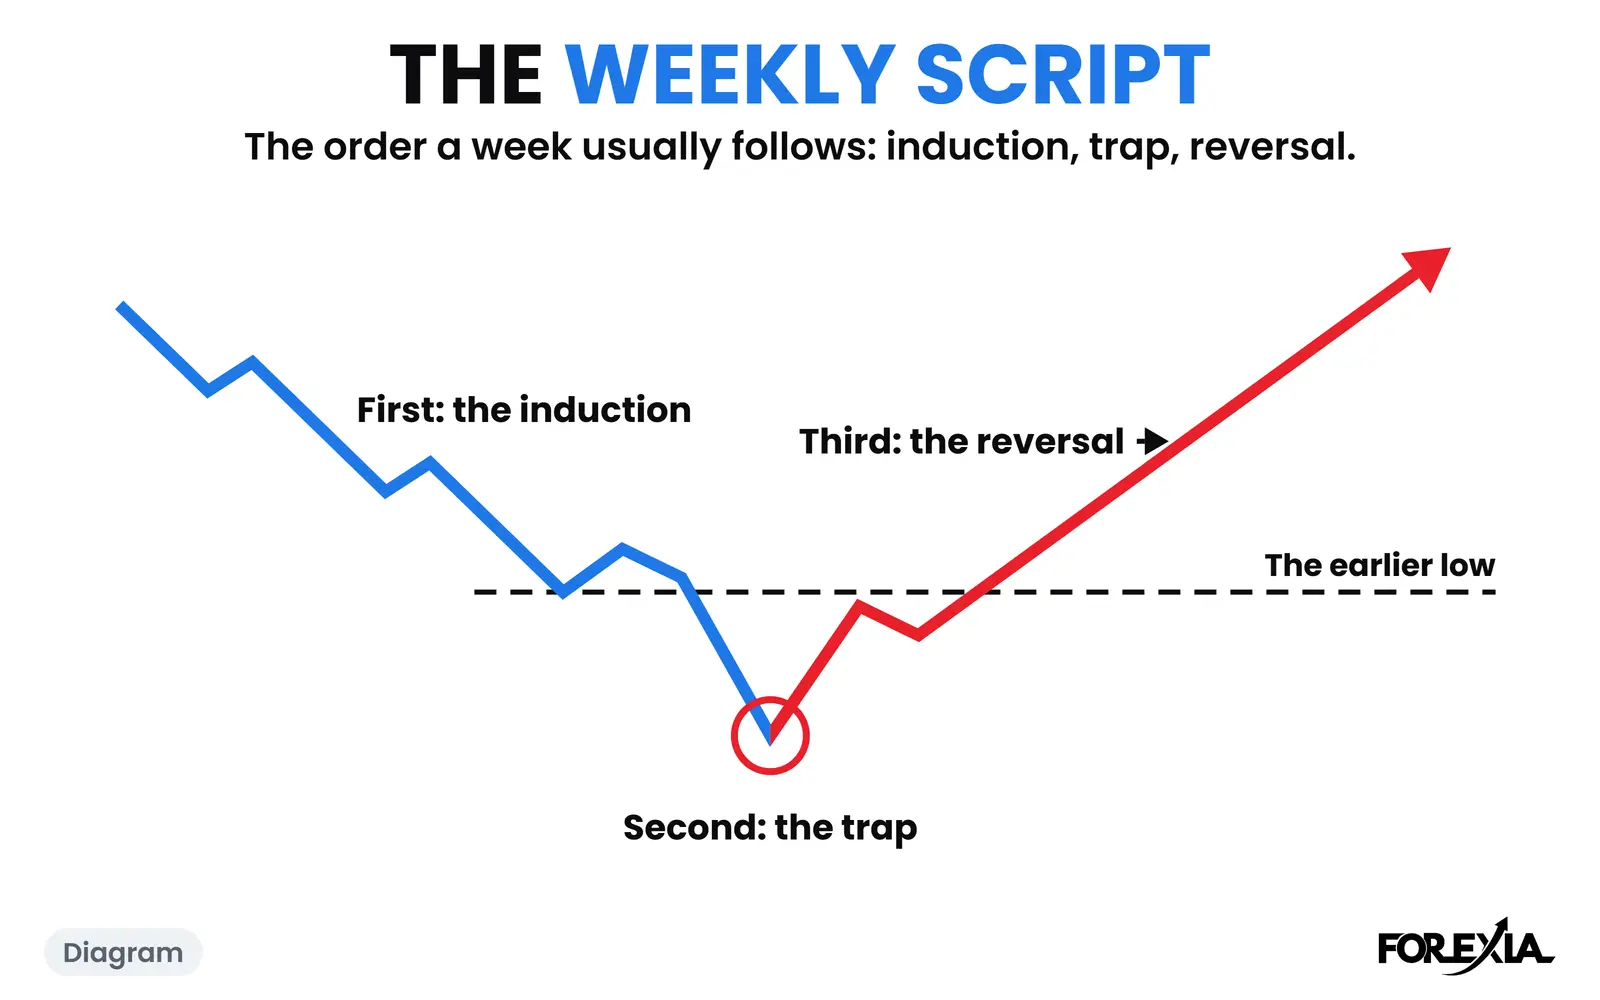
Forex weekly cycle examples from real chart markups: weeks on time, a day early, a day late, partly followed and one that never turned, read day by day.
7 min read
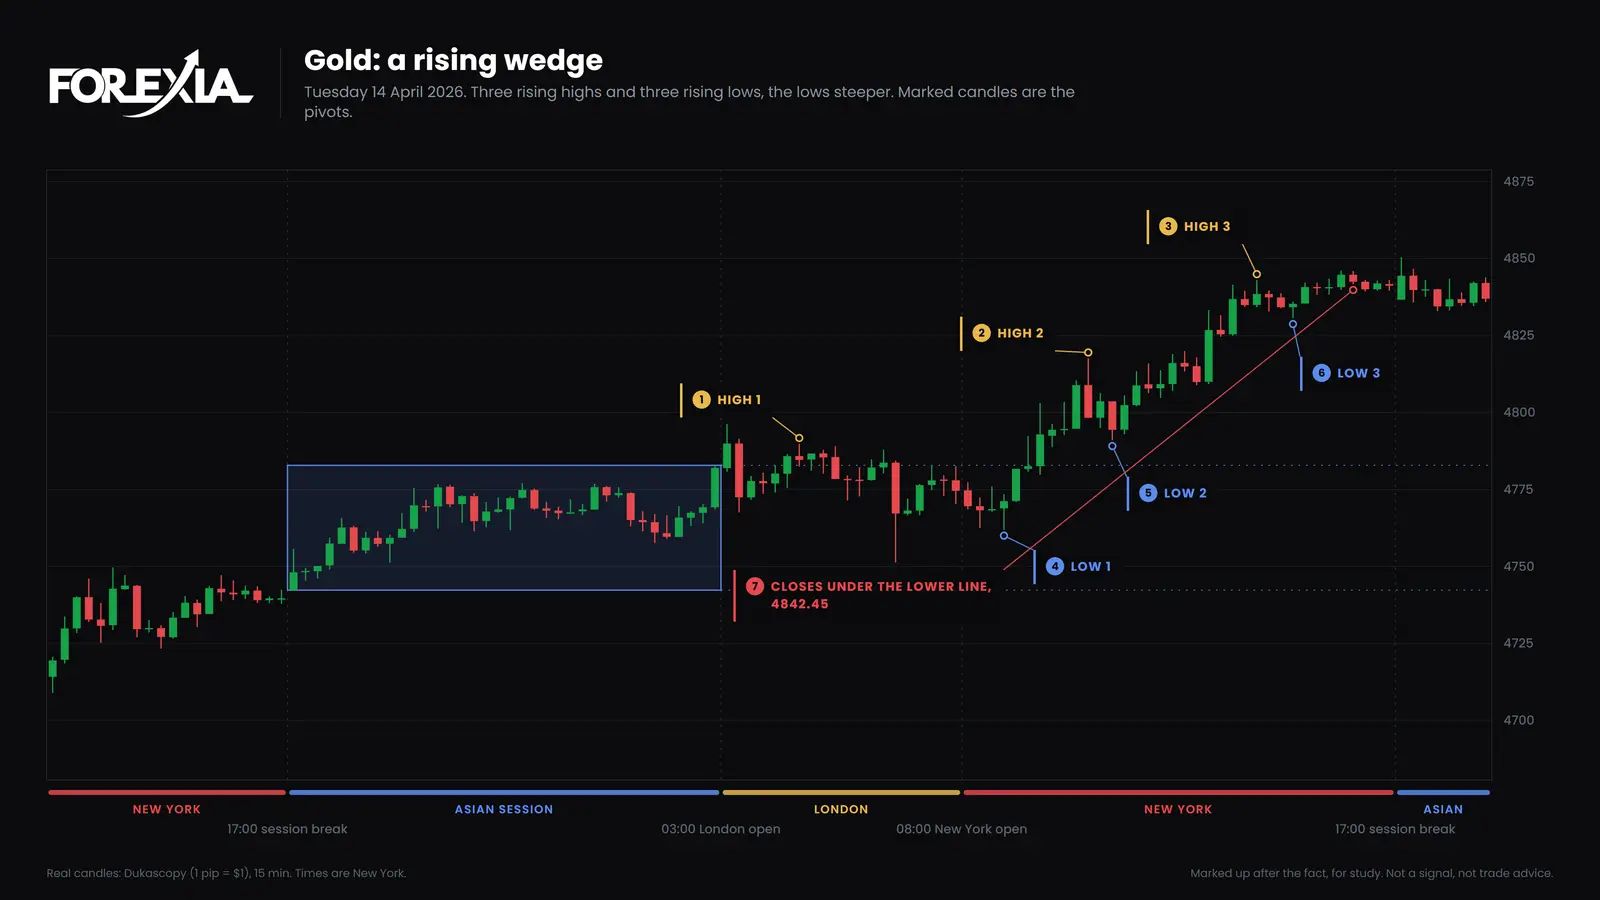
Which way does a rising wedge break? In our count of 184 on 15-minute forex and gold candles, 140 broke down and 39 up. Most of it is geometry.
6 min read
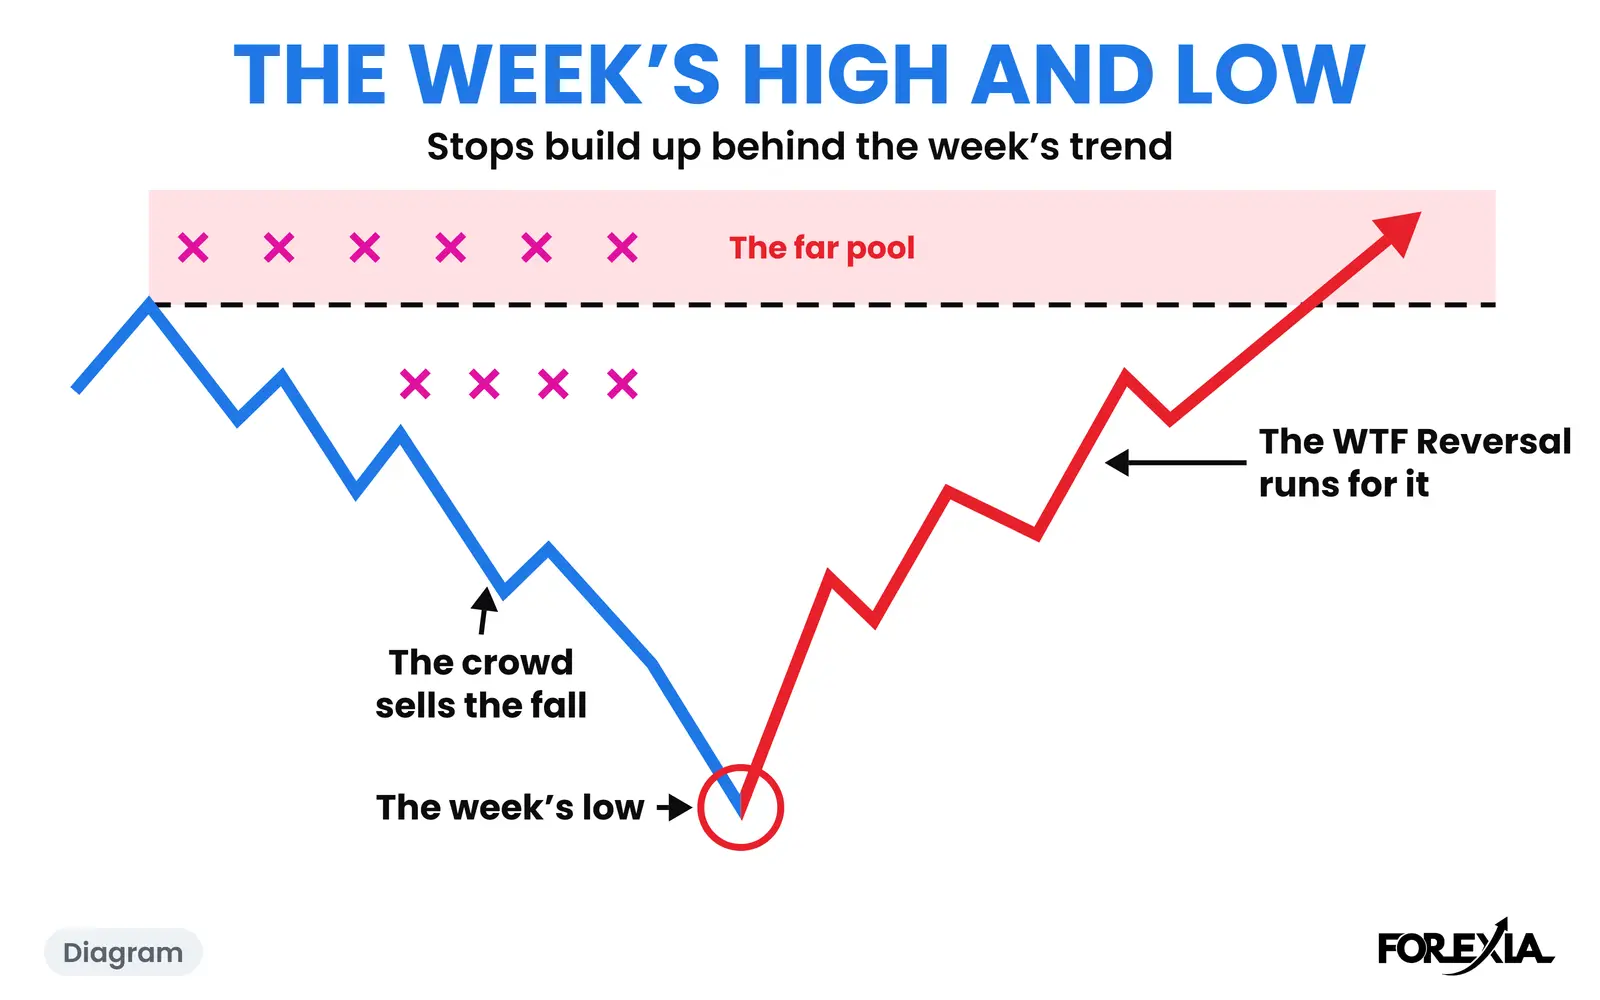
Which day is the weekly high in forex? Eight markets, week of 31 August 2026: seven made it in Wednesday's session, one earlier. One week, not a rule.
7 min read
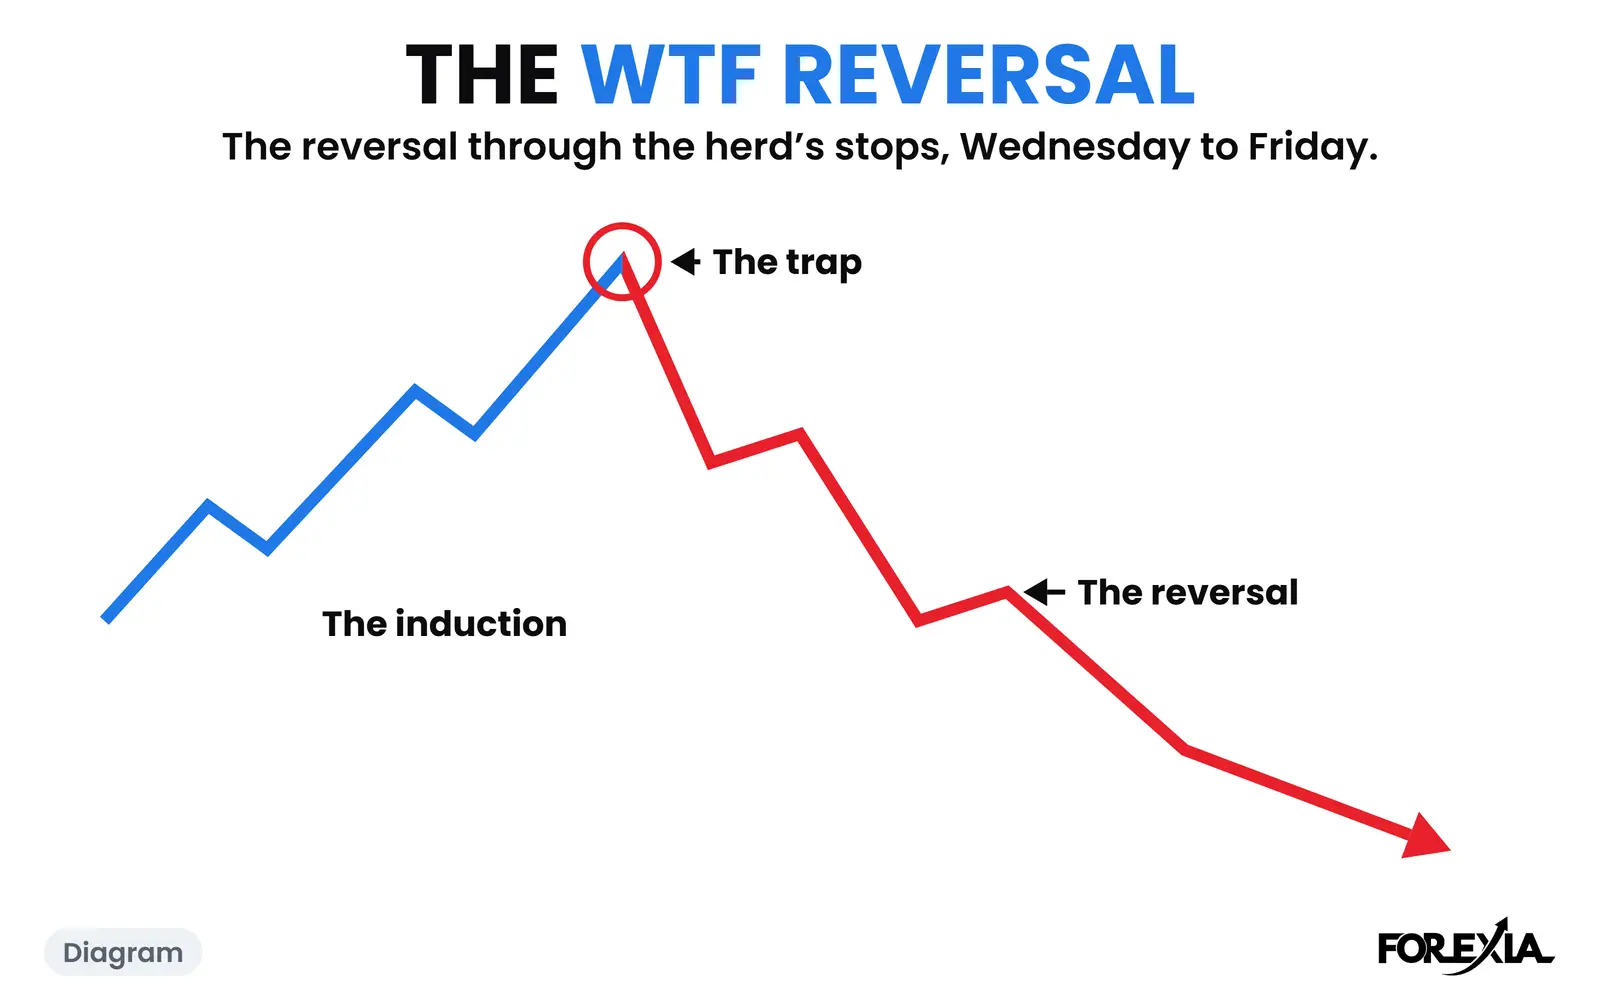
What is the WTF Reversal? The turn through the herd's stops from Wednesday to Friday. Where it sits in the week, and a real gold week that fell 261 pips.
6 min read
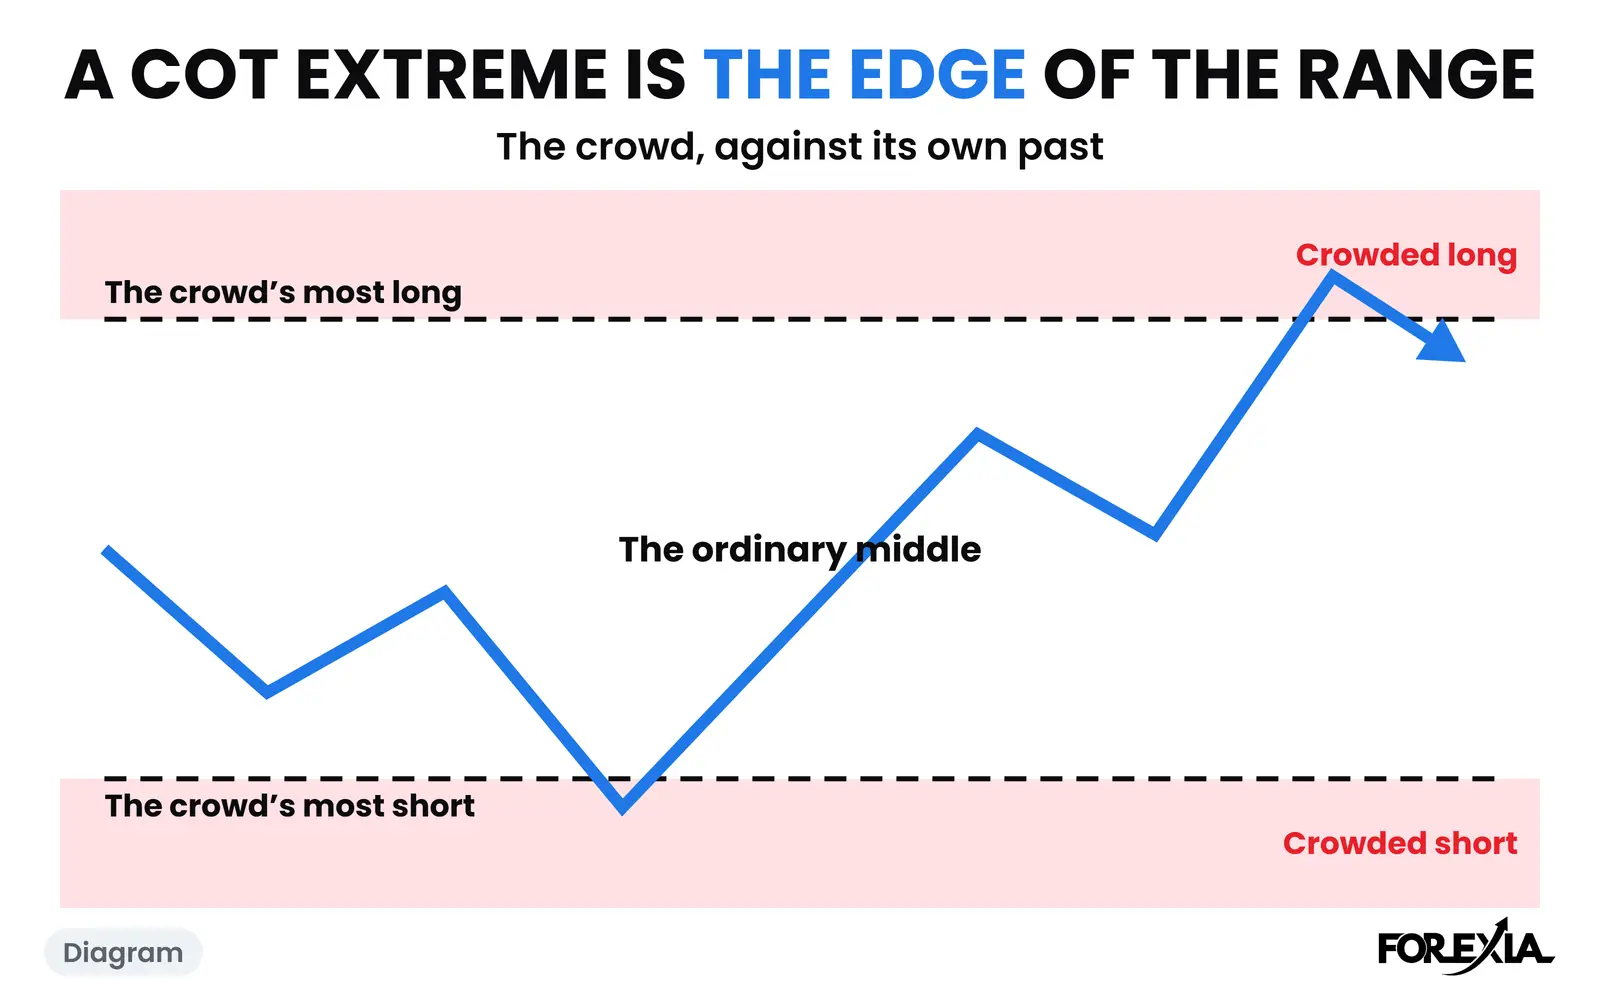
What is a COT extreme? An index of 20 or under, or 80 or over, how often it happens on eight markets at 20 and 80 or 10 and 90, and its limits.
7 min read
A weekly trading routine for forex, from Sunday's map to Friday's score, built on the Weekly Script and a daily read. One job a day, with real figures.
6 min read
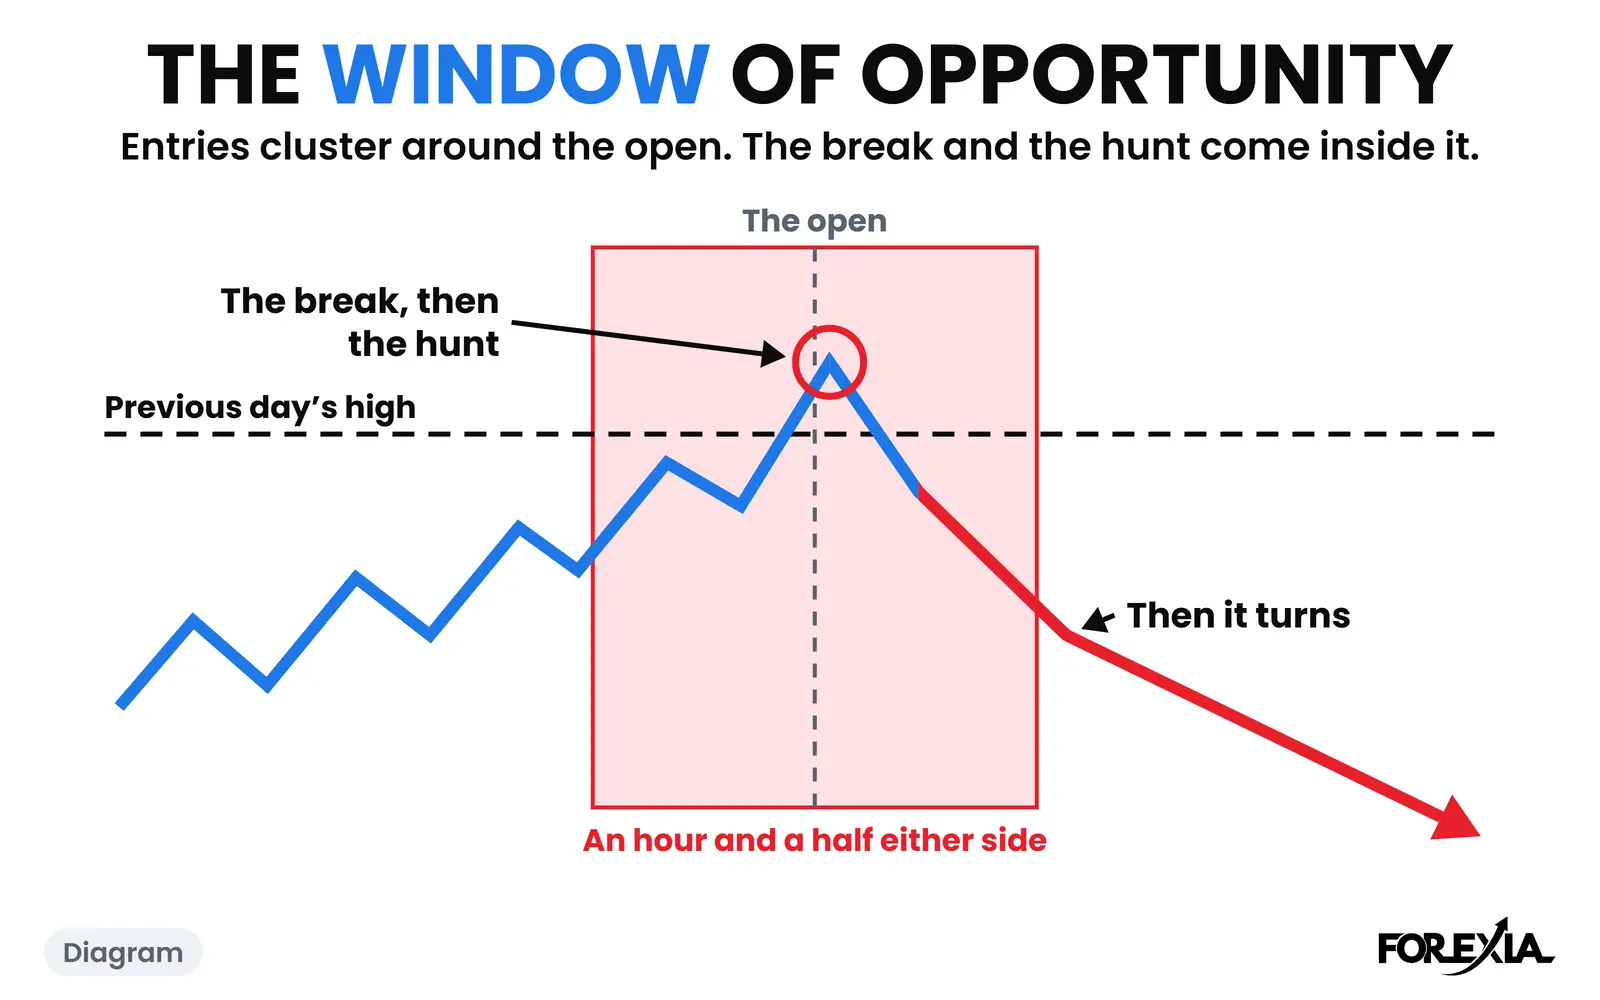
Most wedge pattern trading stops at the pattern. See why the #SignatureTrade needs a wedge, a clear Asian range and a window, in that order, on a real day.
6 min read
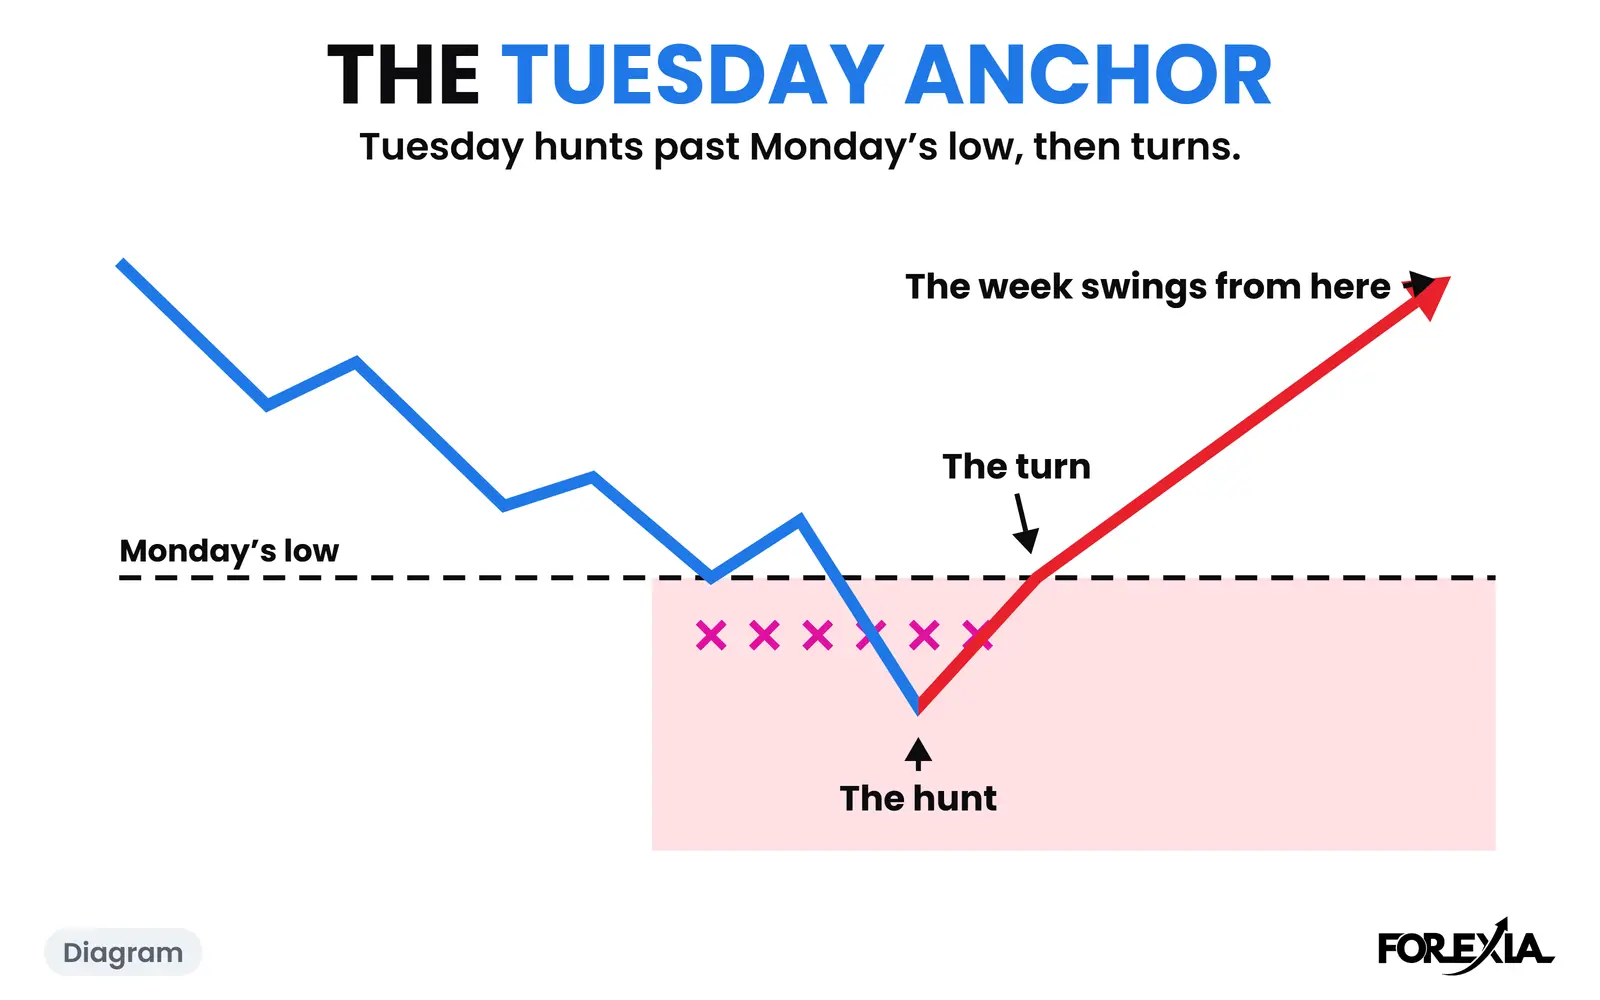
Tuesday reversal forex, on three real Tuesdays: GBP/USD turned, USD/CAD slipped a day and gold never turned. Compare the three weeks side by side.
6 min read
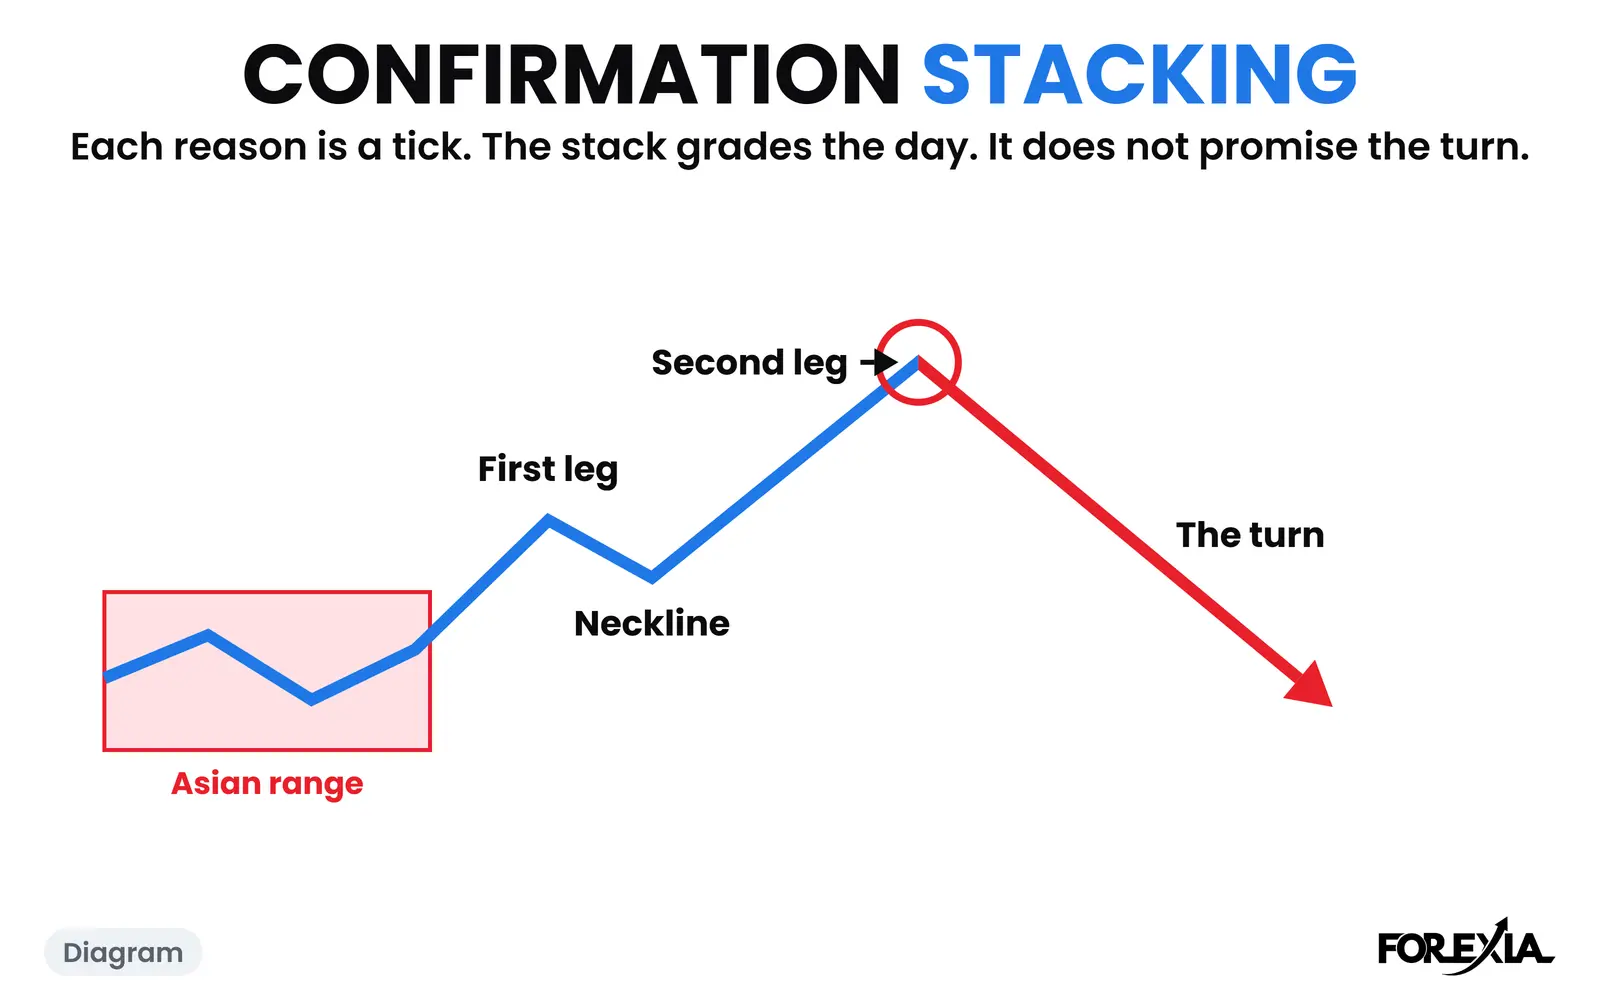
Confluence trading forex means more than one reason on a chart. What counts as one reason, what counts twice, and one day that stacked six of eight.
6 min read
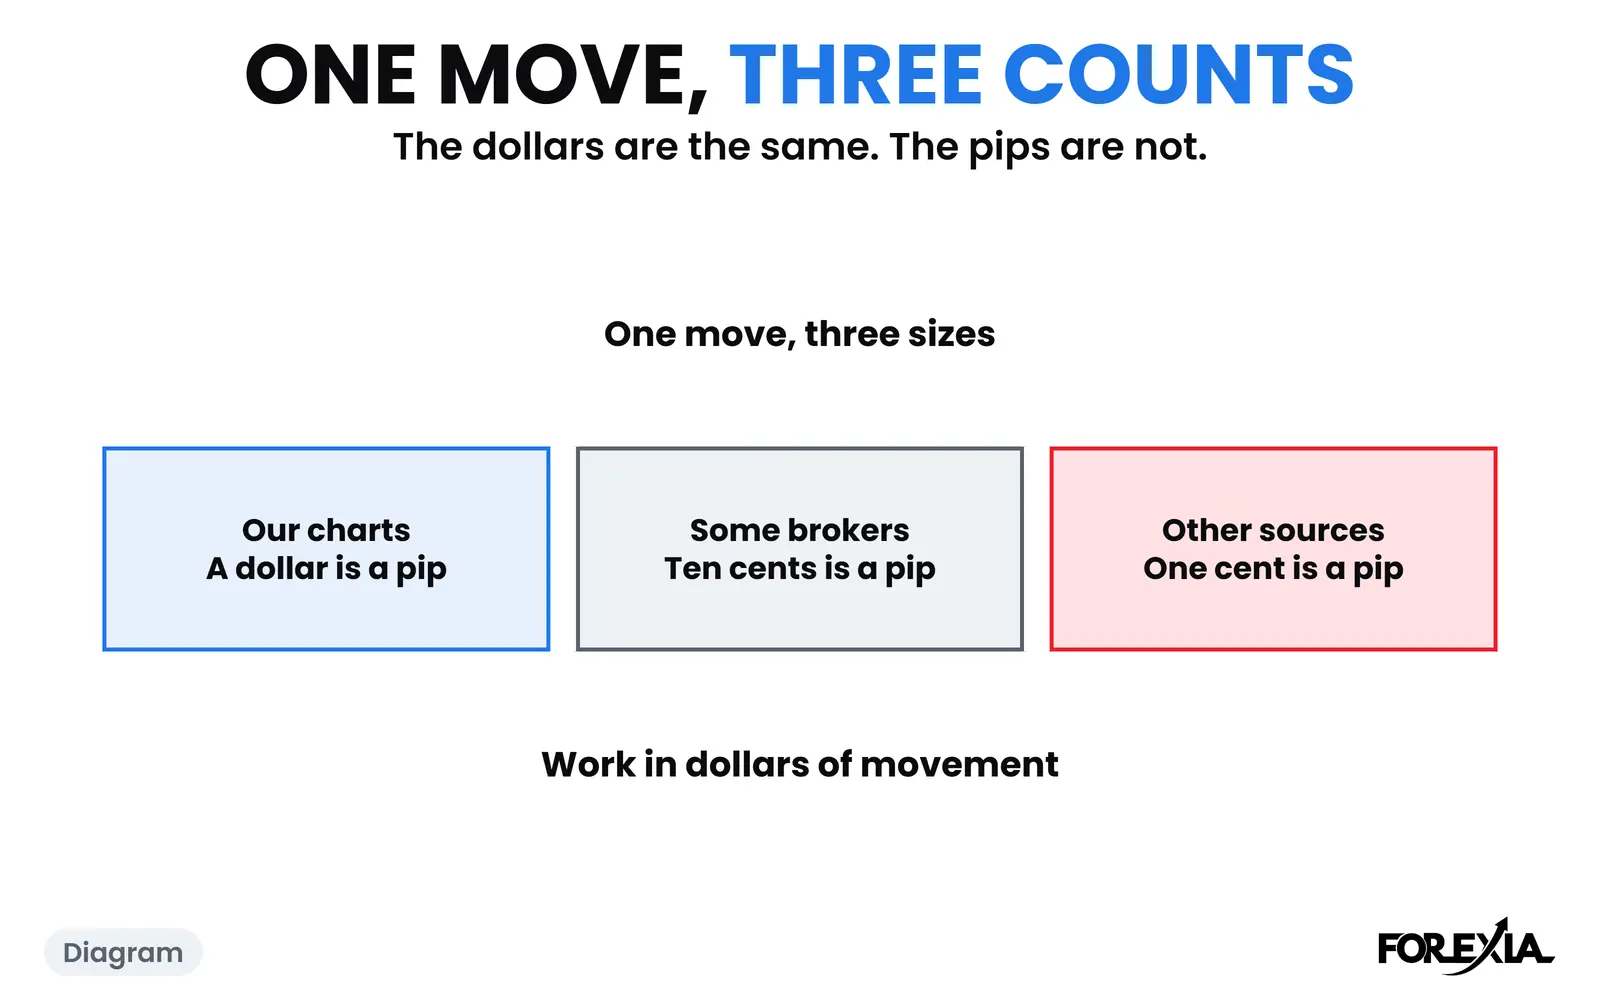
XAUUSD pip value: on our charts $1 is one pip, so a pip is $100 on a 100-ounce lot. Why brokers differ, with one real 127-pip day counted three ways.
6 min read
Trade management forex starts after the fill. What 1,601 levels did next, what our test found about stops and exits, and the bot's four closed trades.
6 min read
Thursday reversal forex: not every week turns on Wednesday. Real weeks where the turn slipped to Thursday, and one that never turned, shown chart by chart.
6 min read
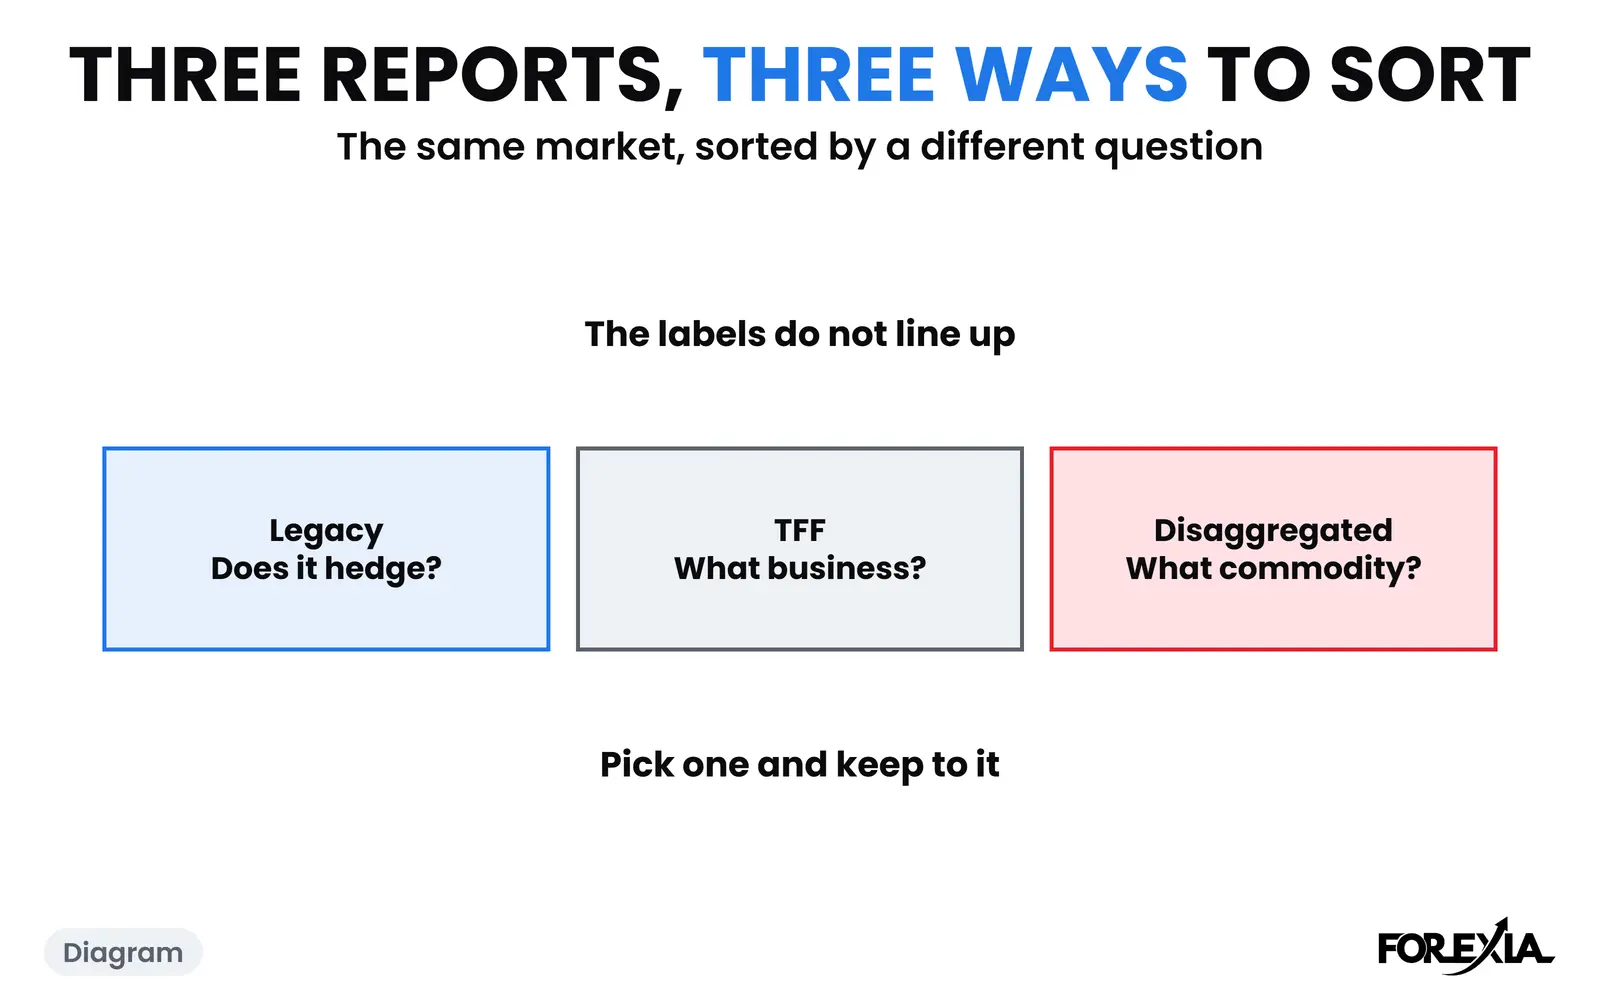
COT legacy vs disaggregated vs TFF: what each CFTC report covers, how it sorts traders, and the real euro and gold figures that show the groups differ.
8 min read
Rising wedge vs falling wedge vs ascending triangle: what separates the three, and how 184 rising and 153 falling wedges broke on forex candles.
6 min read
Why do trading setups fail? Our setup, run as a fixed rule with real costs, lost in every period from 2015 to 2026. The reasons and two real days.
6 min read
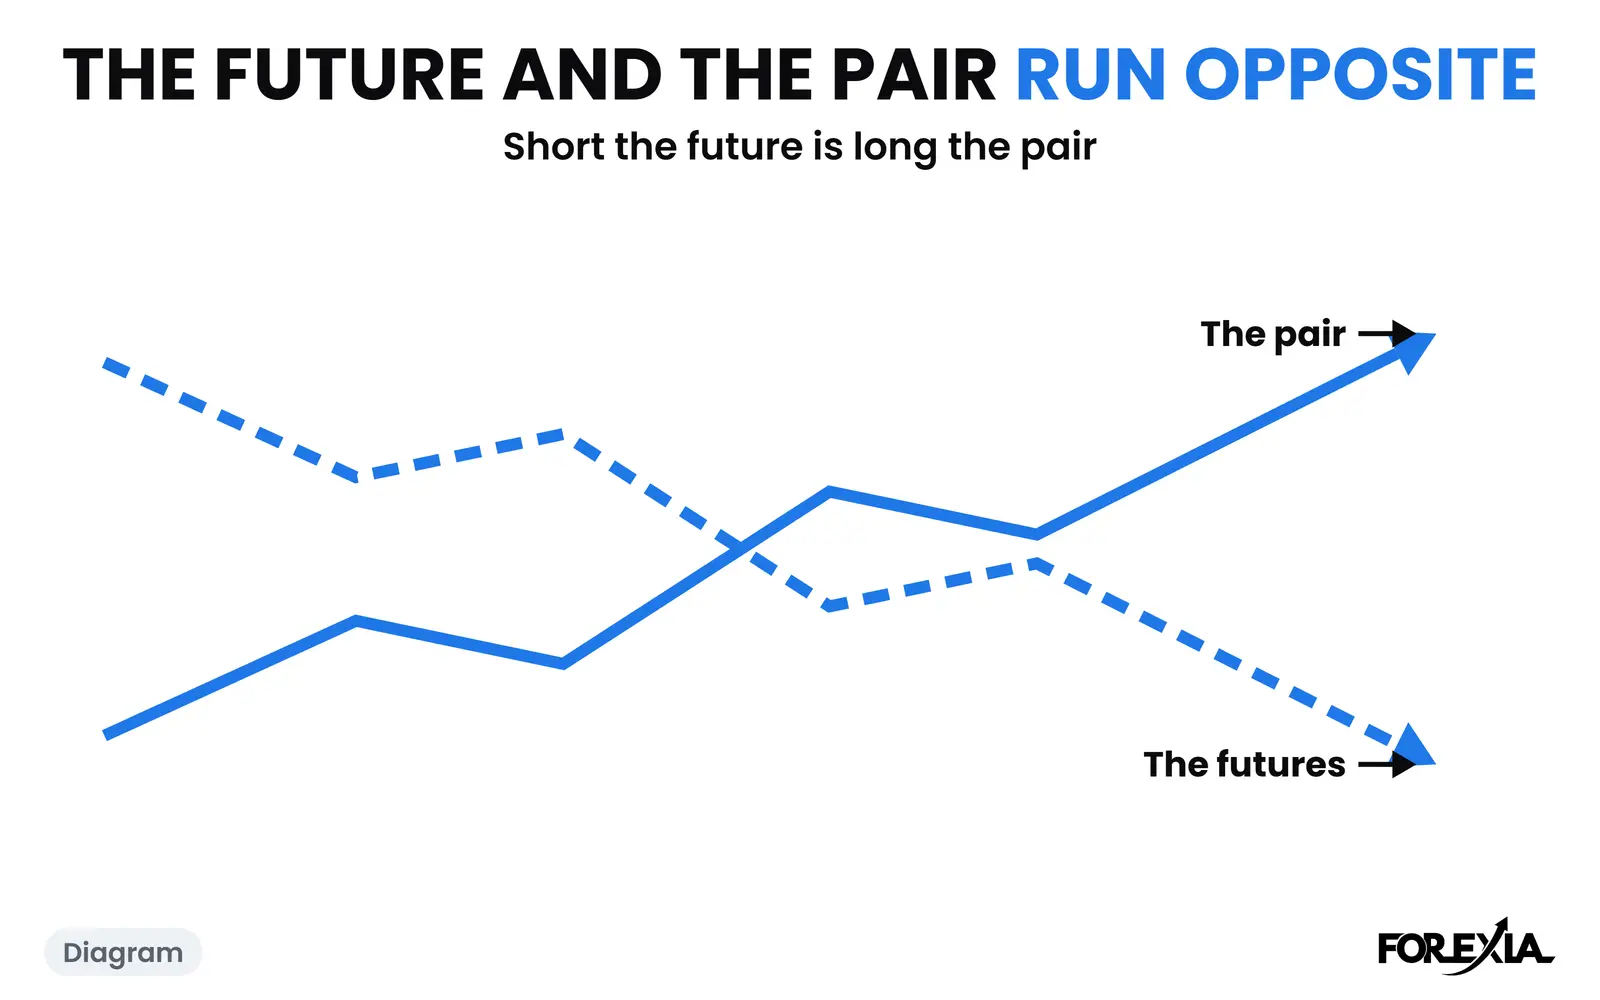
The yen COT report backwards: yen, franc and Canadian dollar futures run opposite to the pair. How to turn them round, with real figures and a real fall.
7 min read
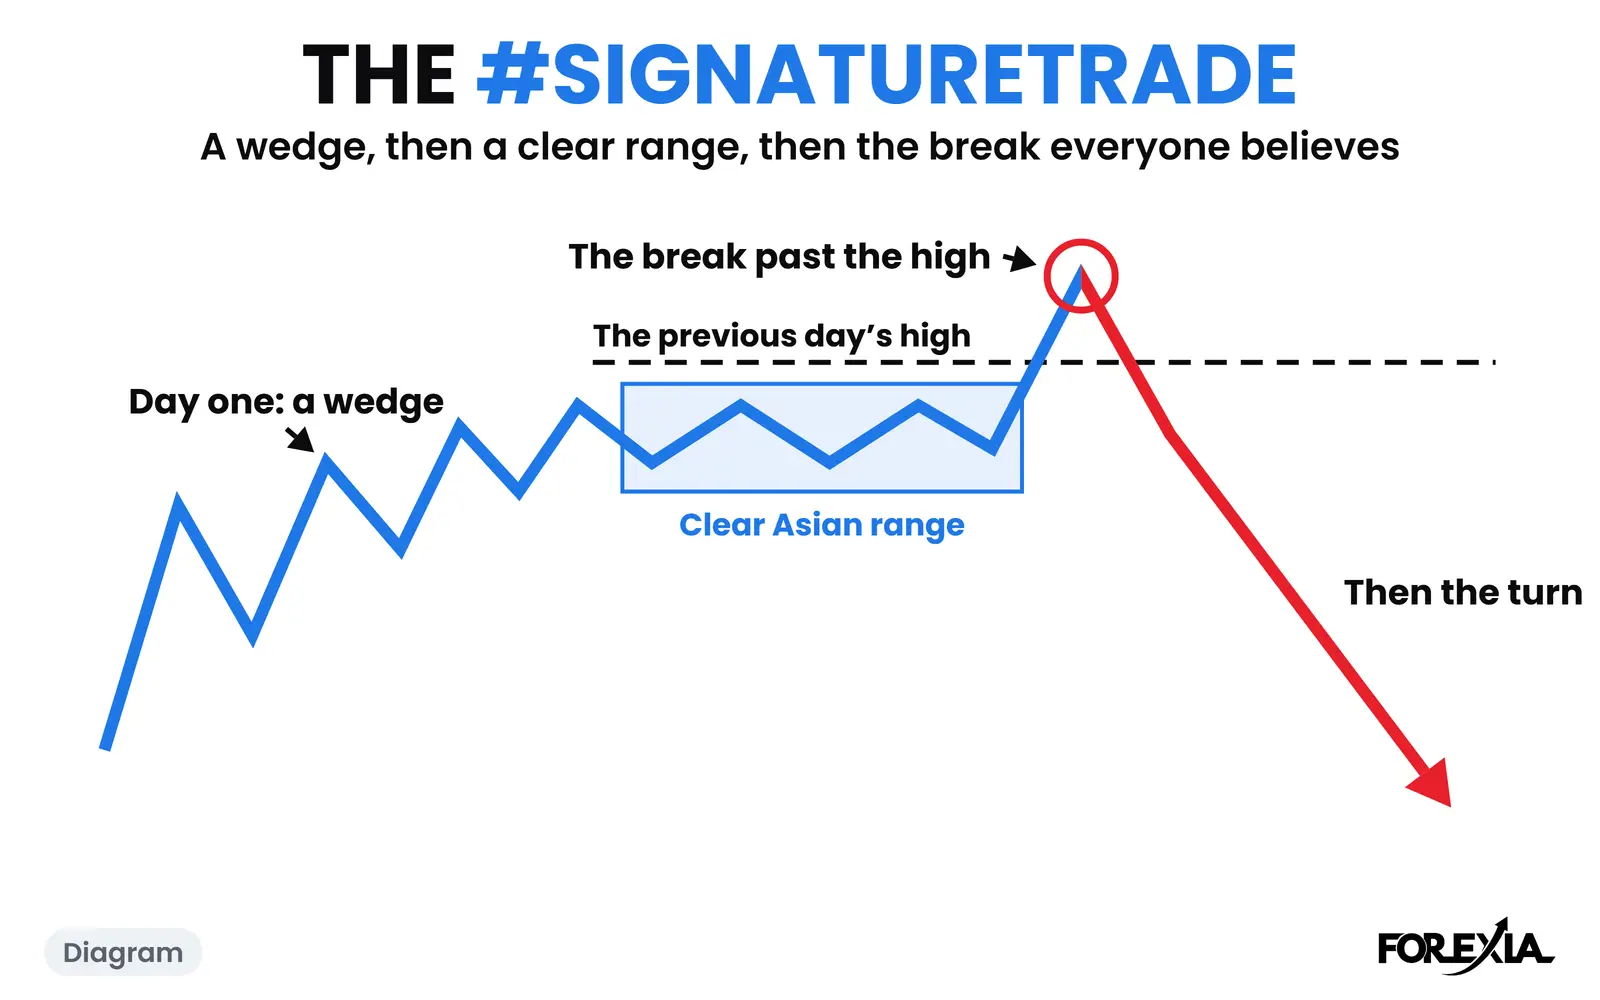
A rising wedge breakout looks like a continuation. See who the #SignatureTrade says is trapped, a real gold wedge, and what our own test found.
6 min read
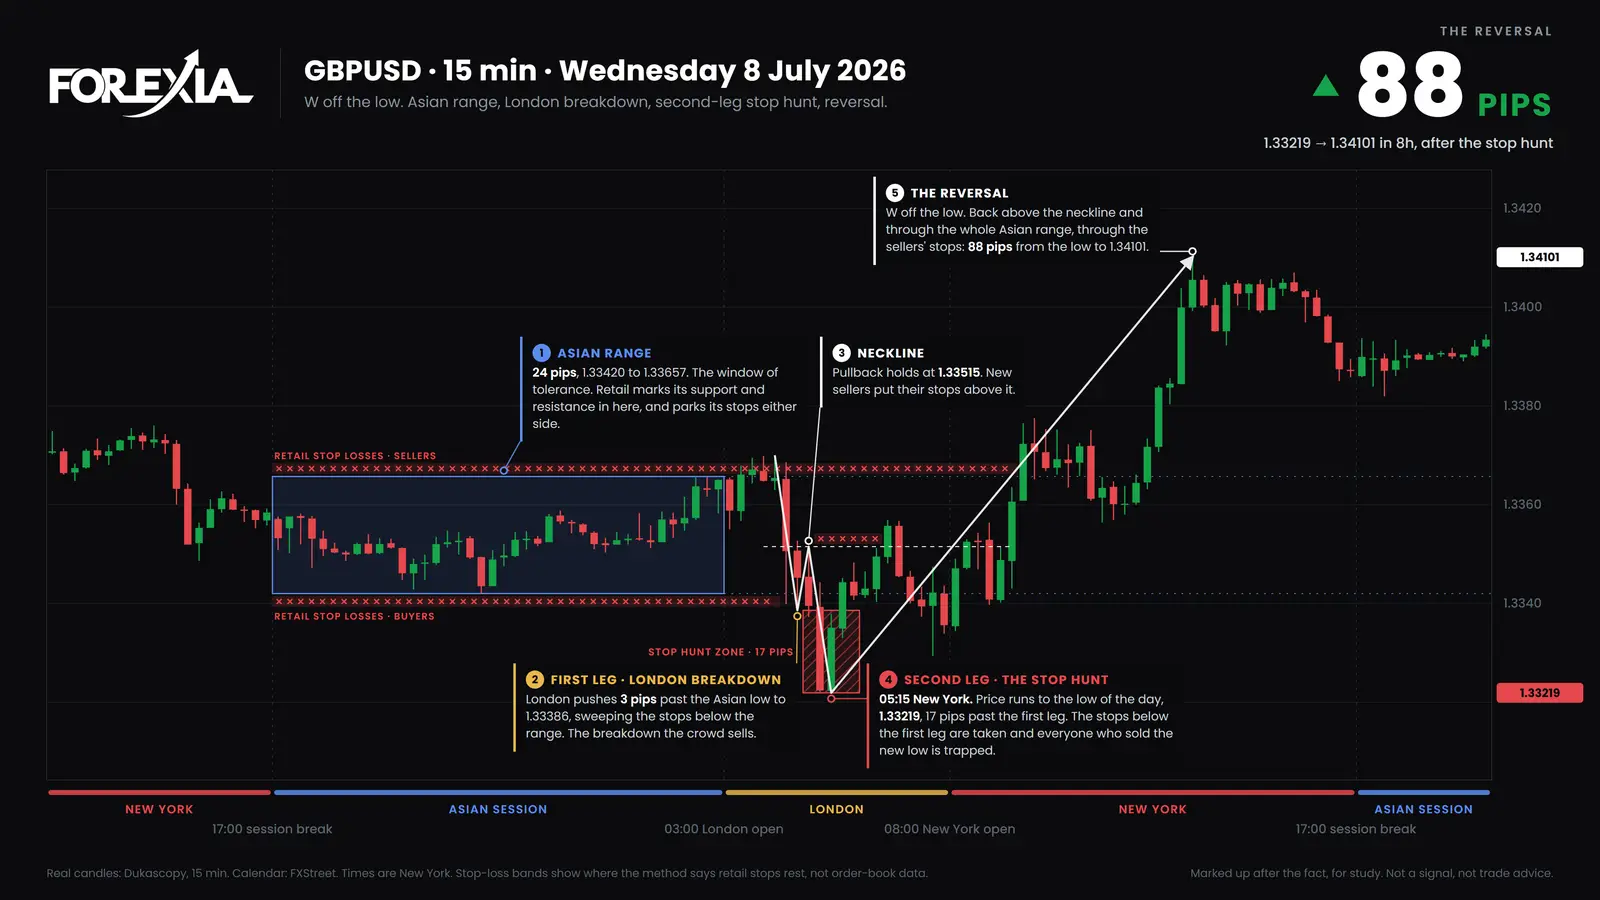
Price action trading without indicators, read on one real GBP/USD day, 8 July 2026, candle by candle. Why averages arrive late: 1,132 crosses counted.
6 min read
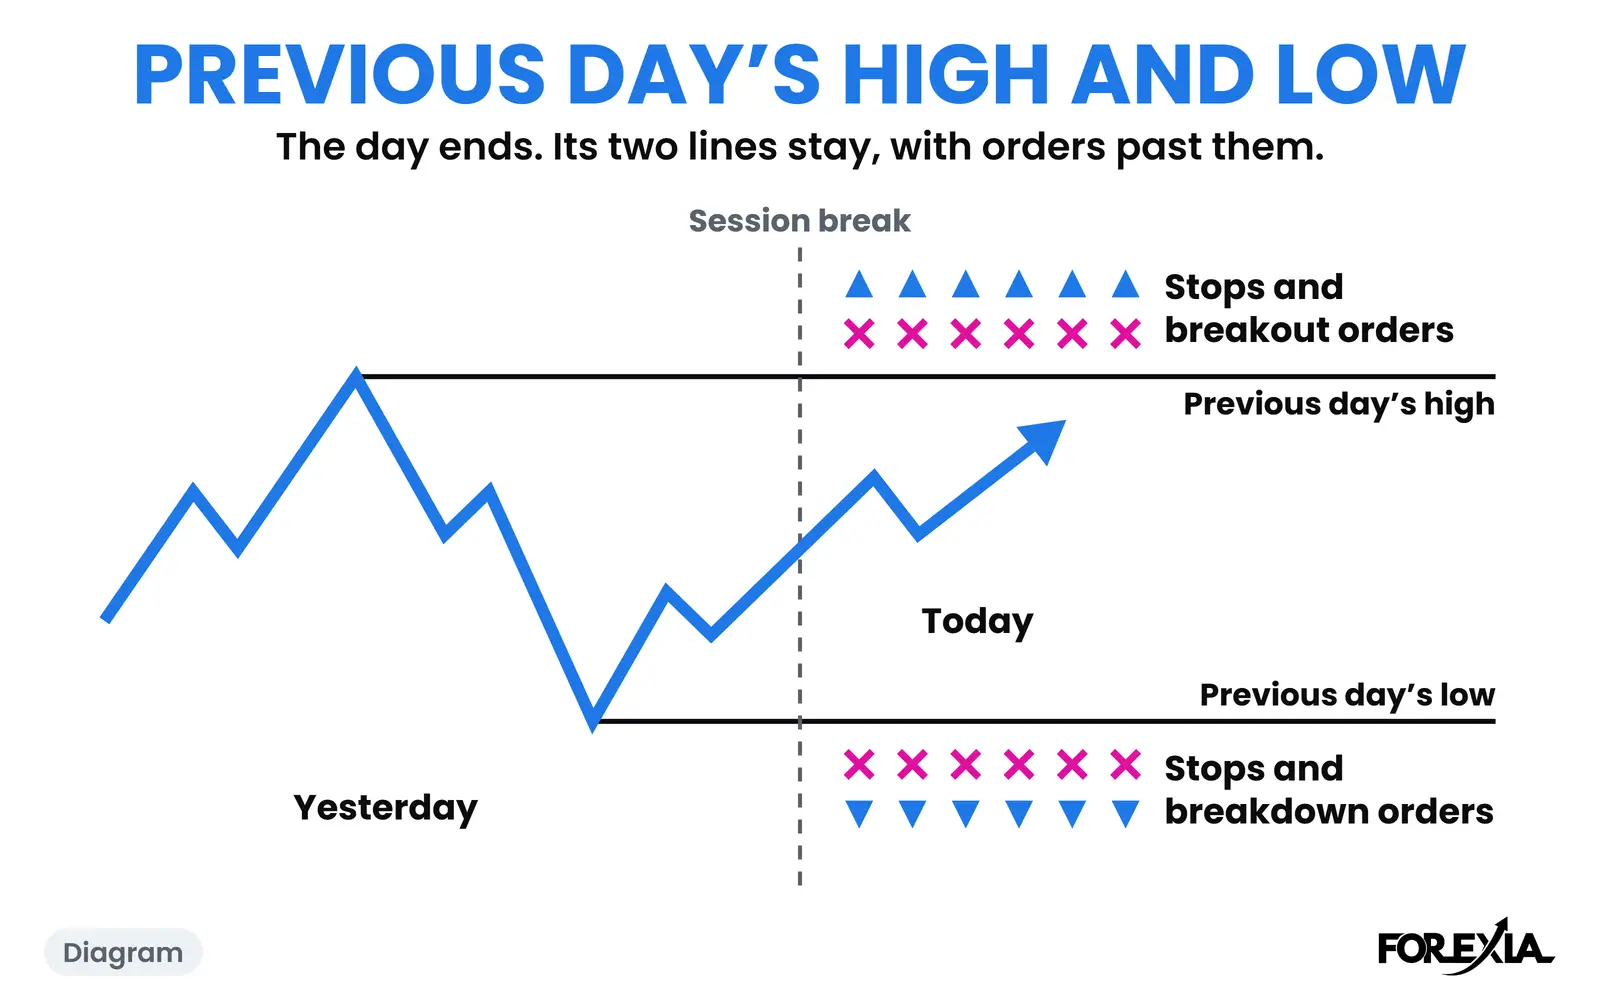
A previous day high breakout at the London open looks like a continuation. Of 422 previous-day levels taken on forex and gold, 341 closed back that day.
7 min read
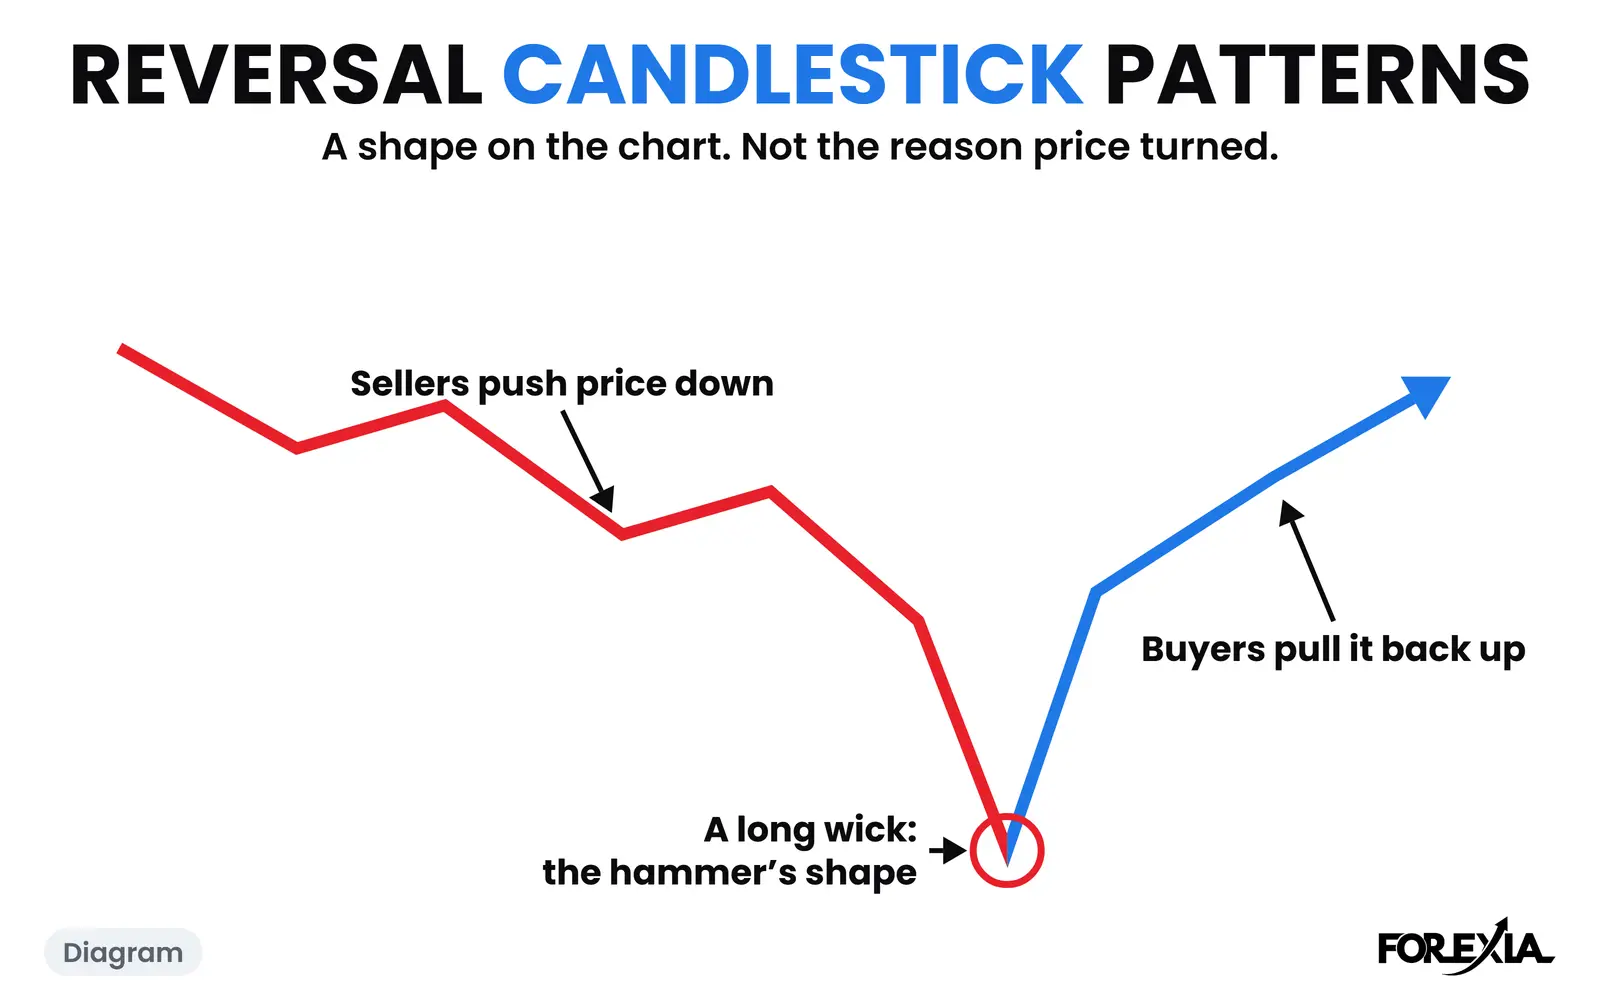
Pin bar vs engulfing candle, tested: 771 pin bars and 1,721 engulfing candles went no further than any other new low or high. A real day is shown.
6 min read
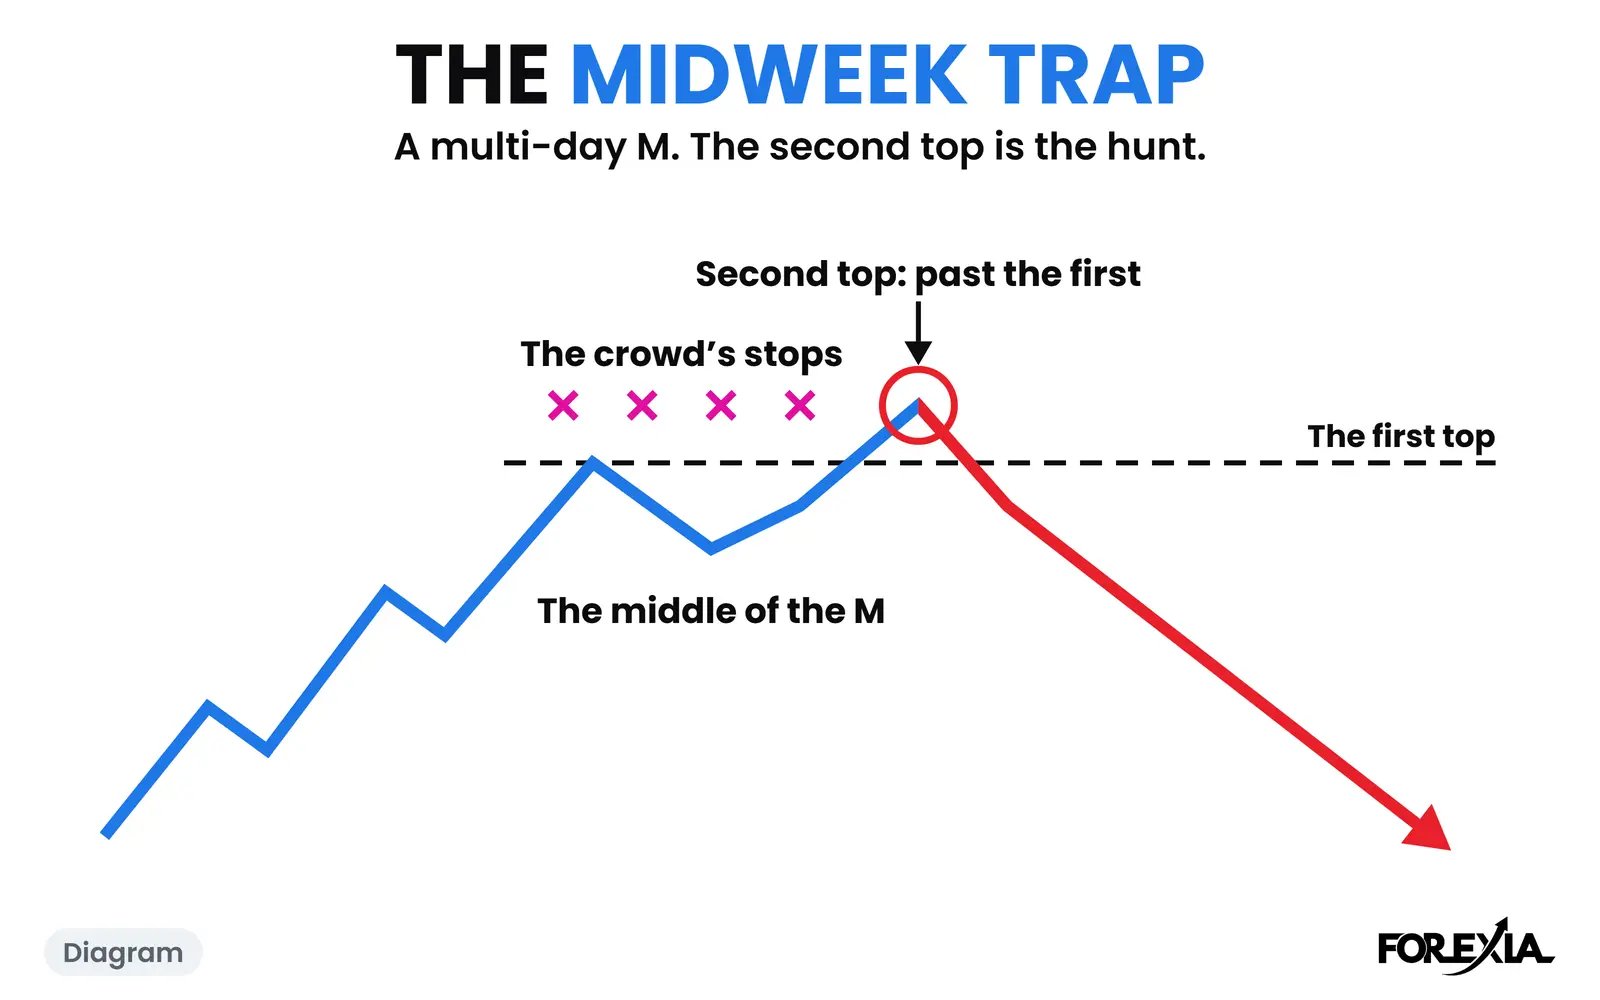
Why does price consolidate on Wednesday before reversing? Sometimes, as on USD/JPY. The Midweek Trap on a real week, and weeks that never went quiet.
6 min read
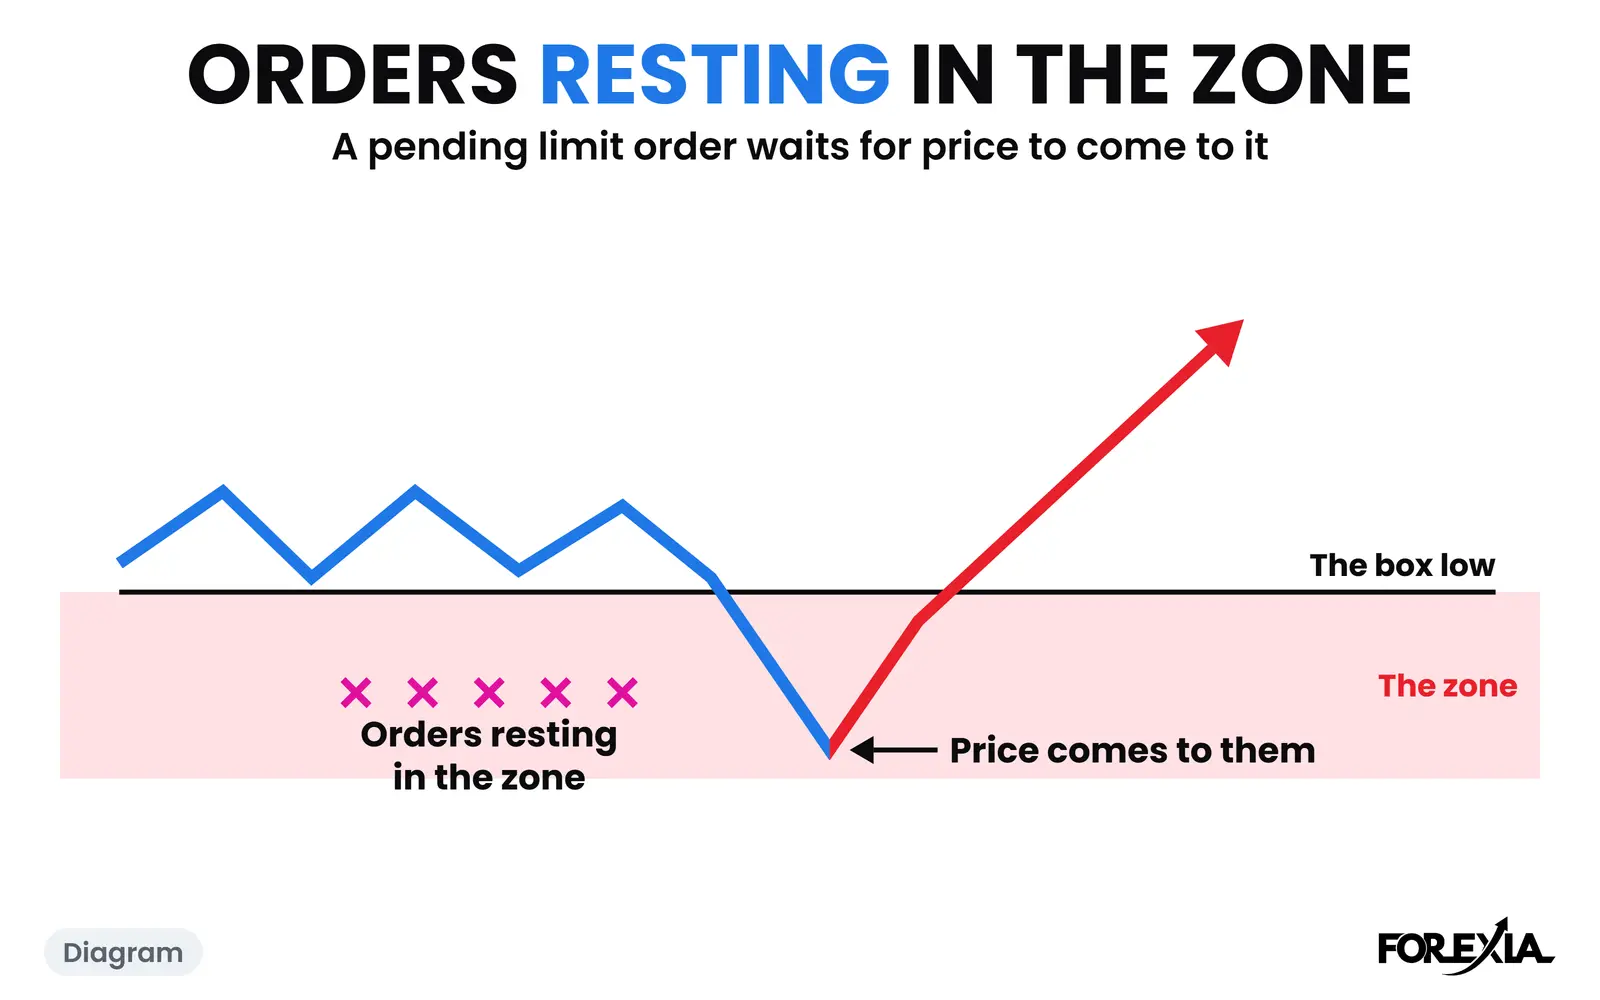
Pending orders before London open wait where the crowd's stops rest. Three real days show what a resting order met, and how far price went past the level.
7 min read
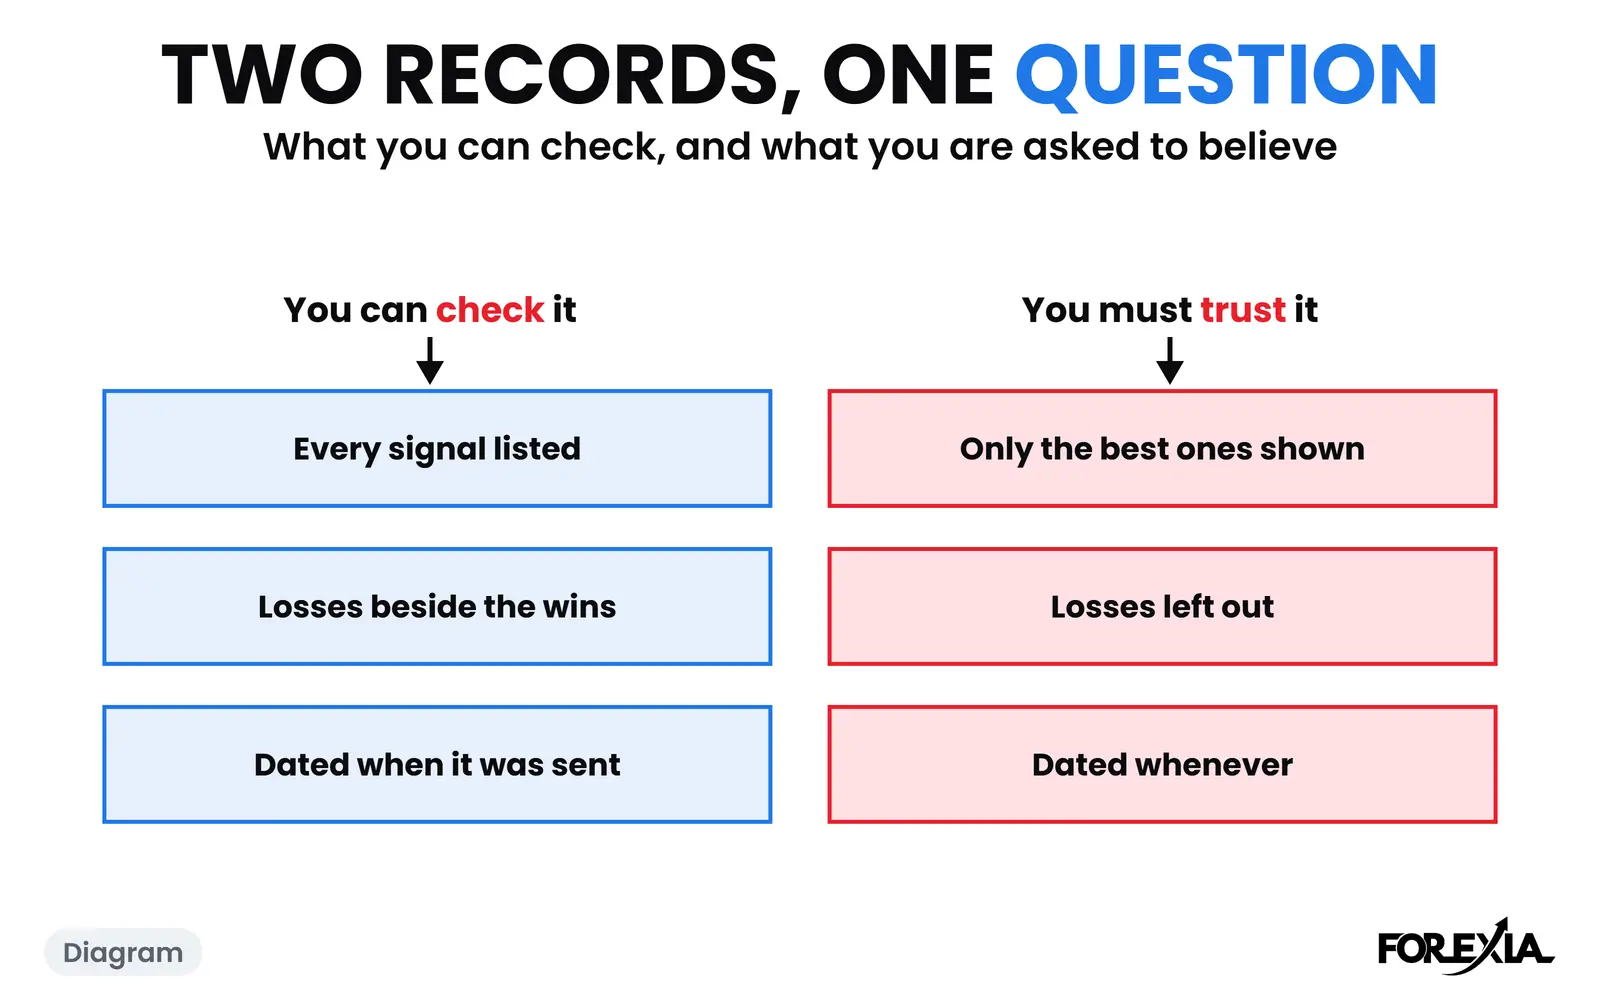
Paid forex course vs YouTube: what a video teaches, what a course adds, and five questions to ask before you pay. No promises and no results claimed.
6 min read
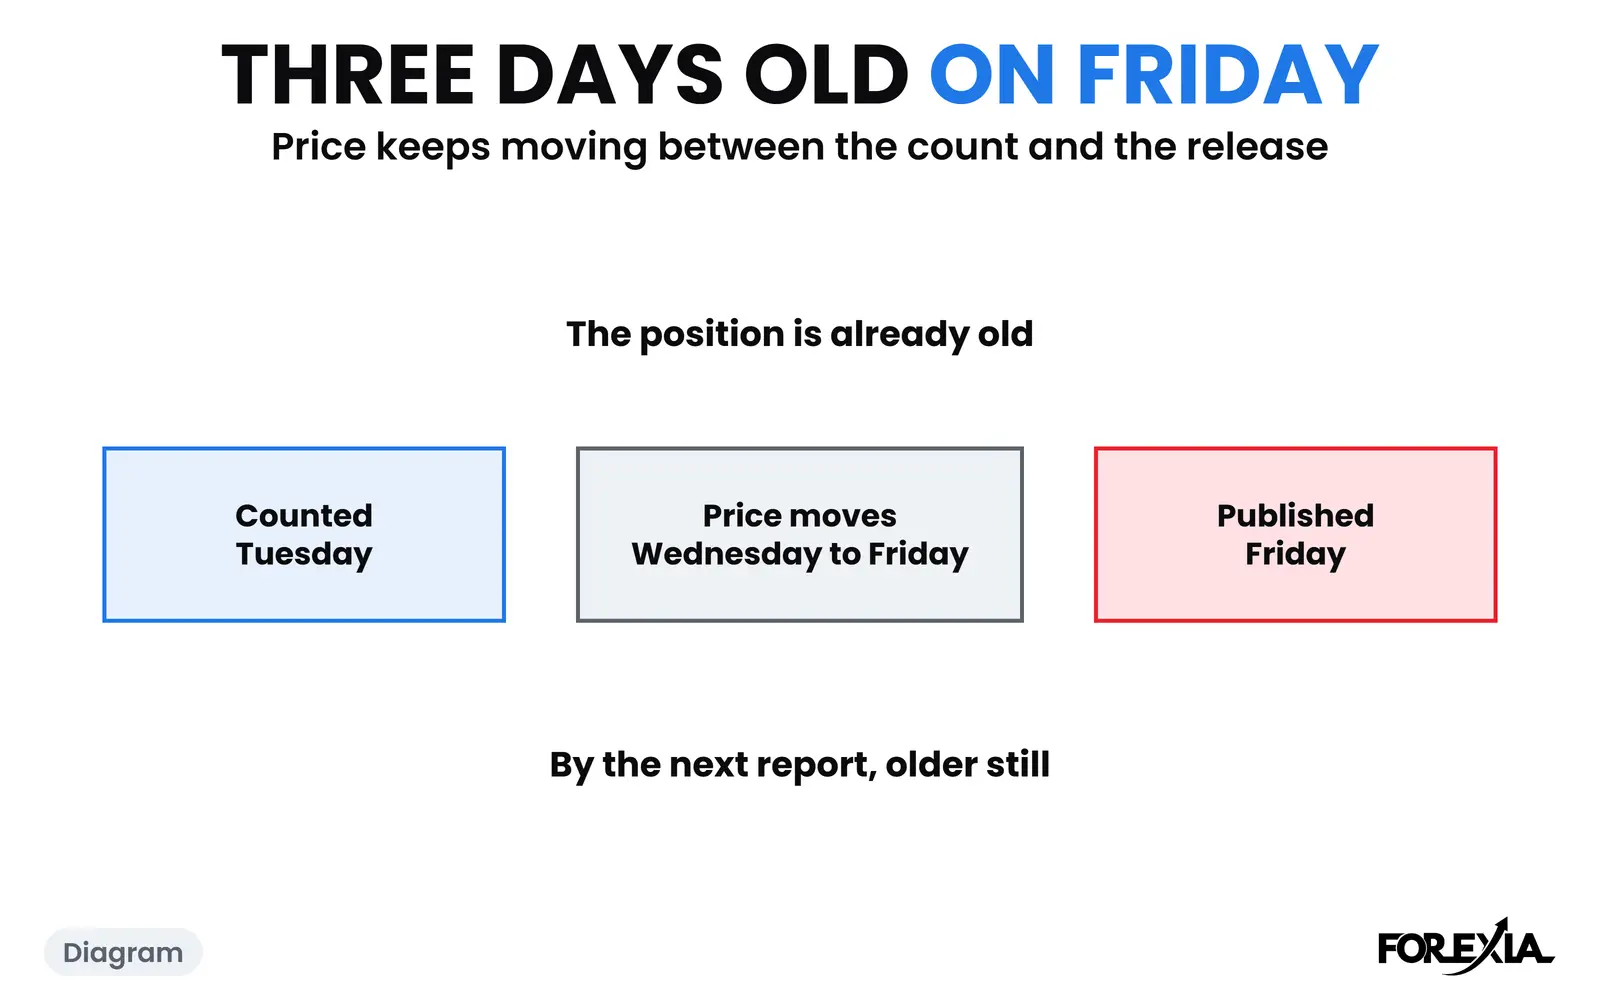
Is the COT report lagging? Yes, by three days at release. How far positions move in a week, from 1,240 real weekly changes, and two days price moved first.
8 min read
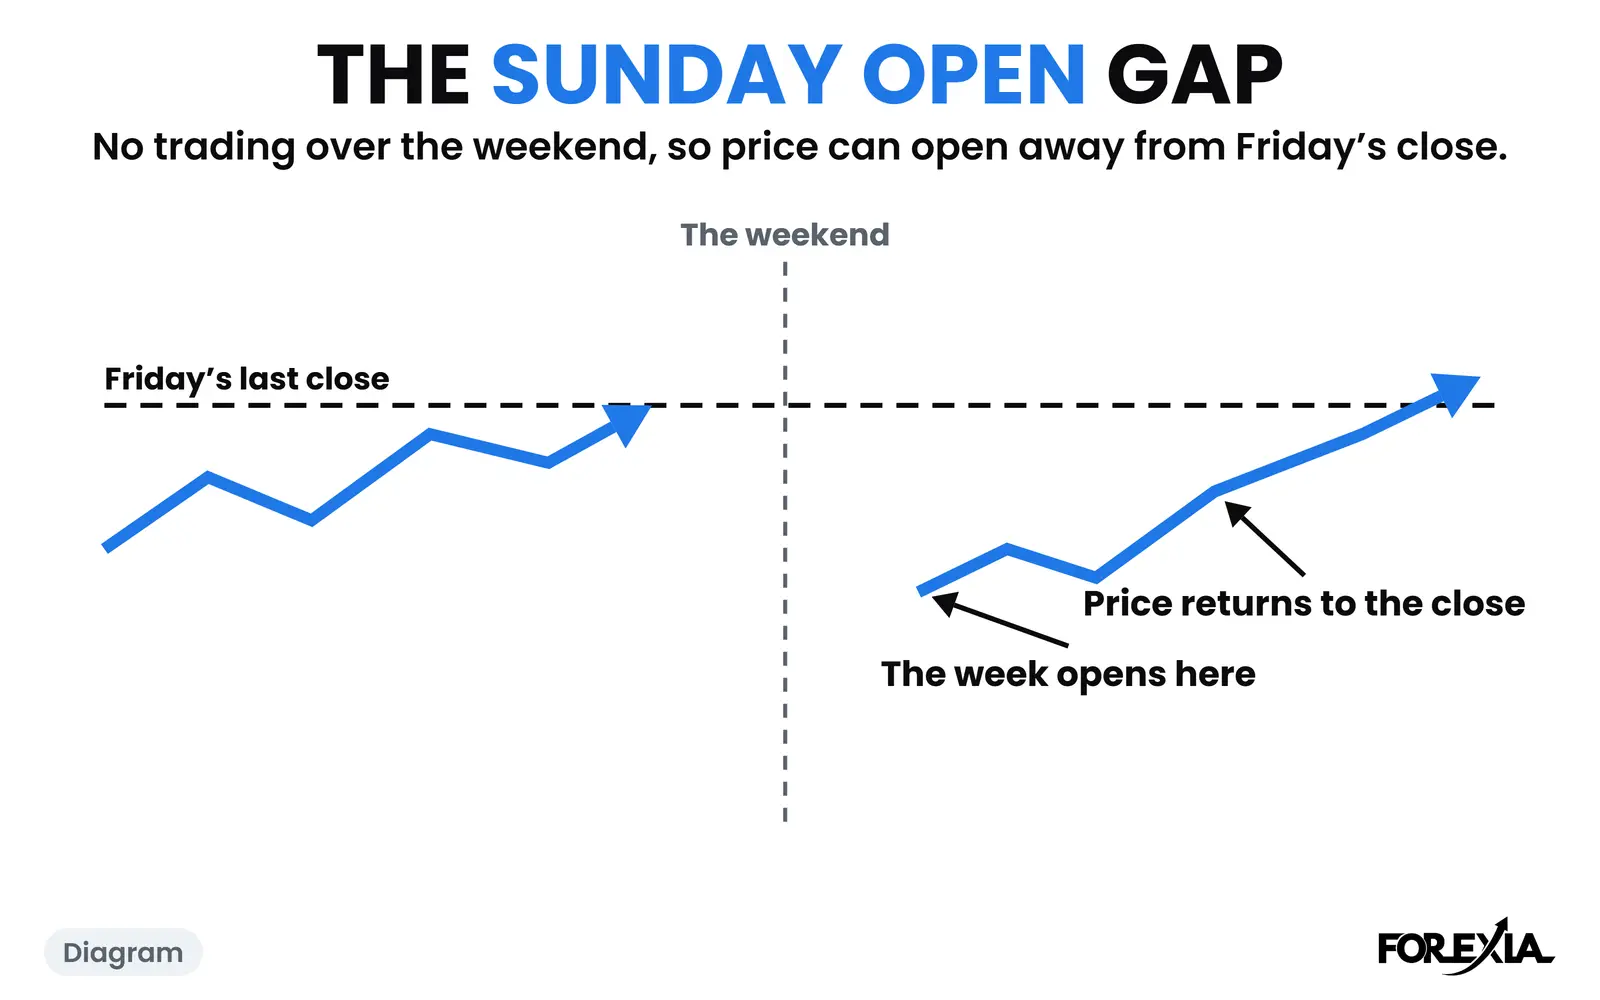
Is Friday a bad day to trade forex? Not a small one: median range 89% of the average day. Real Fridays, the weekend gap and what a range count cannot say.
6 min read
How to spot the Tuesday Anchor on a finished chart: Tuesday hunts Monday's high or low, closes back and the week swings from it. A real GBP/USD day.
6 min read
Why is Monday slow in forex? Median range 86% of the average day, little scheduled and a thin start. Real Mondays that were not slow, and what that says.
6 min read
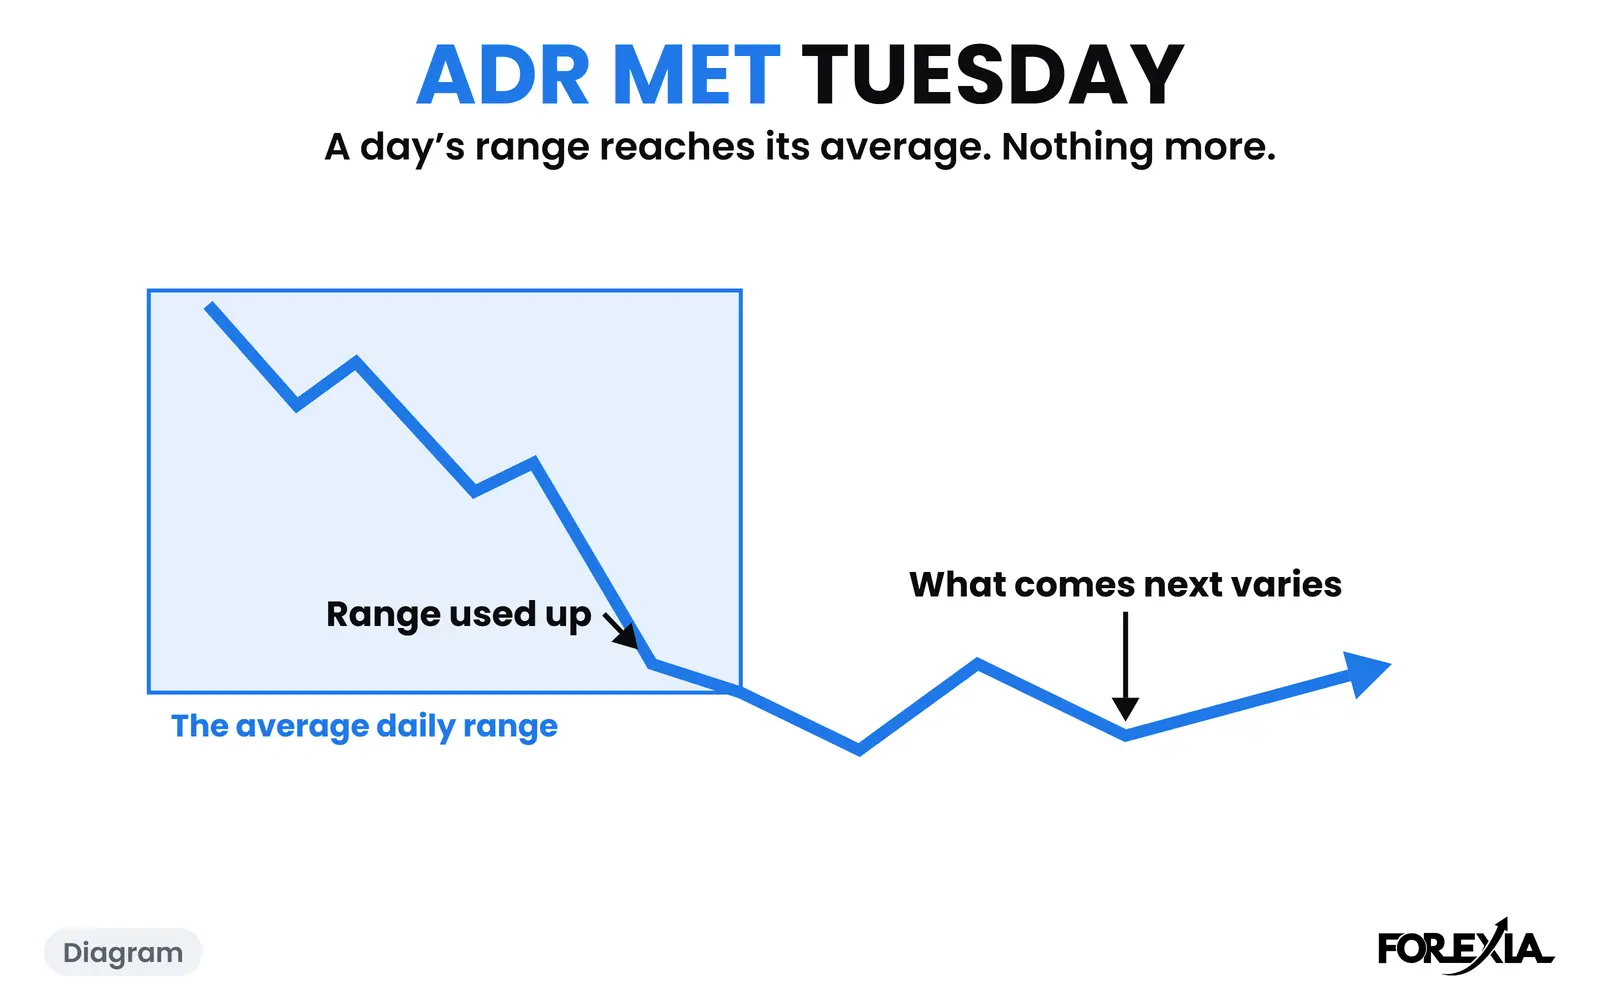
What it means when the average daily range is spent by Tuesday, how often it happens (28% of Tuesdays), and why it is one reading and not a signal.
6 min read
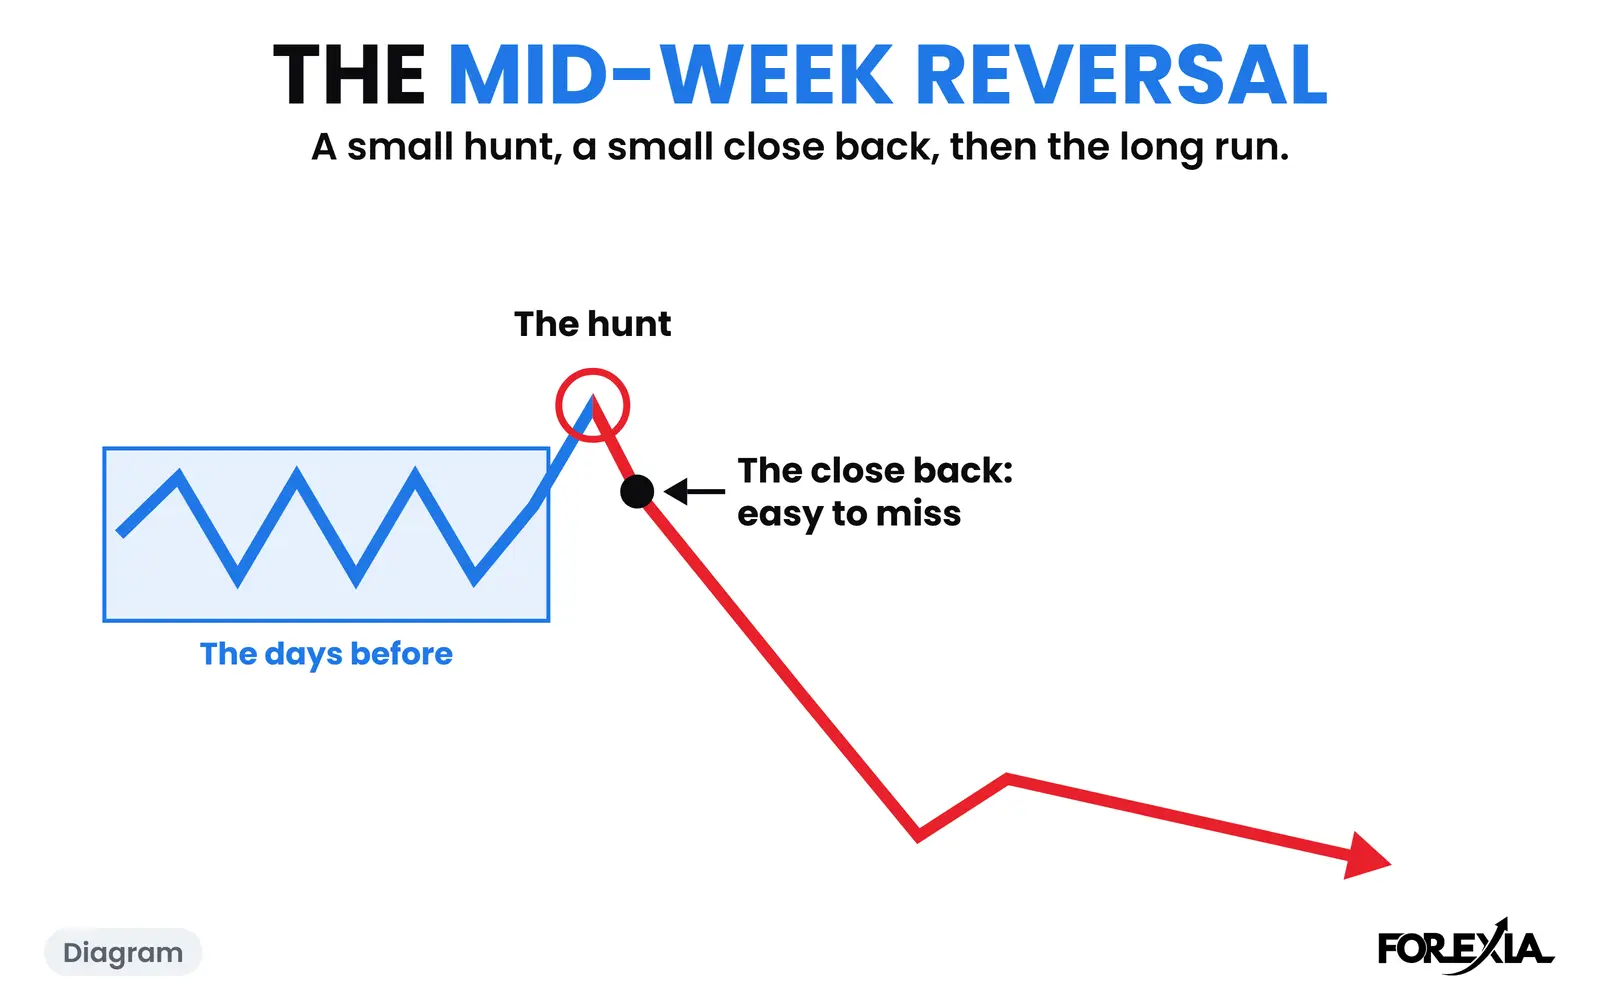
How to spot a mid-week reversal on the hourly chart: the hunt, the close back, then the run, read on a real USD/JPY week that fell 510 pips. Not a signal.
6 min read
How to review a forex trading week on Friday: read the new COT report, run four checks and file the week as textbook or partial. Scored on a real week.
7 min read
How to read the forex week as three parts in one order: induction trend, midweek trap, reversal. A real AUD/USD week, and a USD/CAD week that never turned.
6 min read
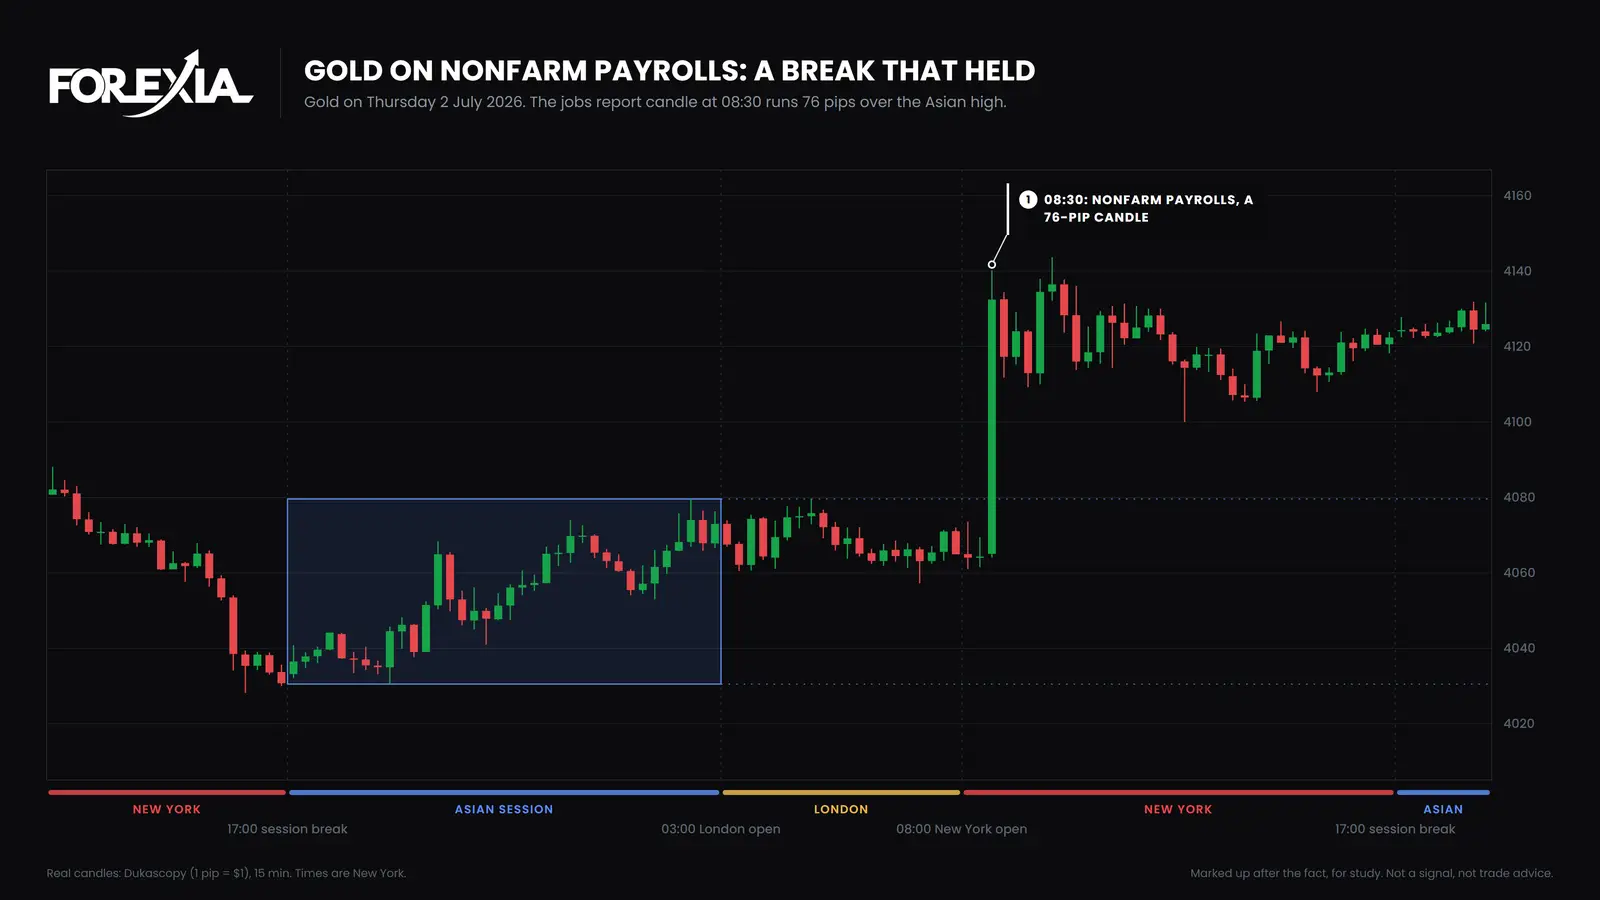
How NFP moves gold, on five real jobs reports from May to September 2026: the release candle, the Asian range, and how much of the move held by 17:00.
7 min read
How many confirmations for a forex trade setup? We scored 332 marked days out of eight. A higher score did not sort Textbook from Partial. See why.
6 min read
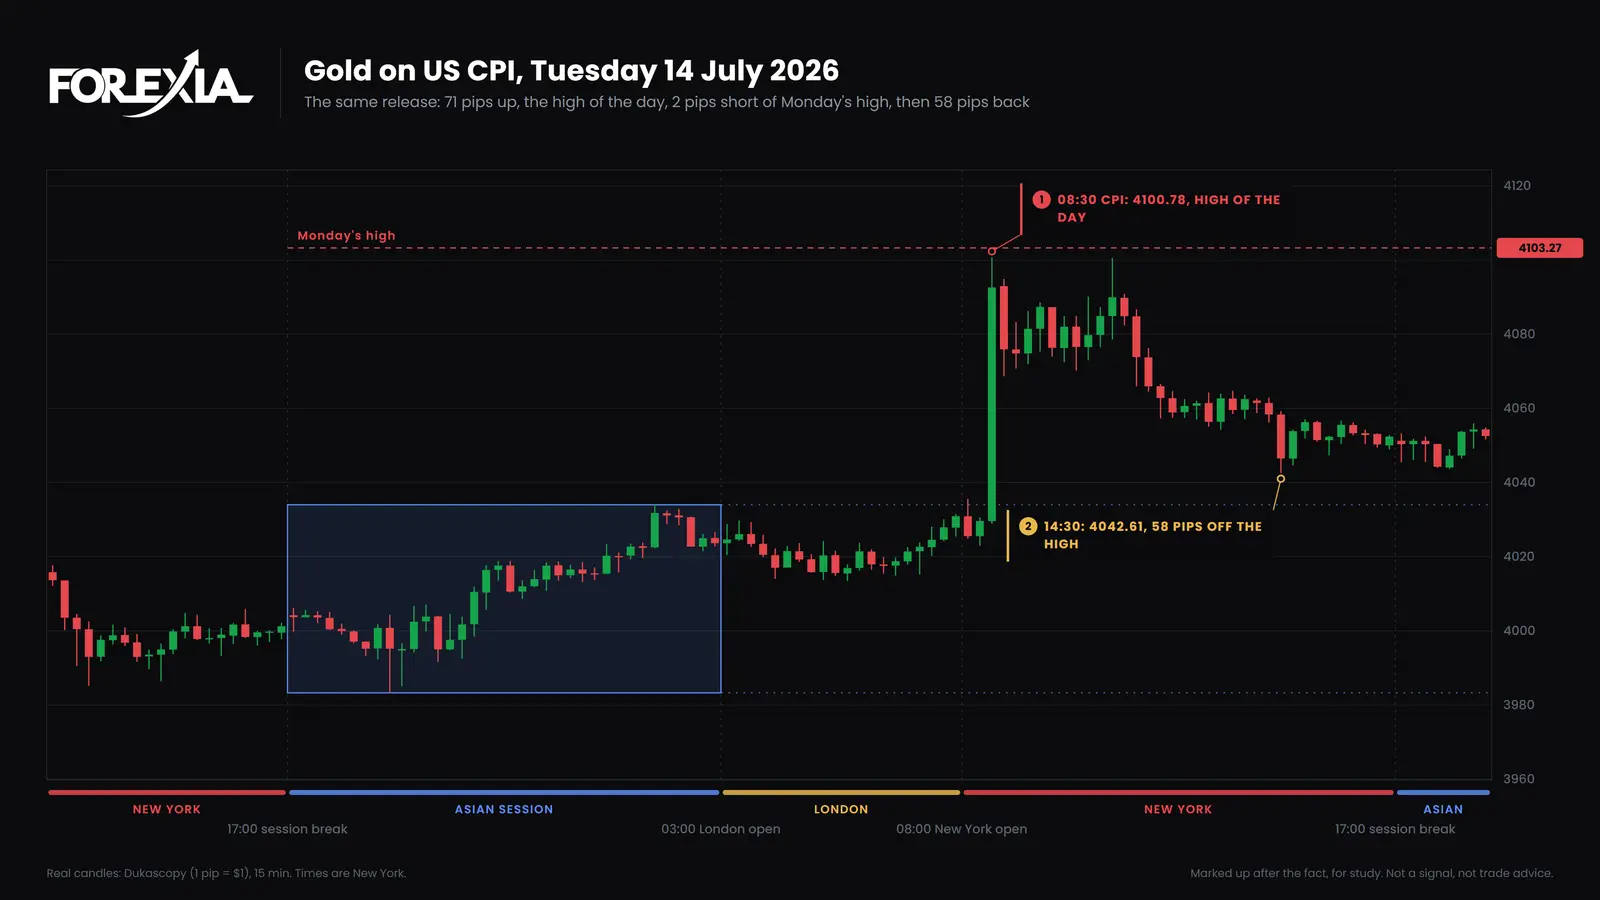
How CPI moves gold, on seven real US inflation releases from April to October 2026: the 08:30 candle, its wicks, and where gold stood at 17:00 New York.
7 min read
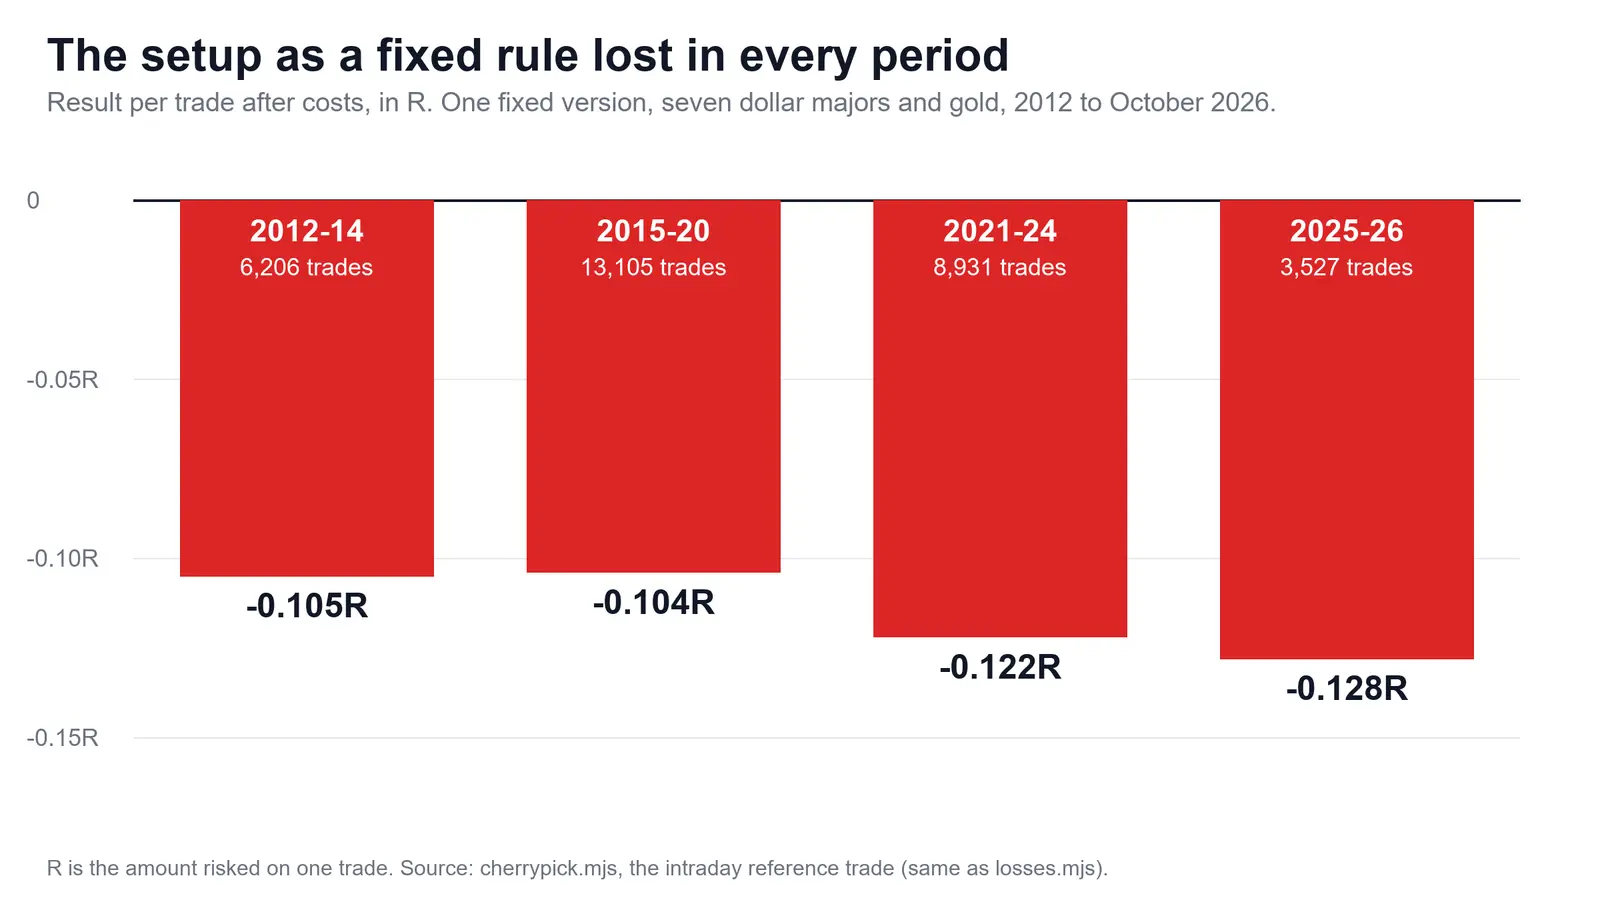
Why forex strategies fail backtests: in our own tests the patterns were there before costs and gone after them. Spread, slippage and financing, in figures.
7 min read
Good vs weak trading setup on three real USD/CAD days: 8 of 8 confirmations ran 51 pips, 7 of 8 ran 31, and 1 of 8 ran 62. What a score does not tell you.
6 min read
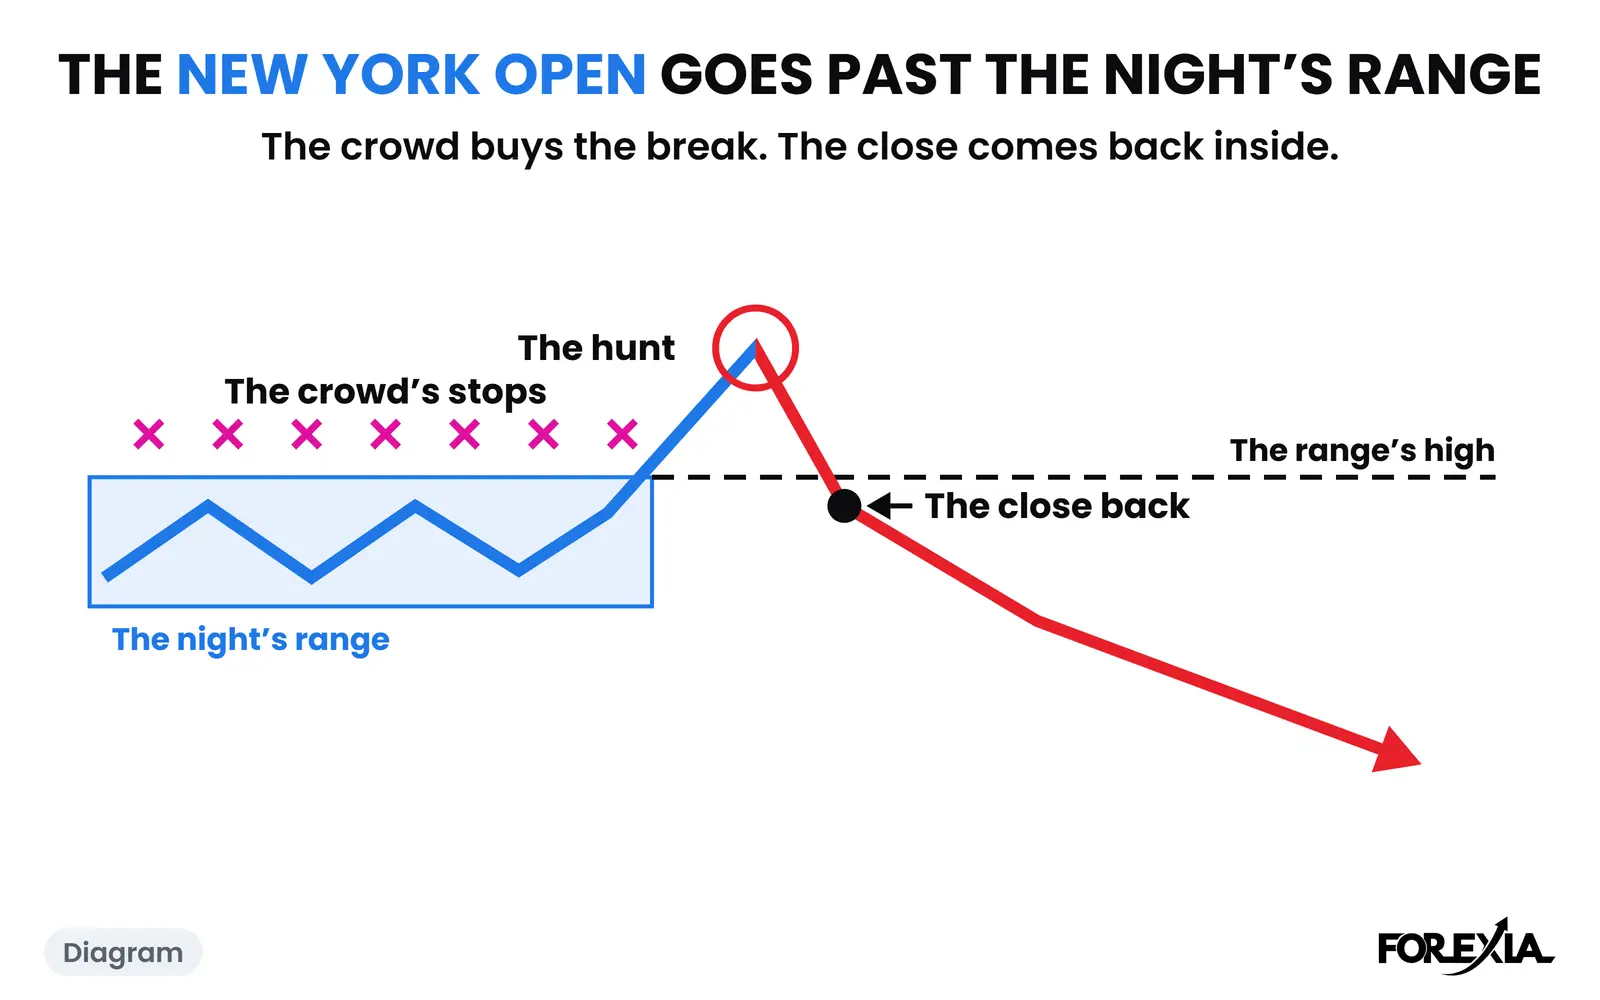
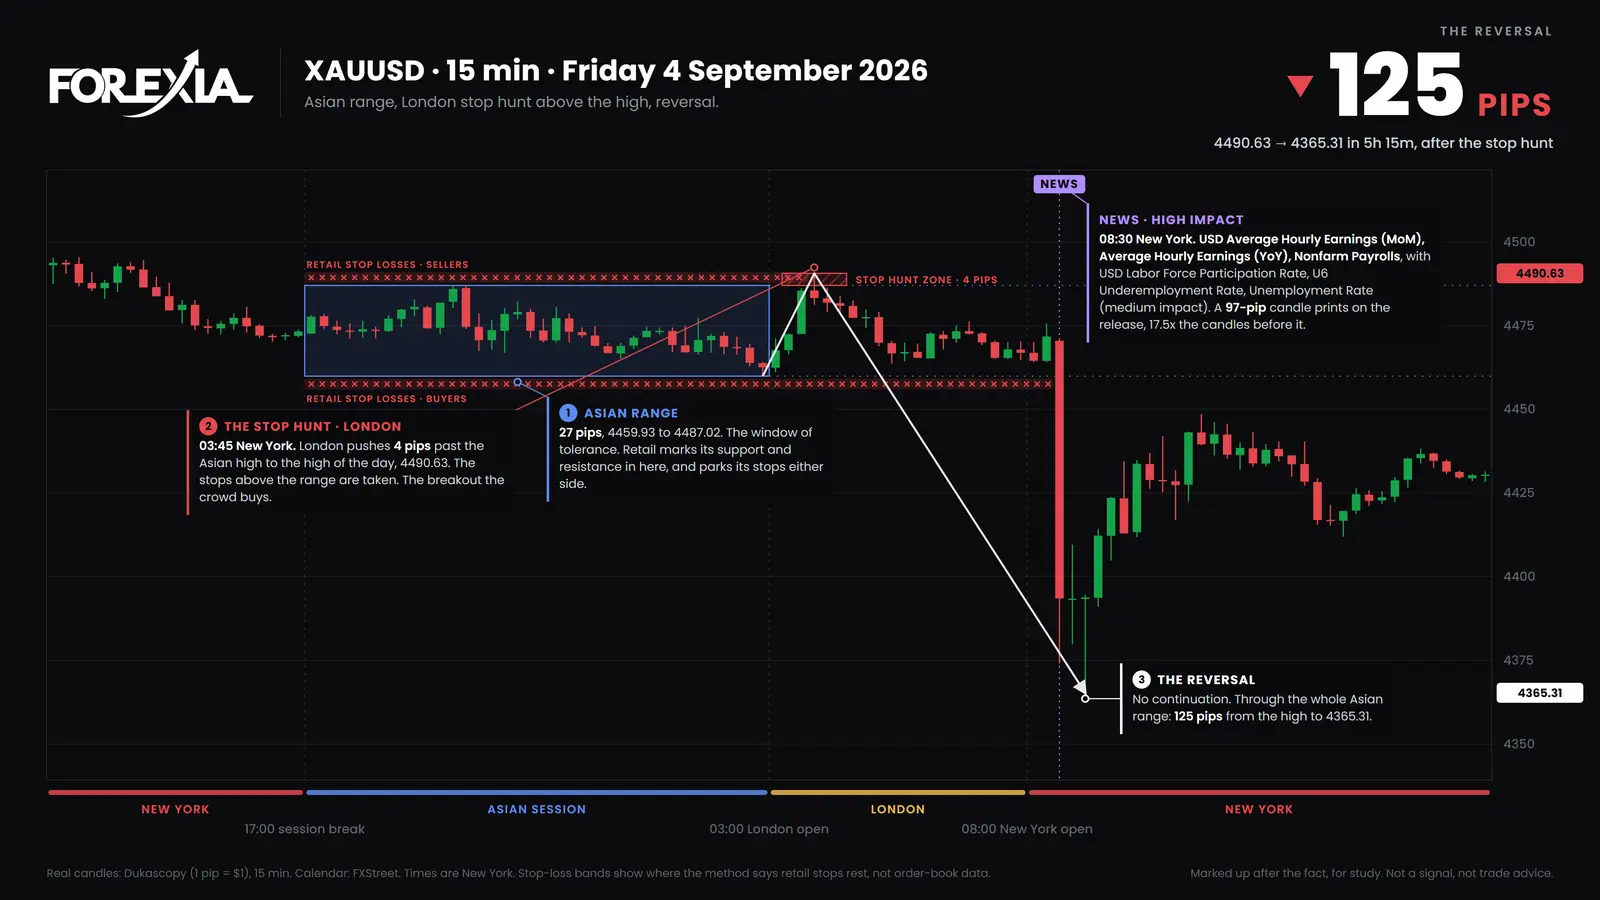
Gold stop hunt at the New York open: seven marked-up XAUUSD days with the Asian range, the hunt time, the close back and how far gold went, in full.
8 min read
A gold pip calculator, opened on XAUUSD: a pip is $1, so $100 on a 100-ounce lot. Two real gold moves worked in dollars, and what the sum leaves out.
7 min read
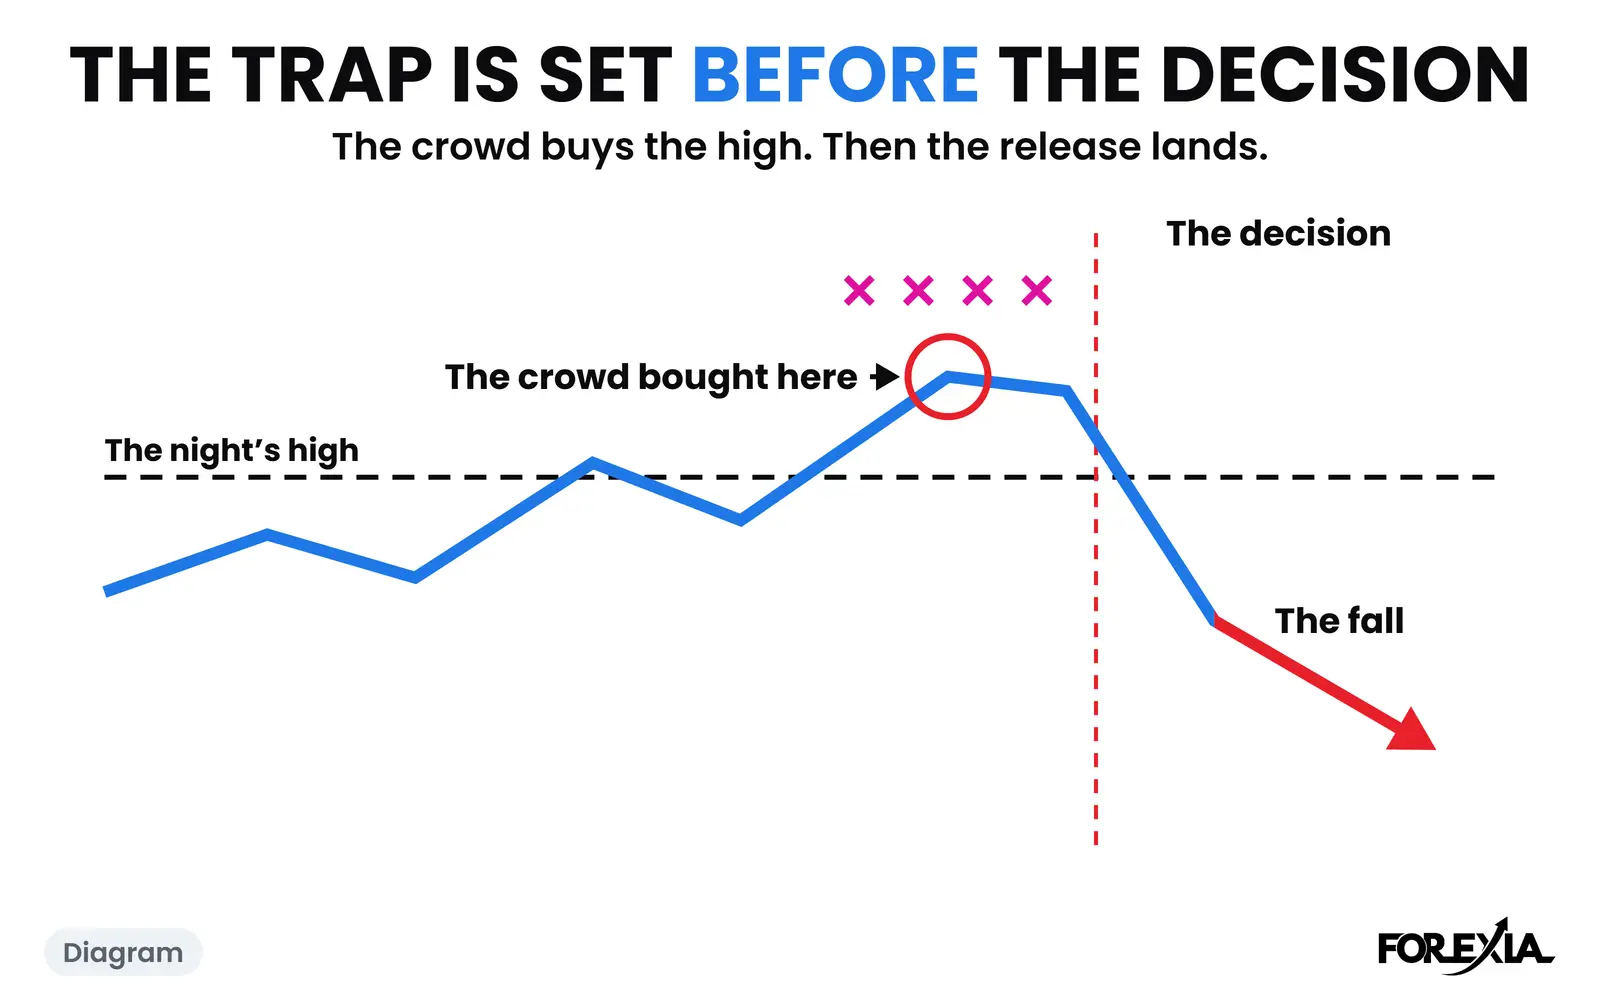
How to trade gold on FOMC day, read on a real marked-up XAUUSD chart: the 14:00 decision, who was trapped, and three more Fed days set beside it.
7 min read
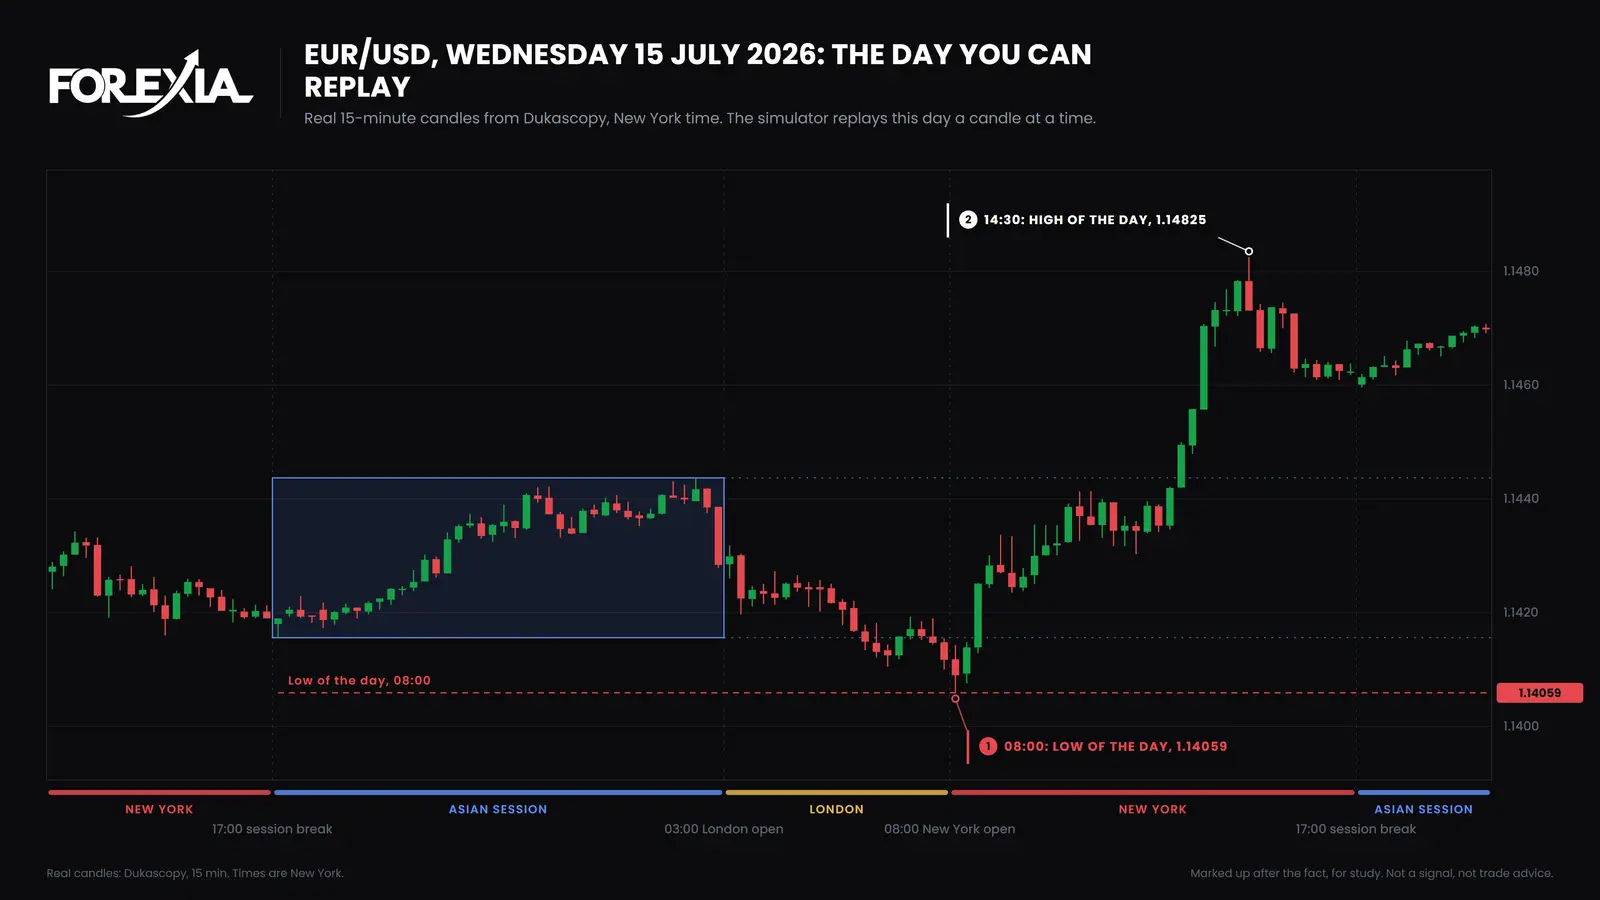
A forex trade simulator on ten real past days: step through a day, set an entry, stop and target, and see the fill in R. No account; nothing saved.
6 min read
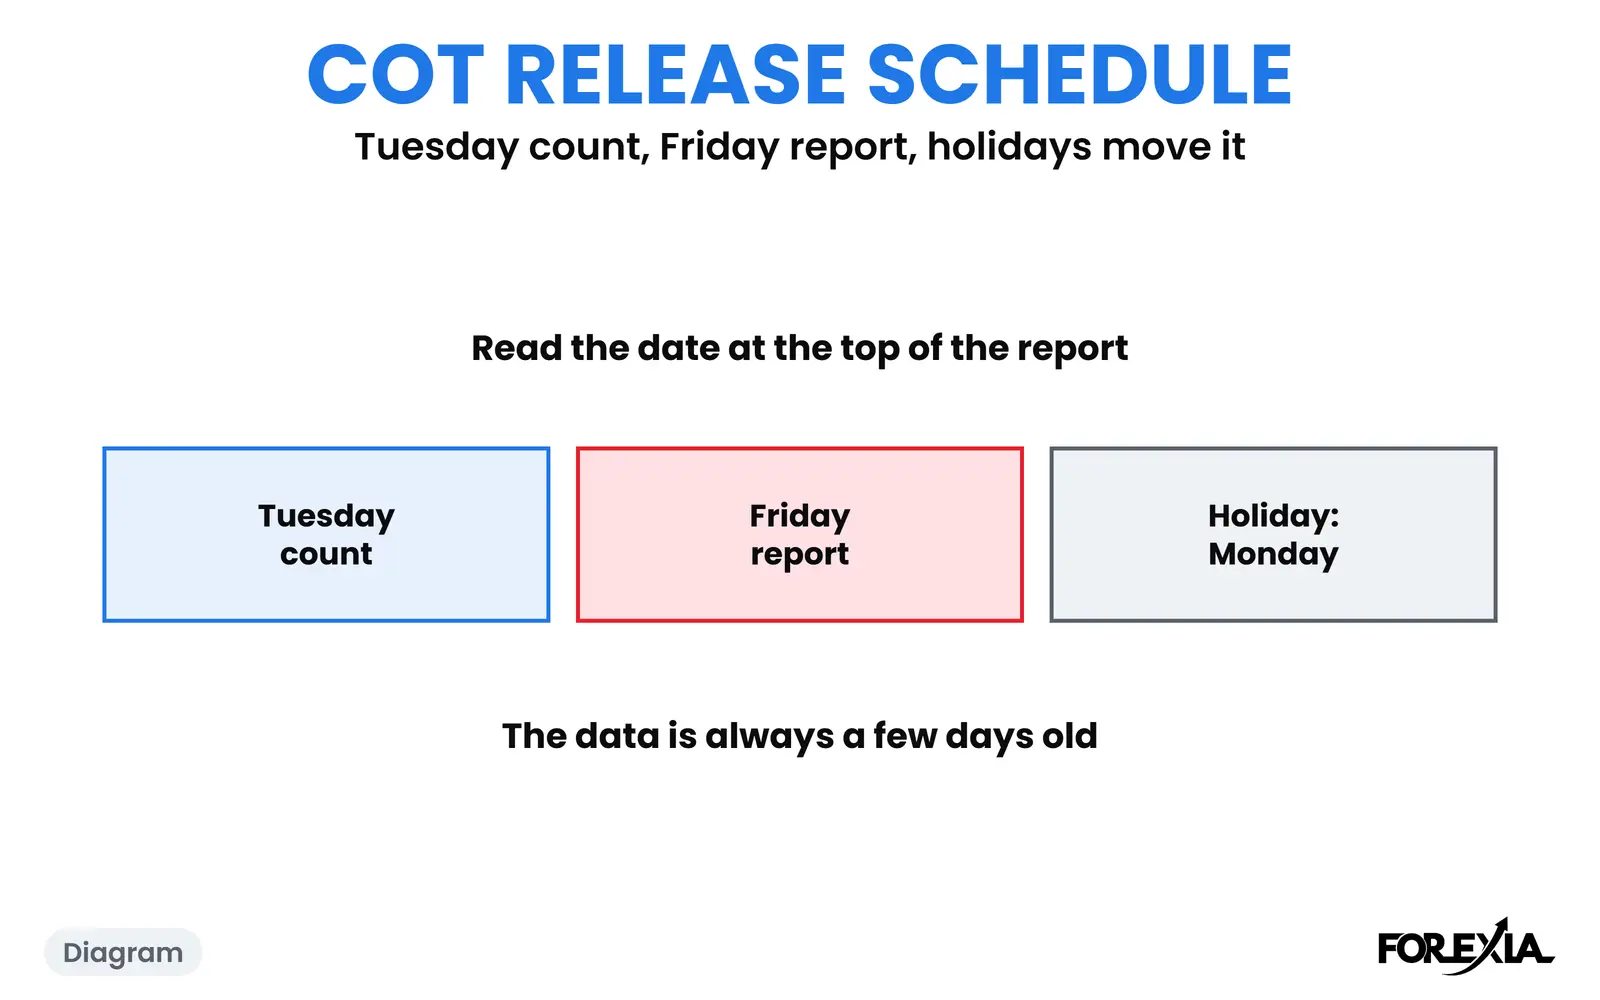
The COT report release date is Friday 15:30 New York, positions counted the Tuesday before. The CFTC's 2026 dates, six holiday Mondays and the next four.
8 min read
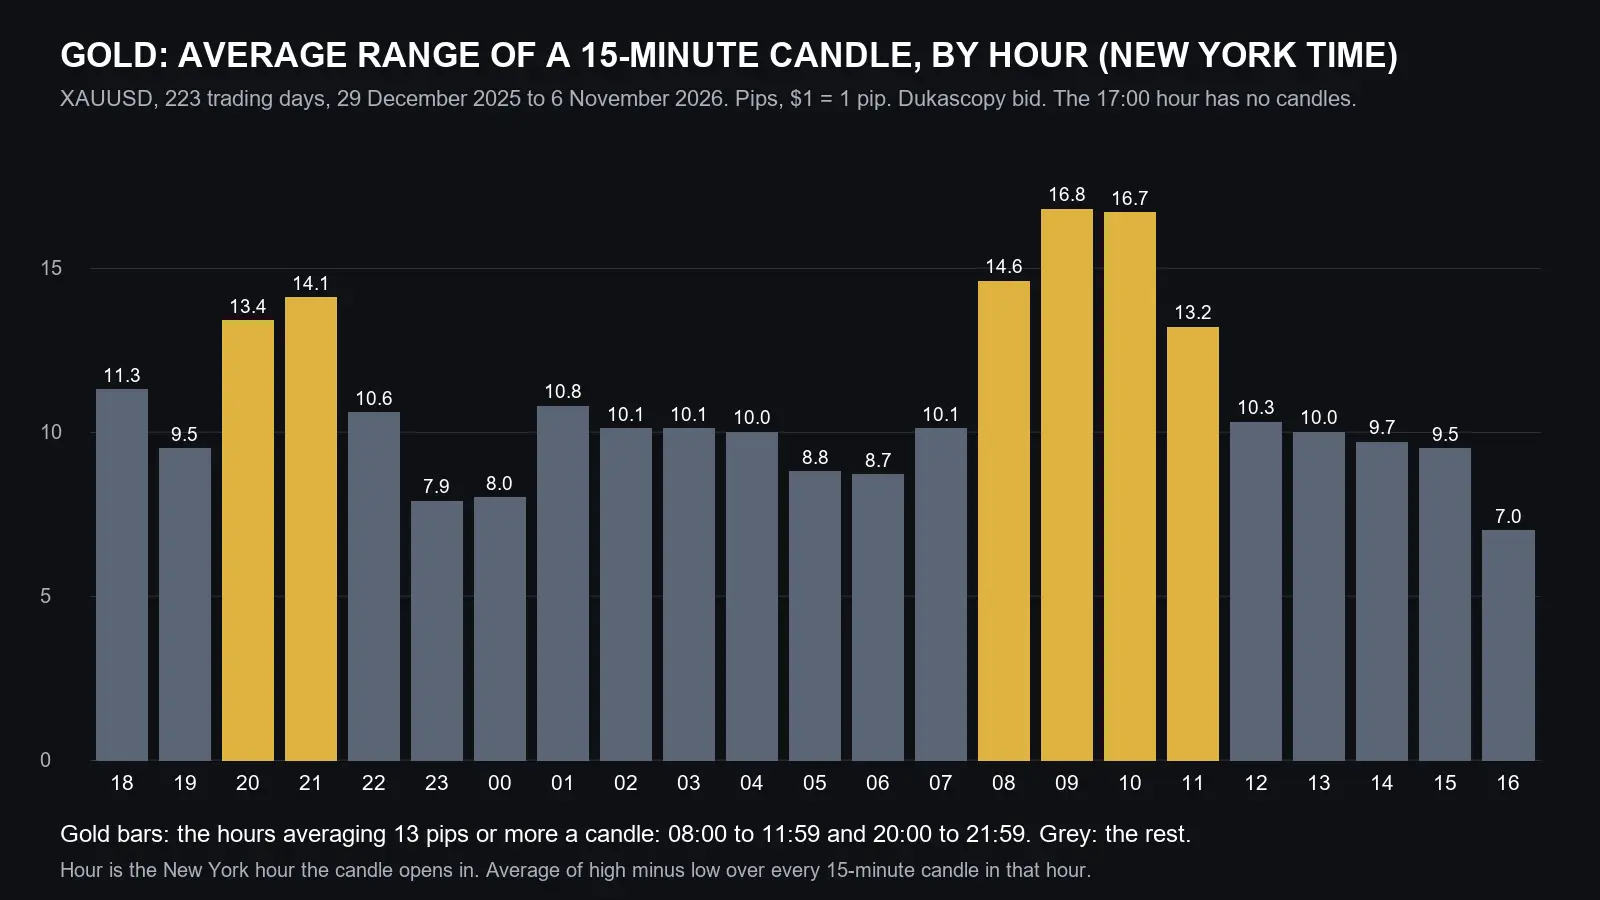
XAUUSD trading hours: gold trades from Sunday evening to Friday afternoon New York time. 223 real days show which hours and sessions it moves most.
6 min read
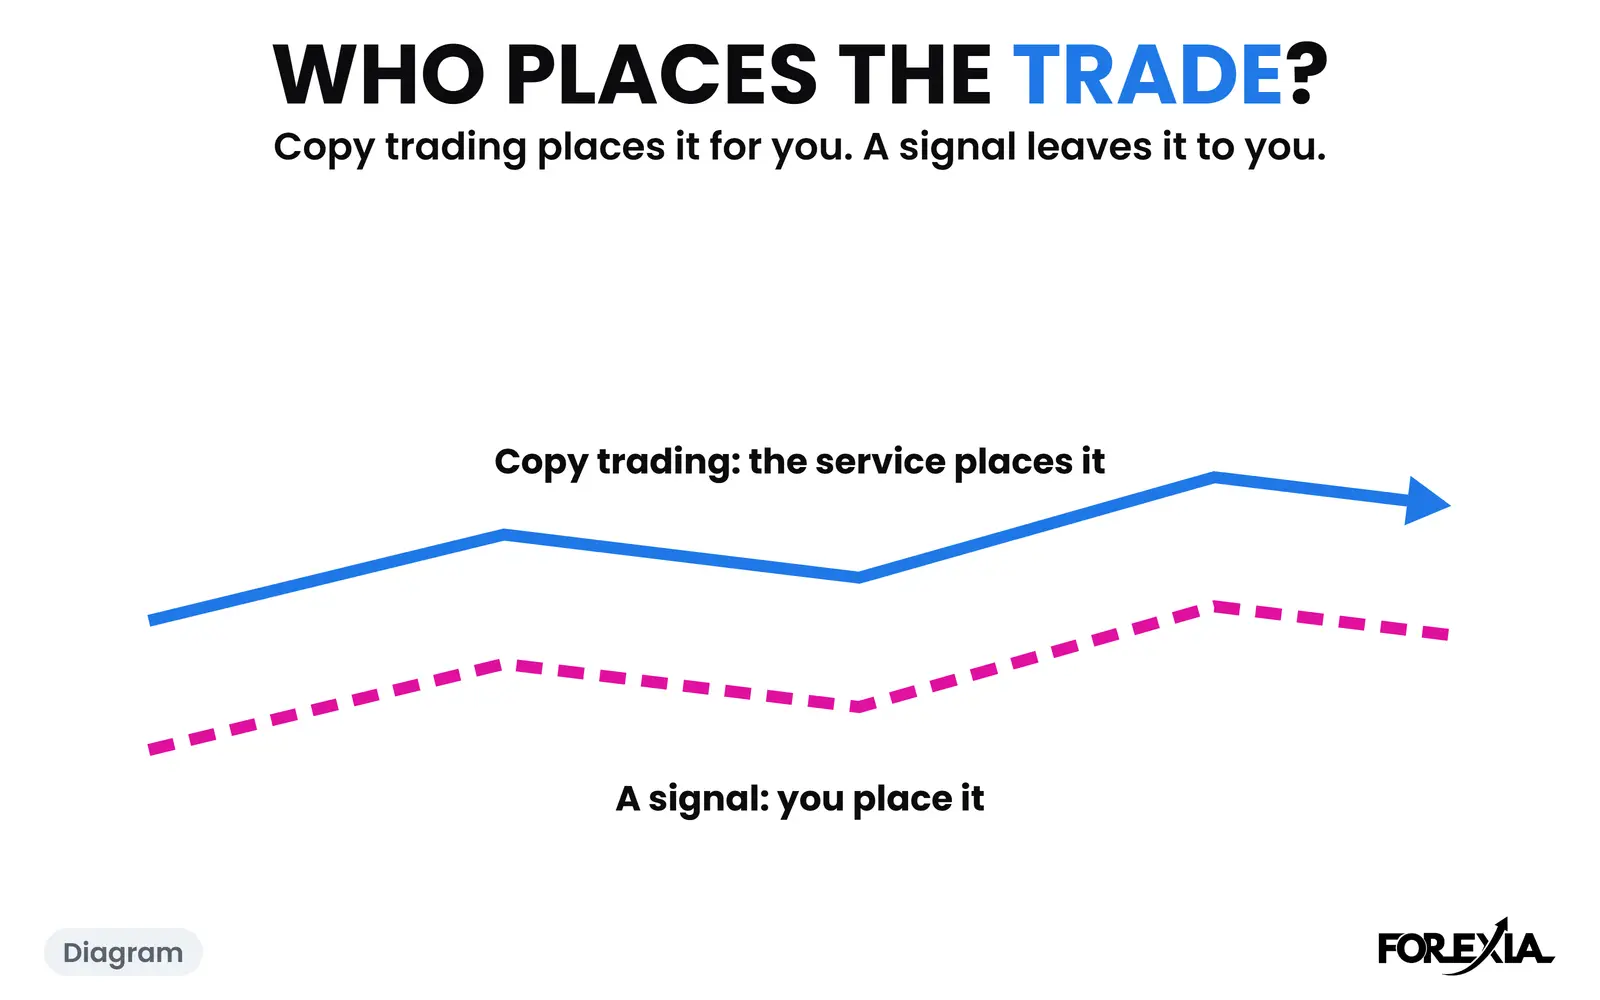
Copy trading places the trades in your account; a forex signal leaves them to you. What each gives you and costs you, on one real dated EUR/USD signal.
8 min read
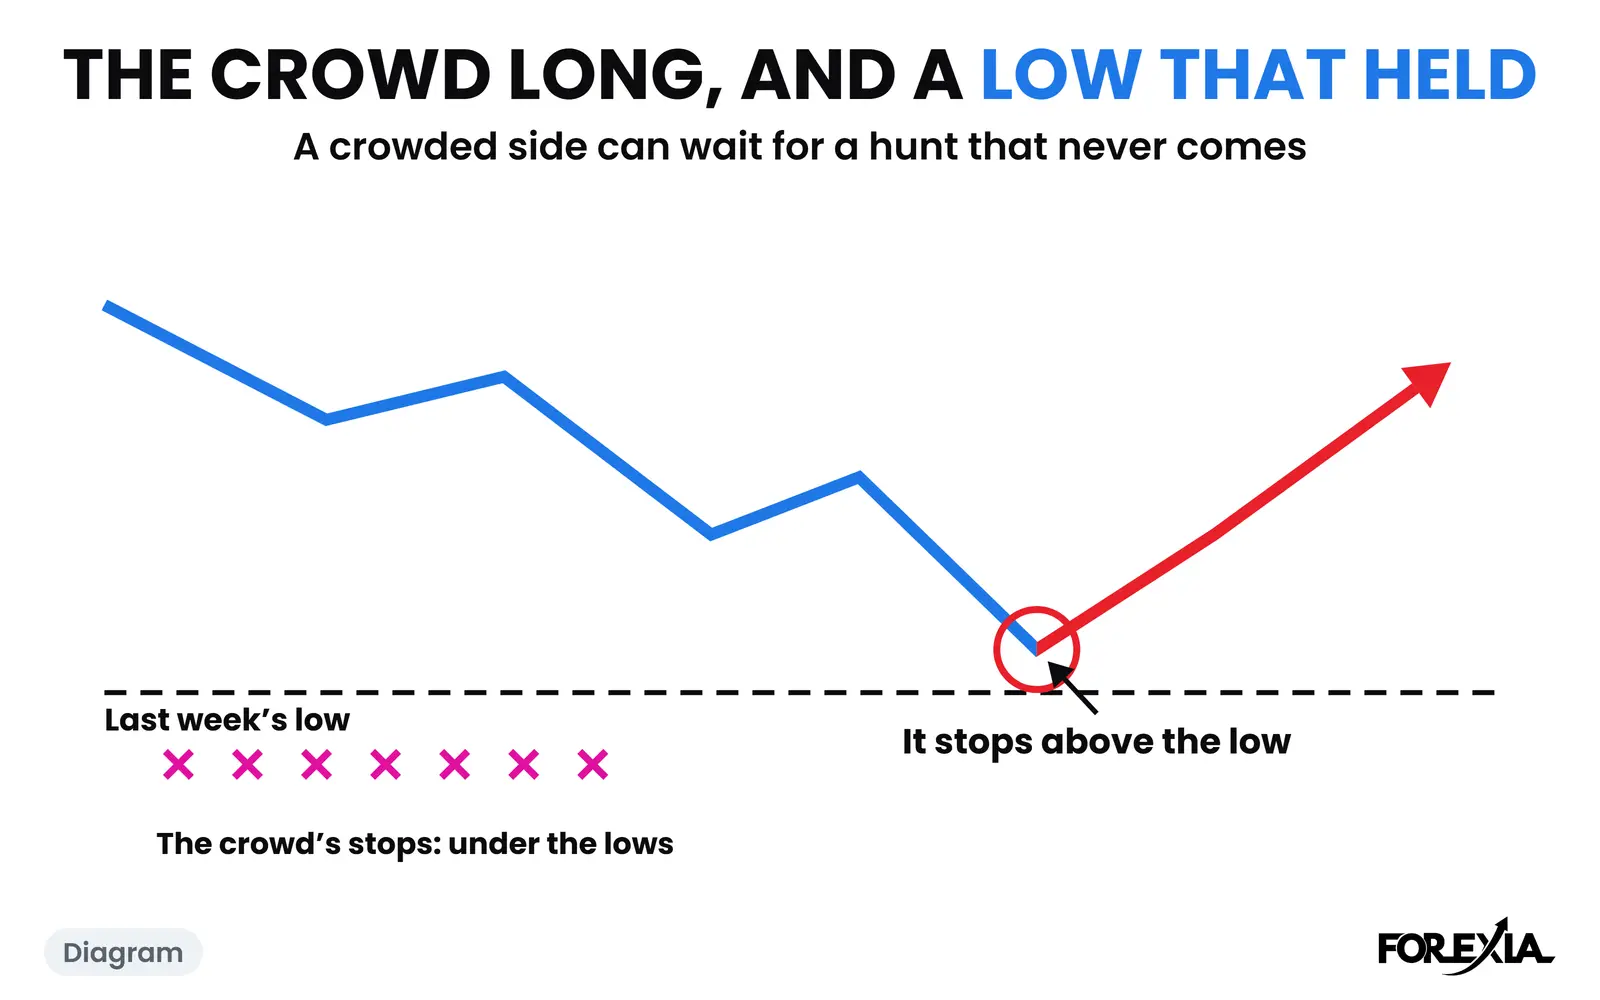
The COT report CAD counted 18 August 2026: Canadian dollar futures turned round to USD/CAD, the crowd at index 83, and the low that held for twelve days.
8 min read
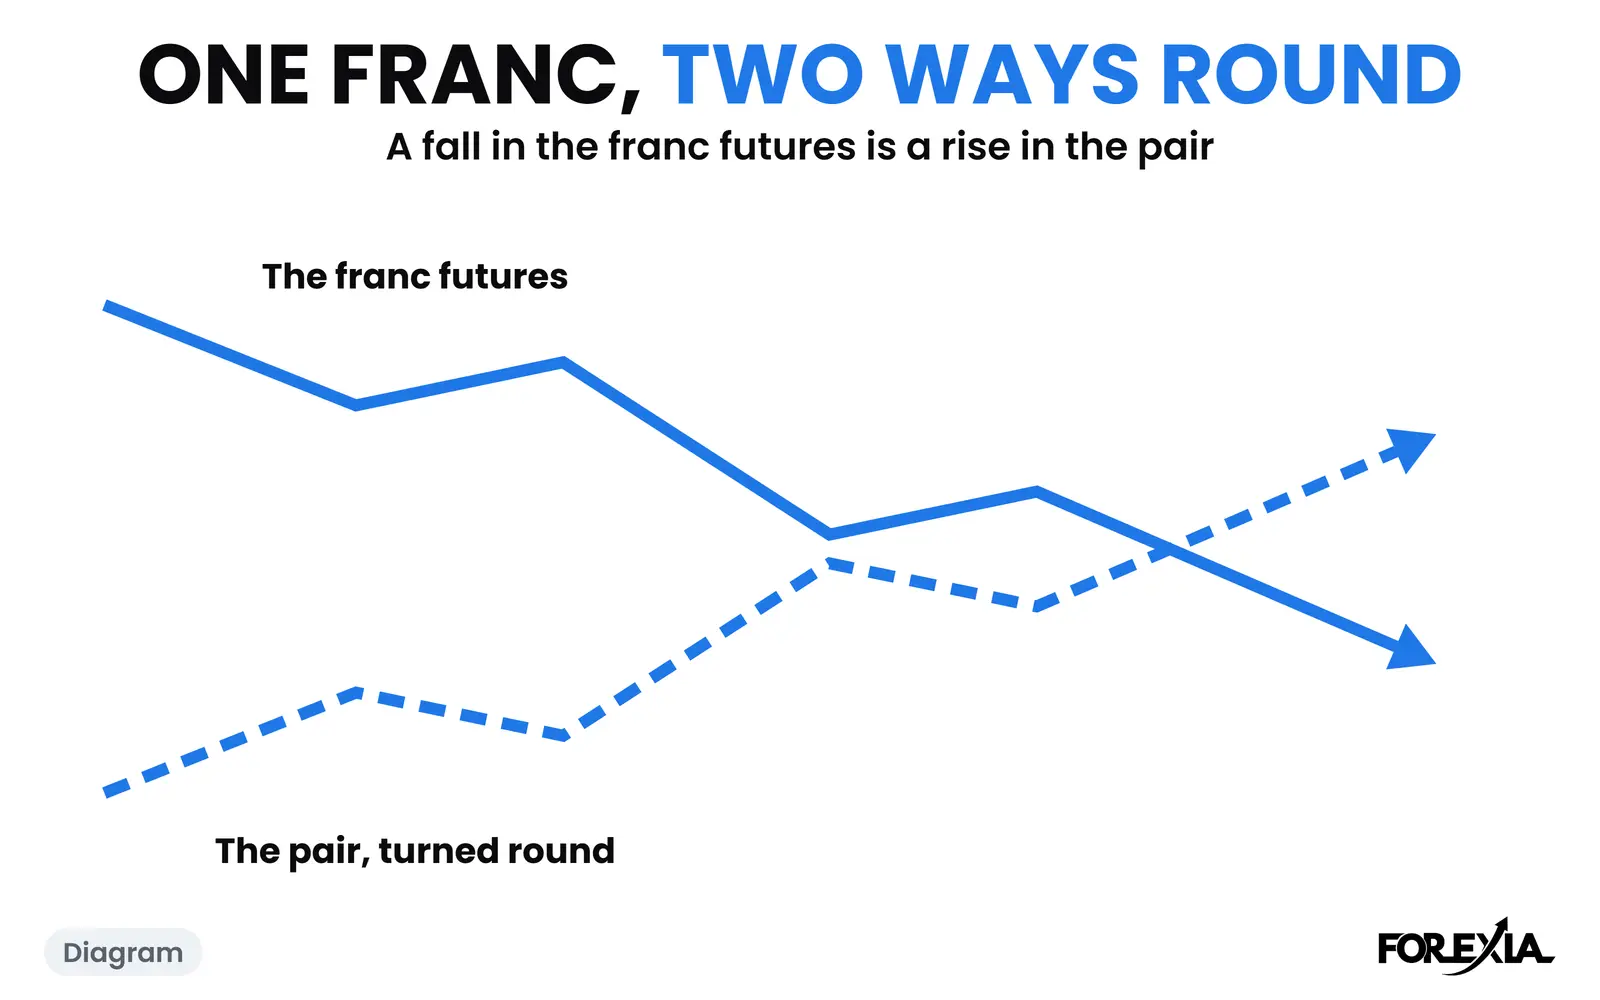
The COT report CHF counted 3 November 2026: Swiss franc futures turned round to USD/CHF, the crowd at index 12, who sat opposite, and what price did next.
8 min read
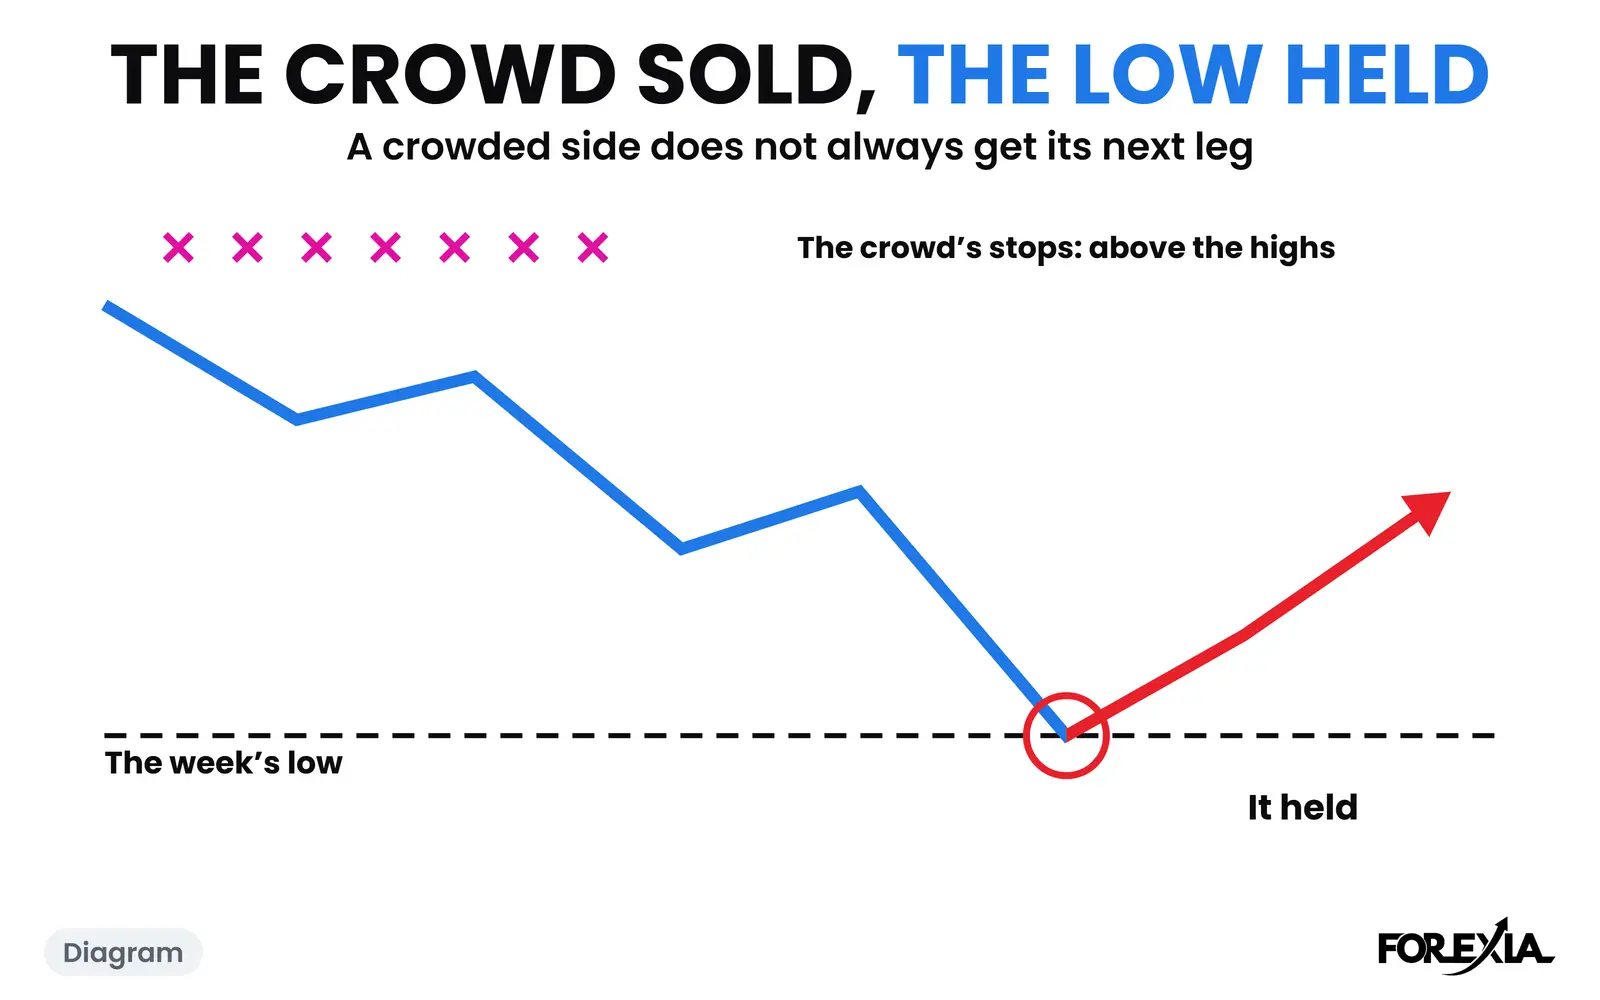
The COT report NZD counted 3 November 2026: the New Zealand dollar's crowd at index 13, who sat beside it, the low it kept, and what NZD/USD did next.
7 min read
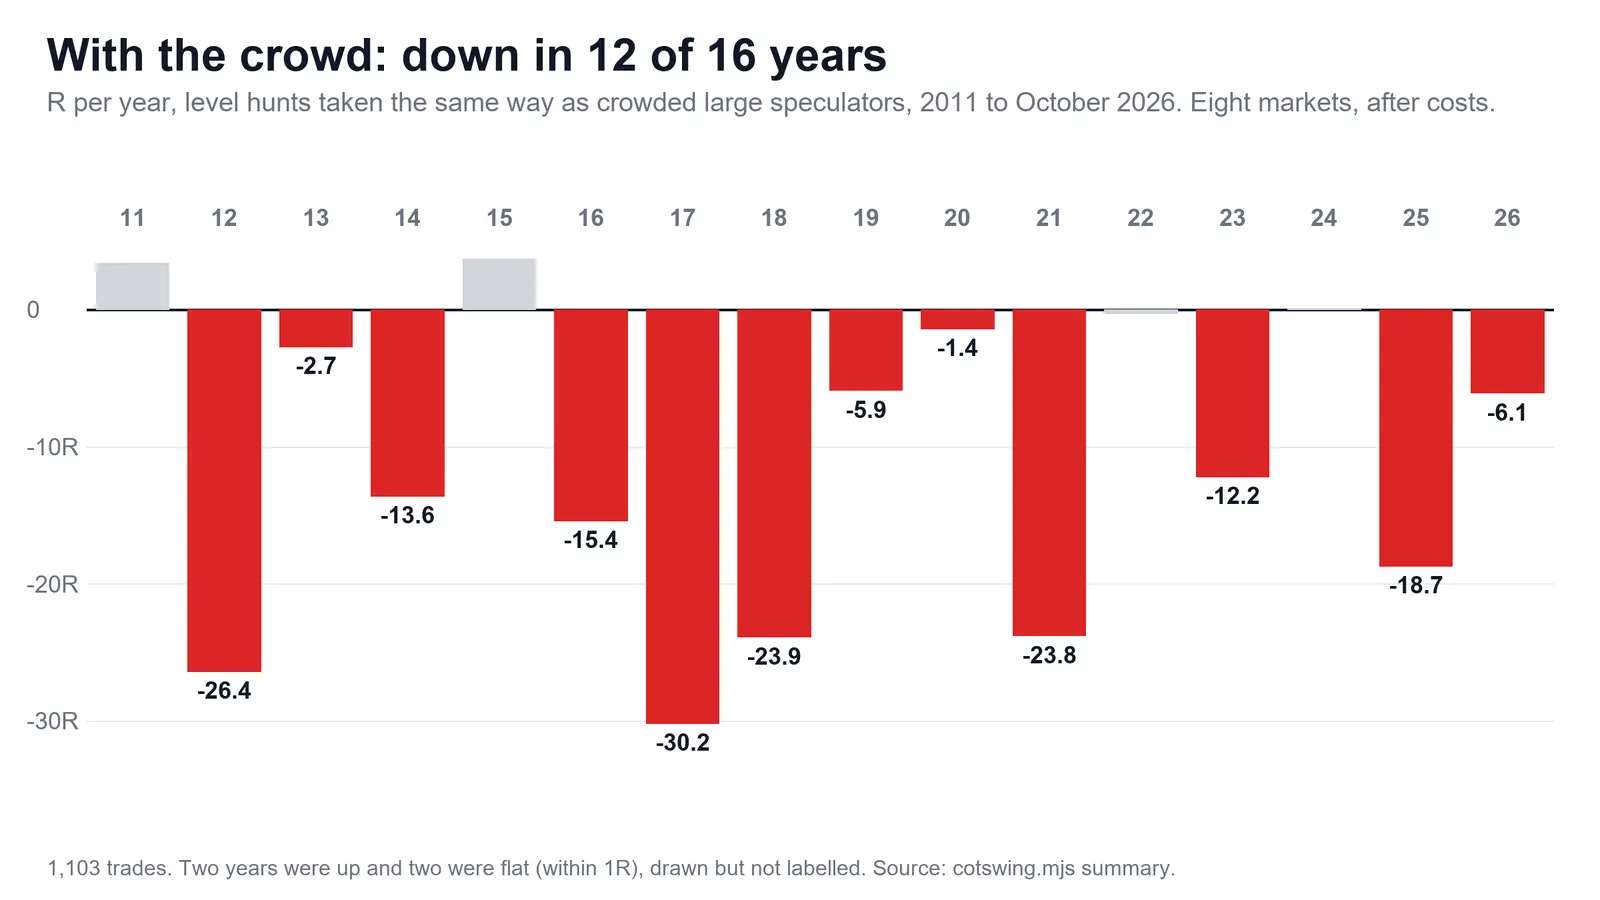
Does the COT report work for forex? On 16 years with costs, joining a crowded side lost, and the version that held best is not proven. Sample and limits.
8 min read
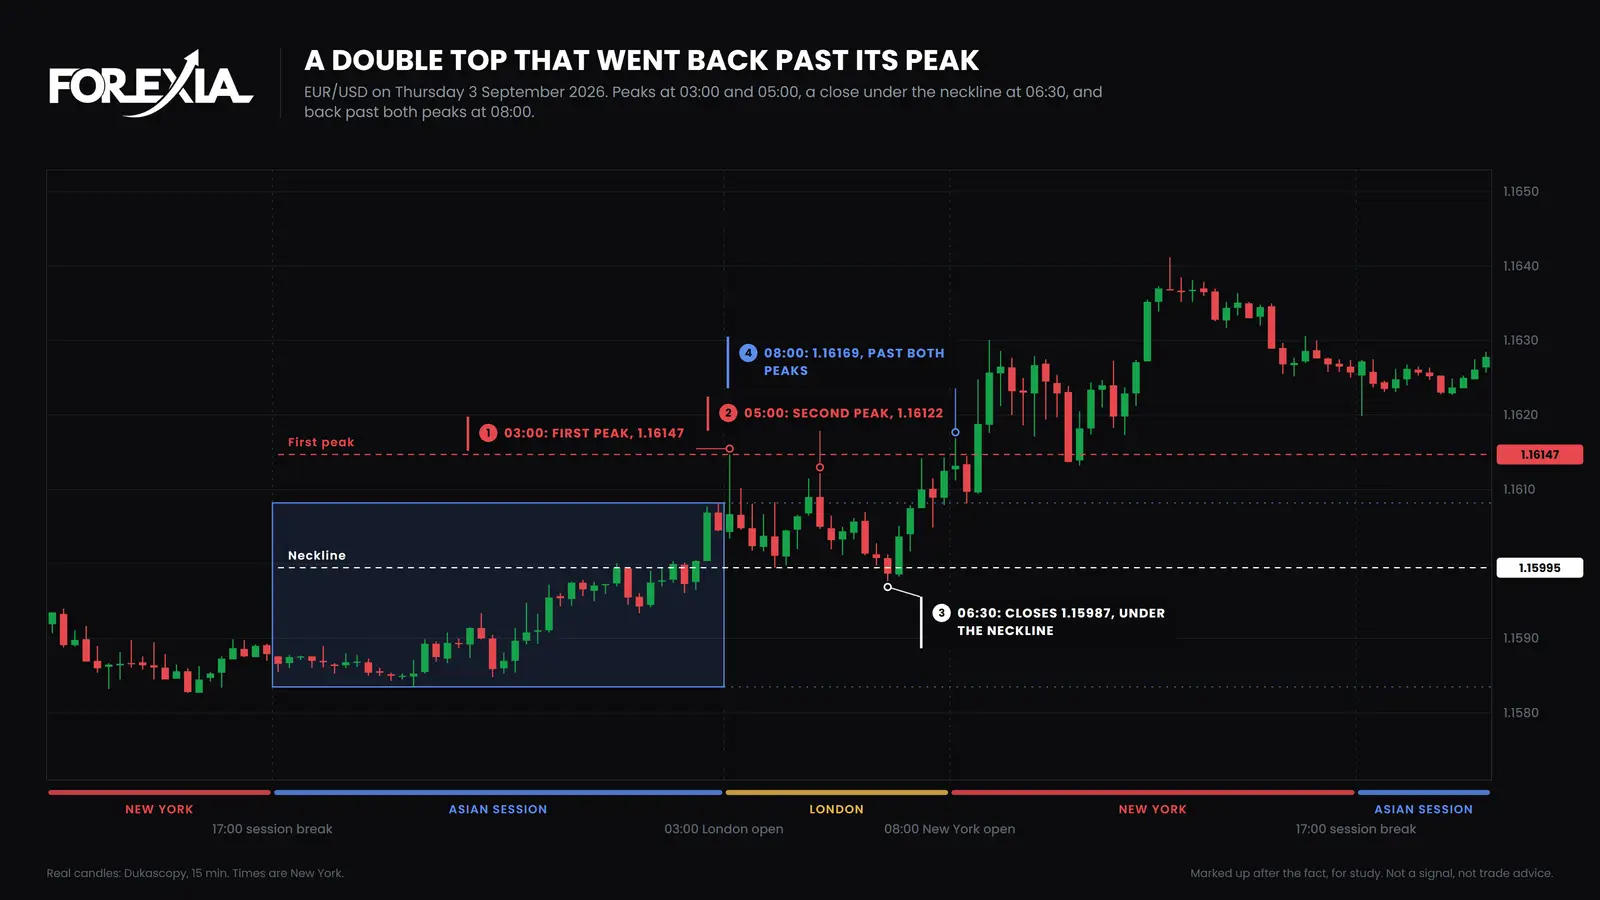
The double top failure rate, counted: 983 tops and bottoms on 15-minute forex and gold candles, what the neckline did, and two real days that failed.
7 min read
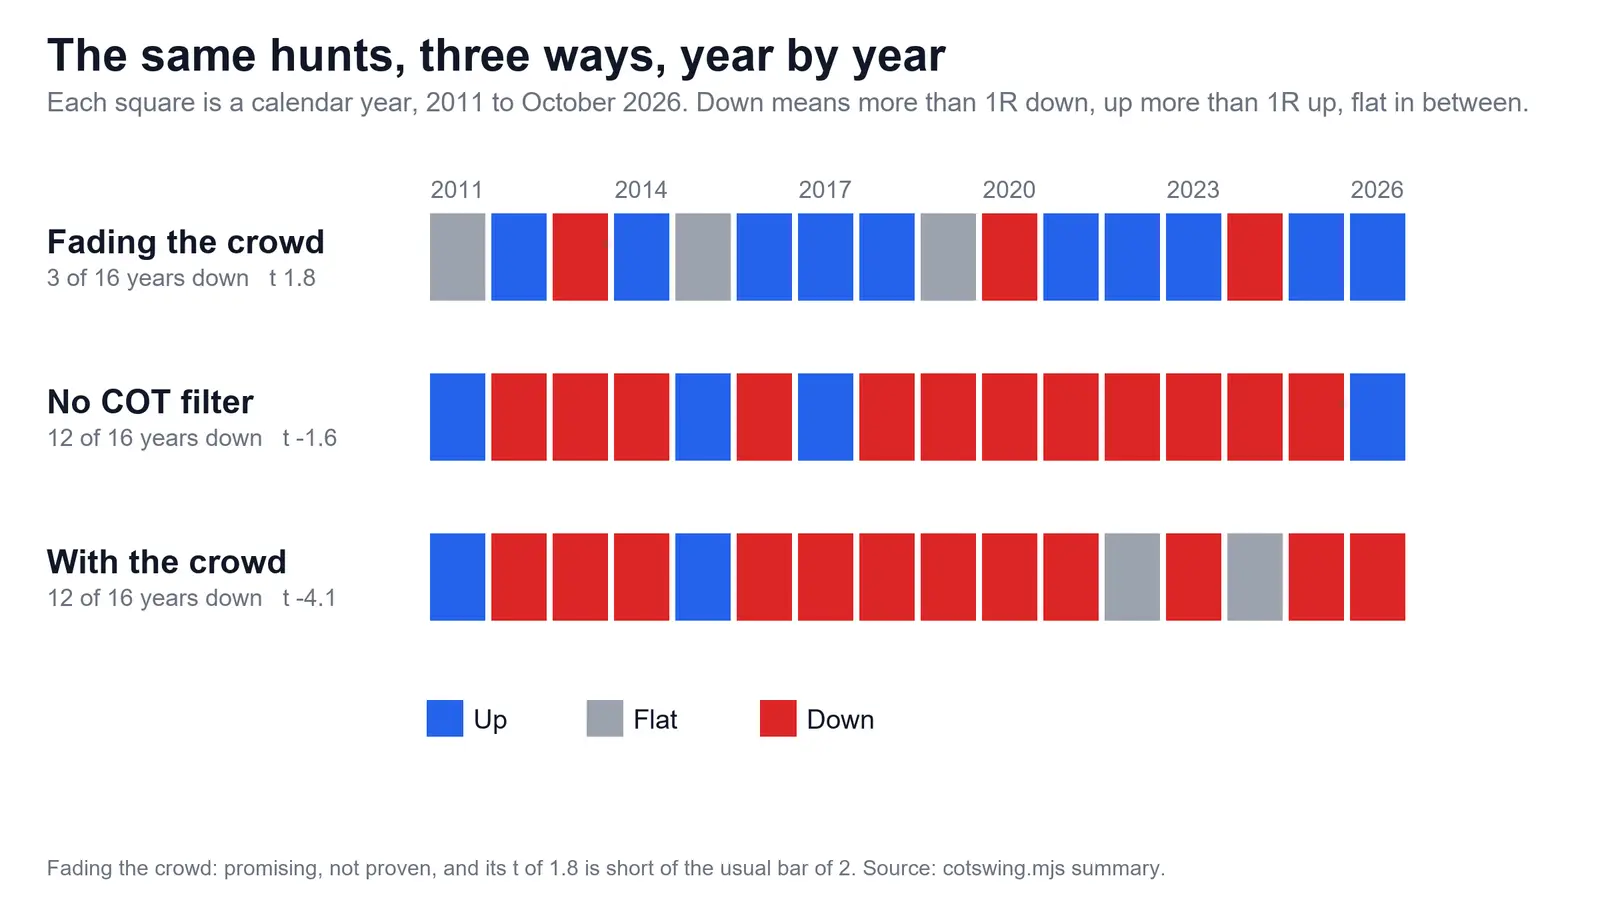
Fade the crowd with the COT report on a level hunt: how the rule was chosen, 16 years with costs, where it is thin, and why it is still not proven.
9 min read
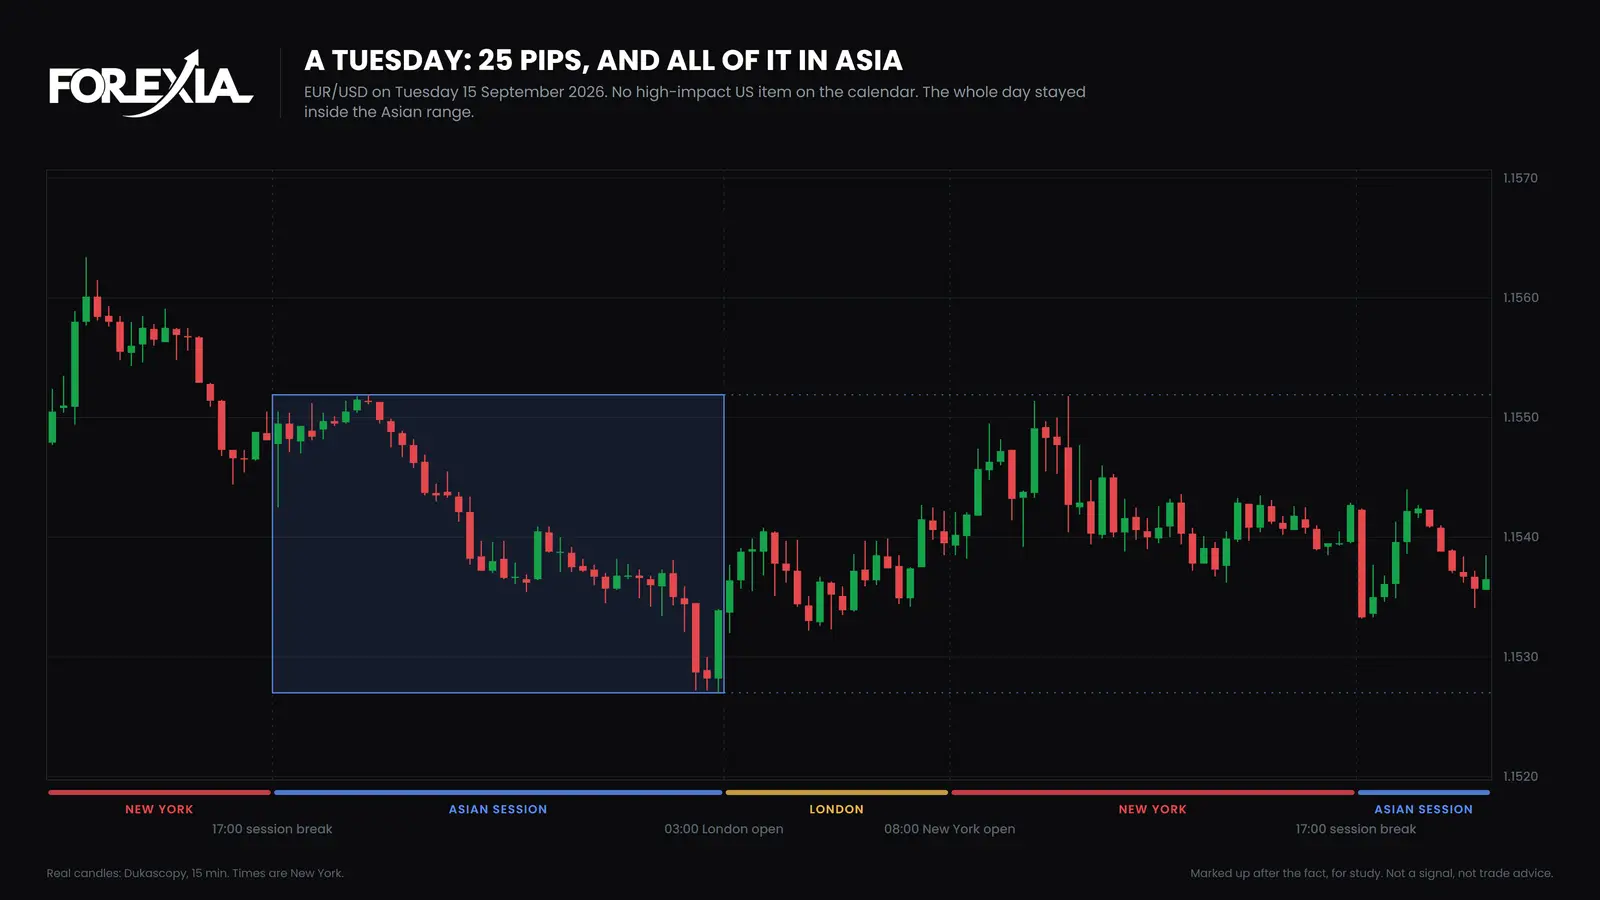
Forex average range by weekday on eight markets, 6 April to 1 October 2026: Wednesday and Thursday largest, Tuesday smallest, and how that follows news.
7 min read
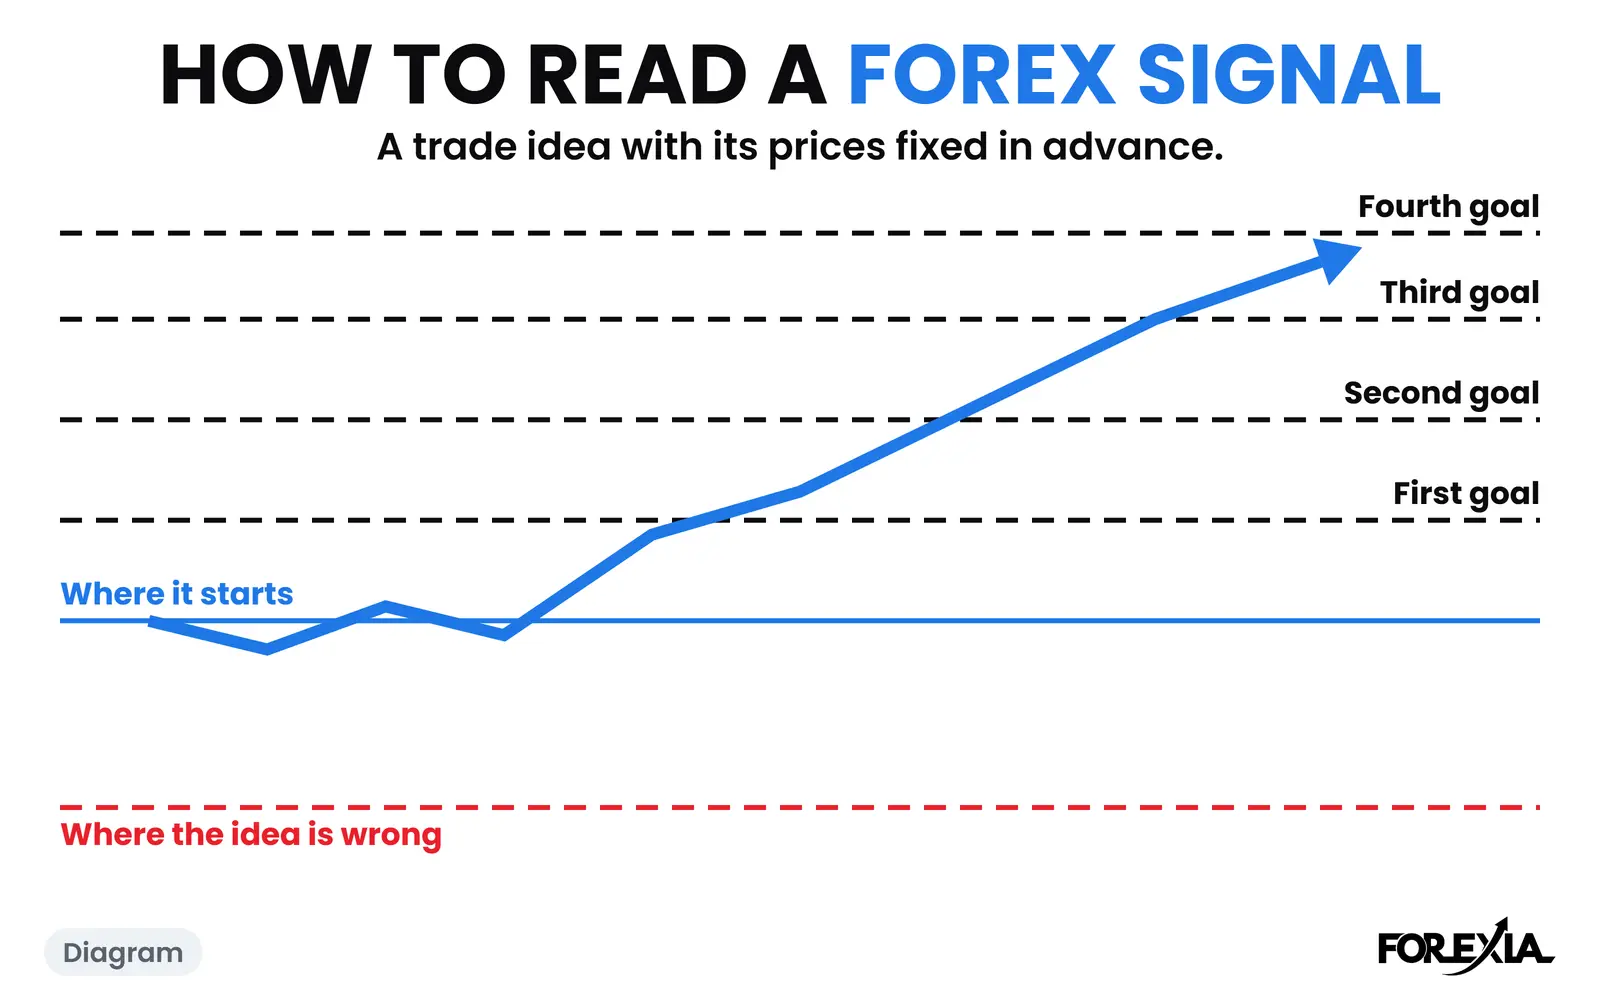
A forex signal service shown by its record: every closed signal of our public channel since 4 October 2026, stopped ones listed, and what ForexiaPRO adds.
7 min read
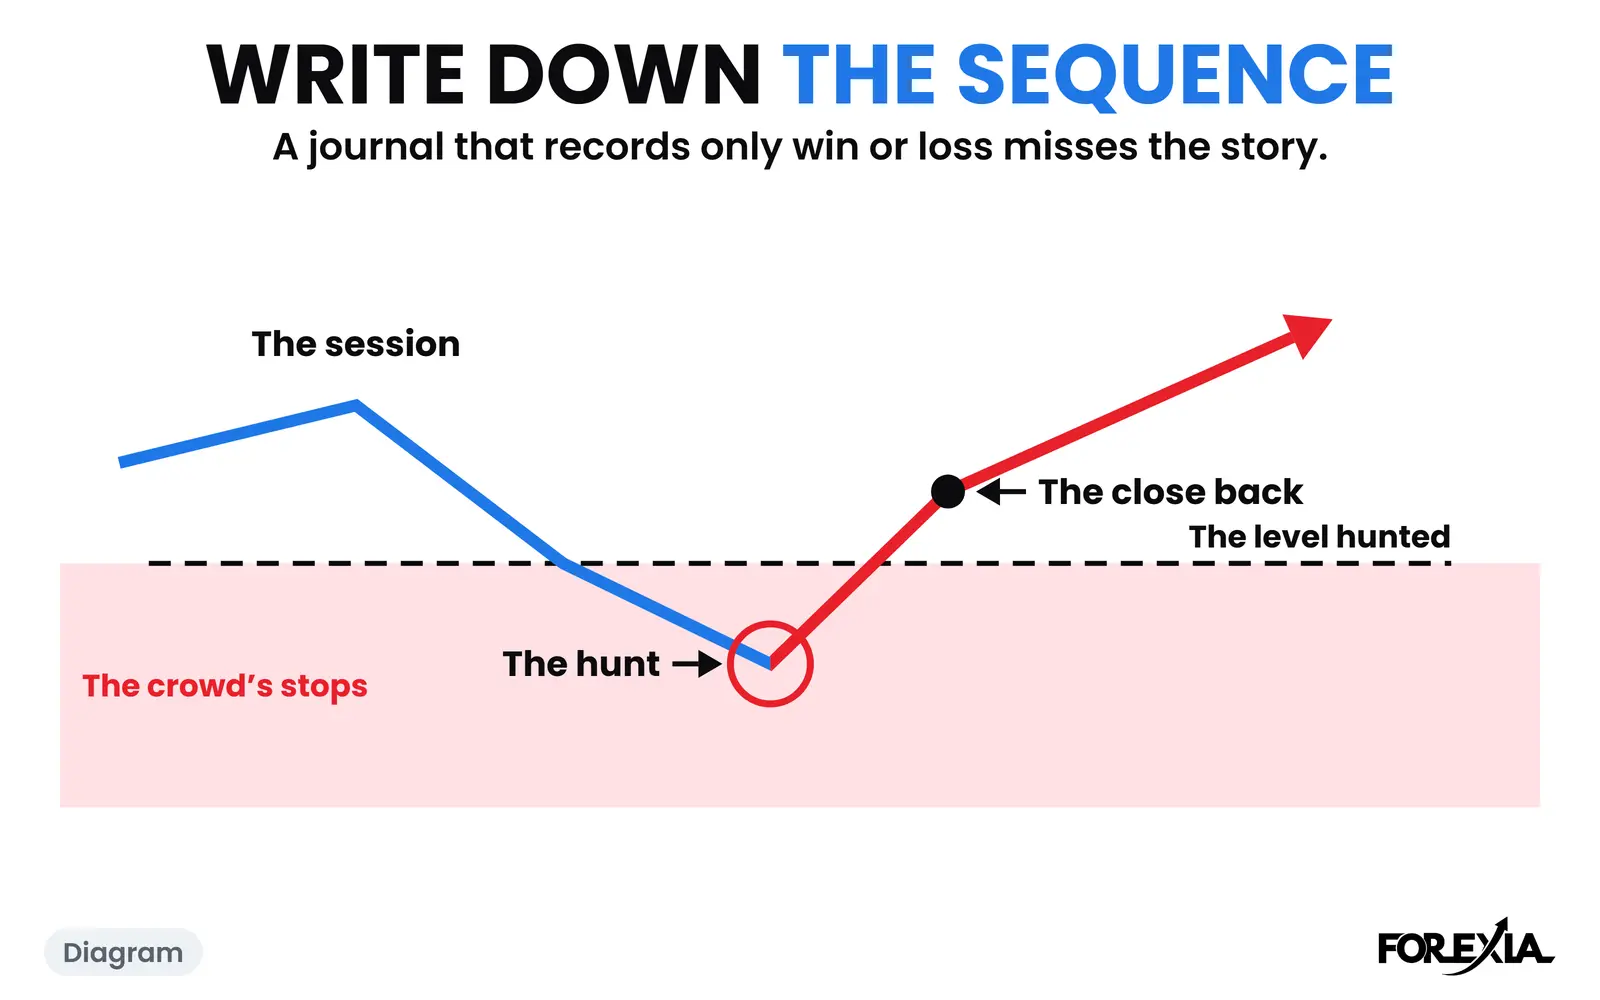
A free forex trading journal: a CSV template for Excel or Sheets, what each column records and why, and a clearly made-up example row. No results, no promises.
7 min read
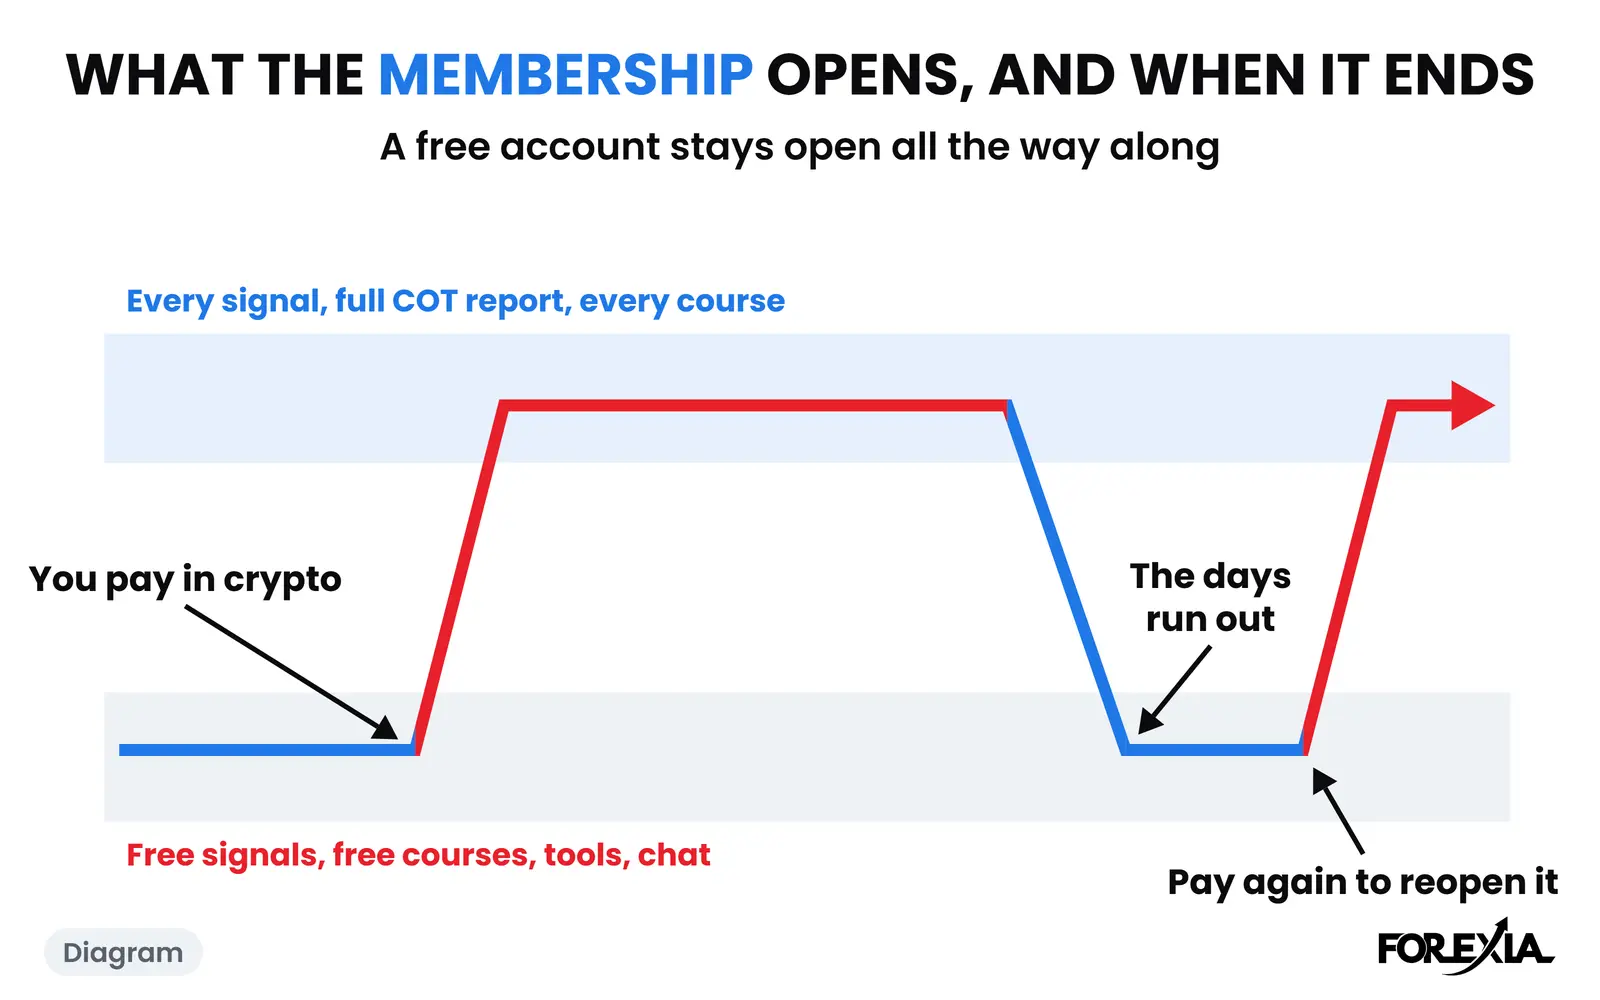
The ForexiaPRO membership against a basic account: what each opens in signals, courses and the COT report. Paid in crypto for 30 days, never auto-renewed.
8 min read
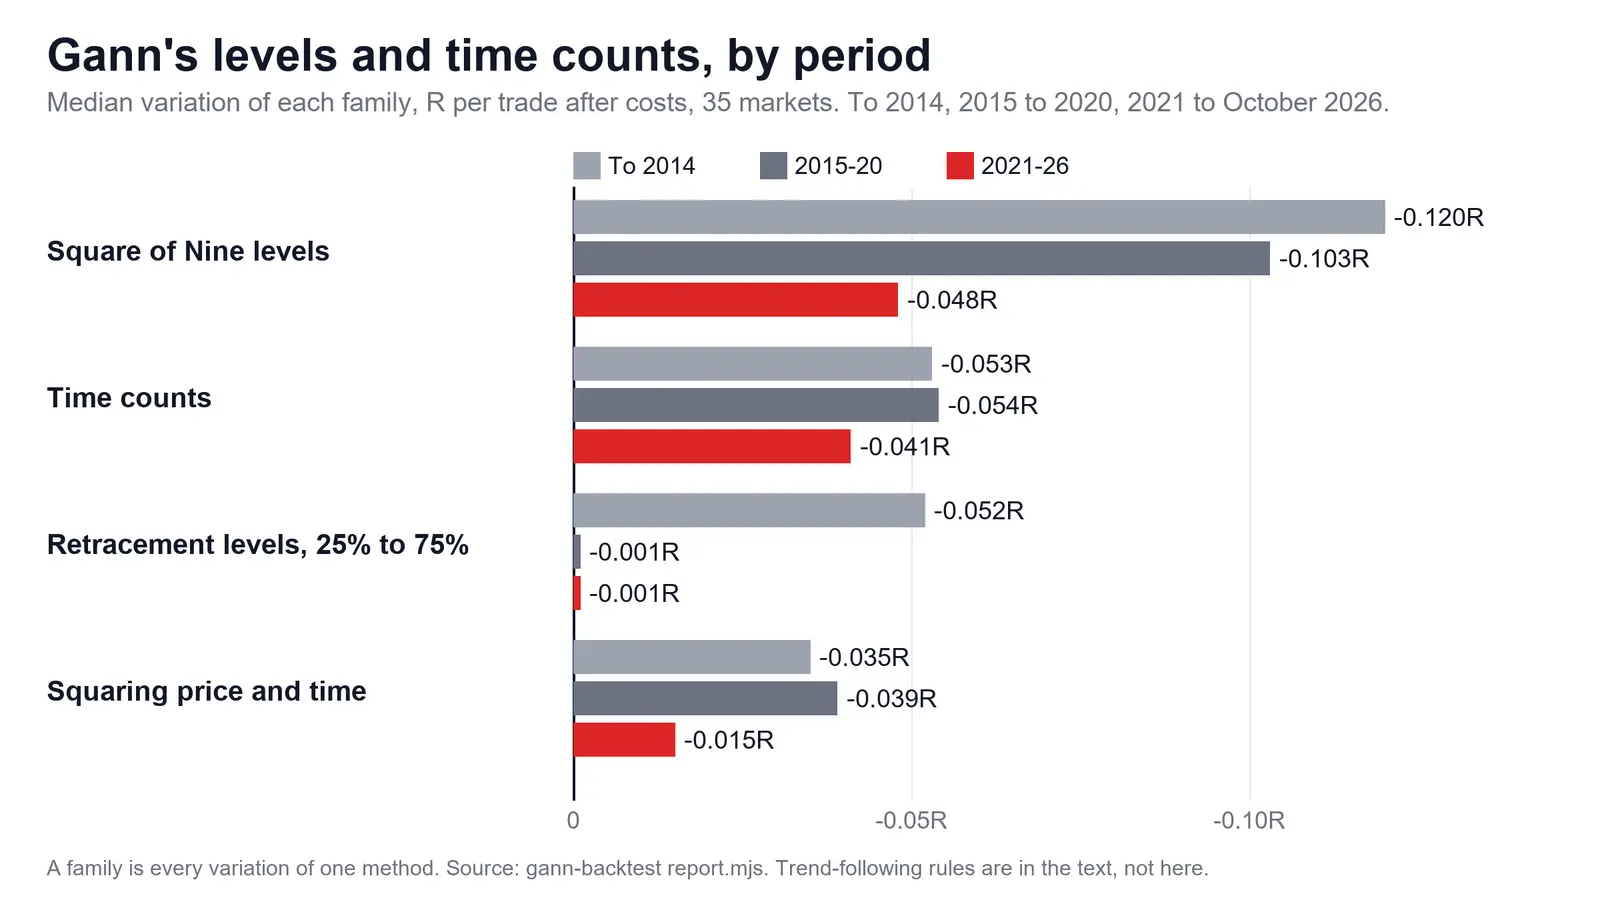
A Gann levels backtest: Square of Nine, the 50% level and time counts lost on 35 markets, and turning points ignored his numbers. Then 40 more.
8 min read
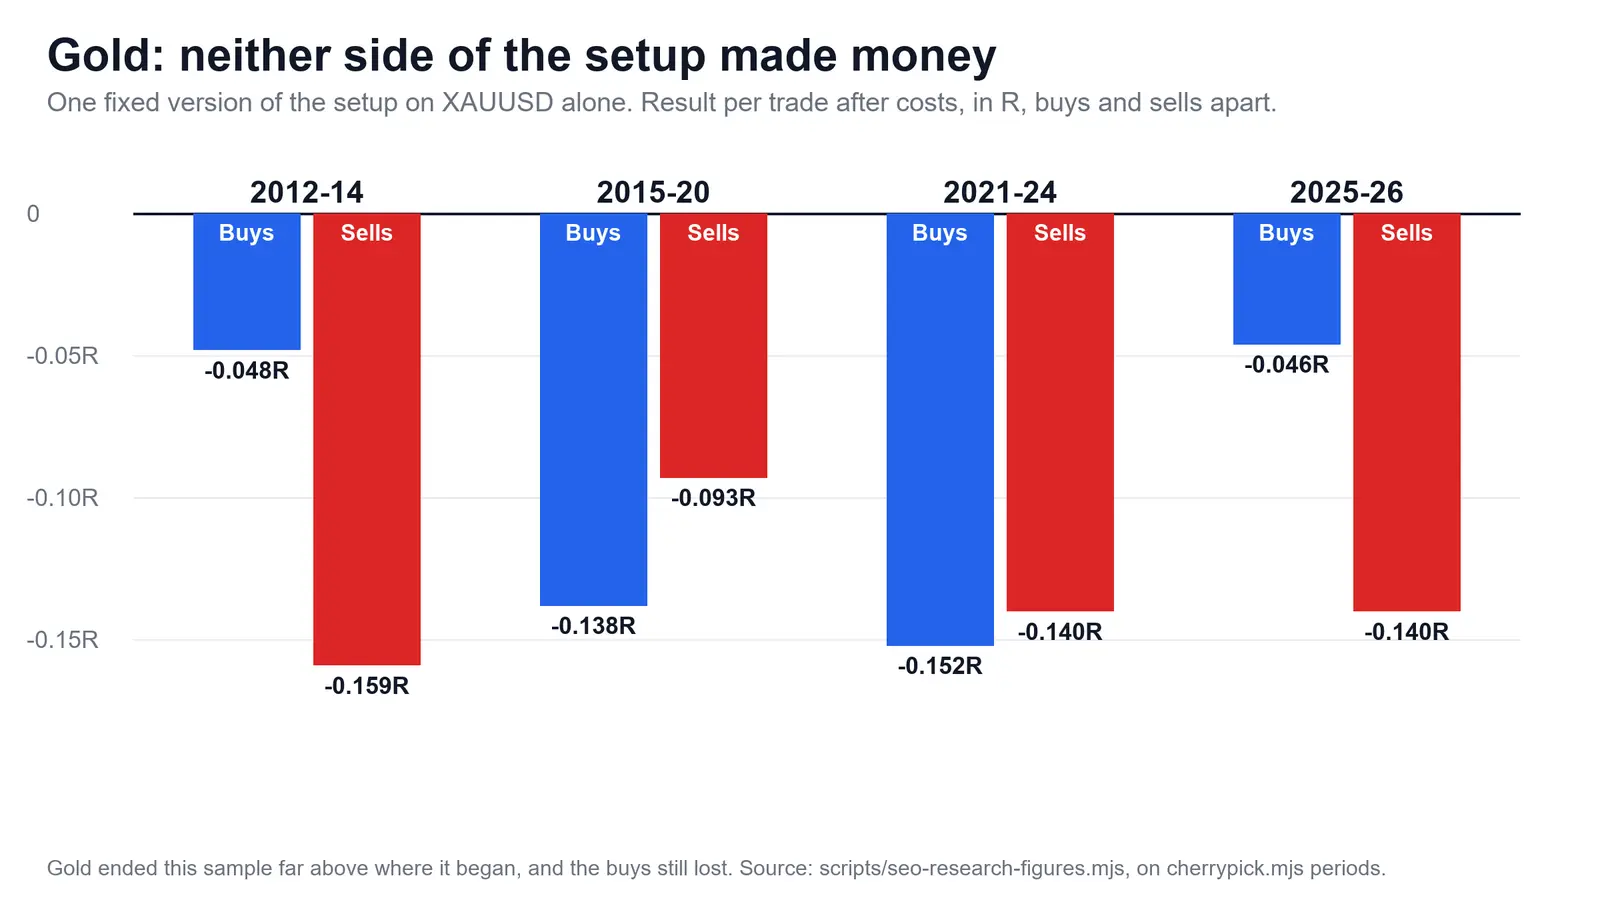
Gold trading strategies tested on XAUUSD with costs: our setup, the London auction trade, Gann levels. What failed, why, and what it does not prove.
7 min read
How much money do you need to start forex trading? Your broker sets the deposit; your stop sets the size you need. Worked on one real GBP/USD day.
8 min read
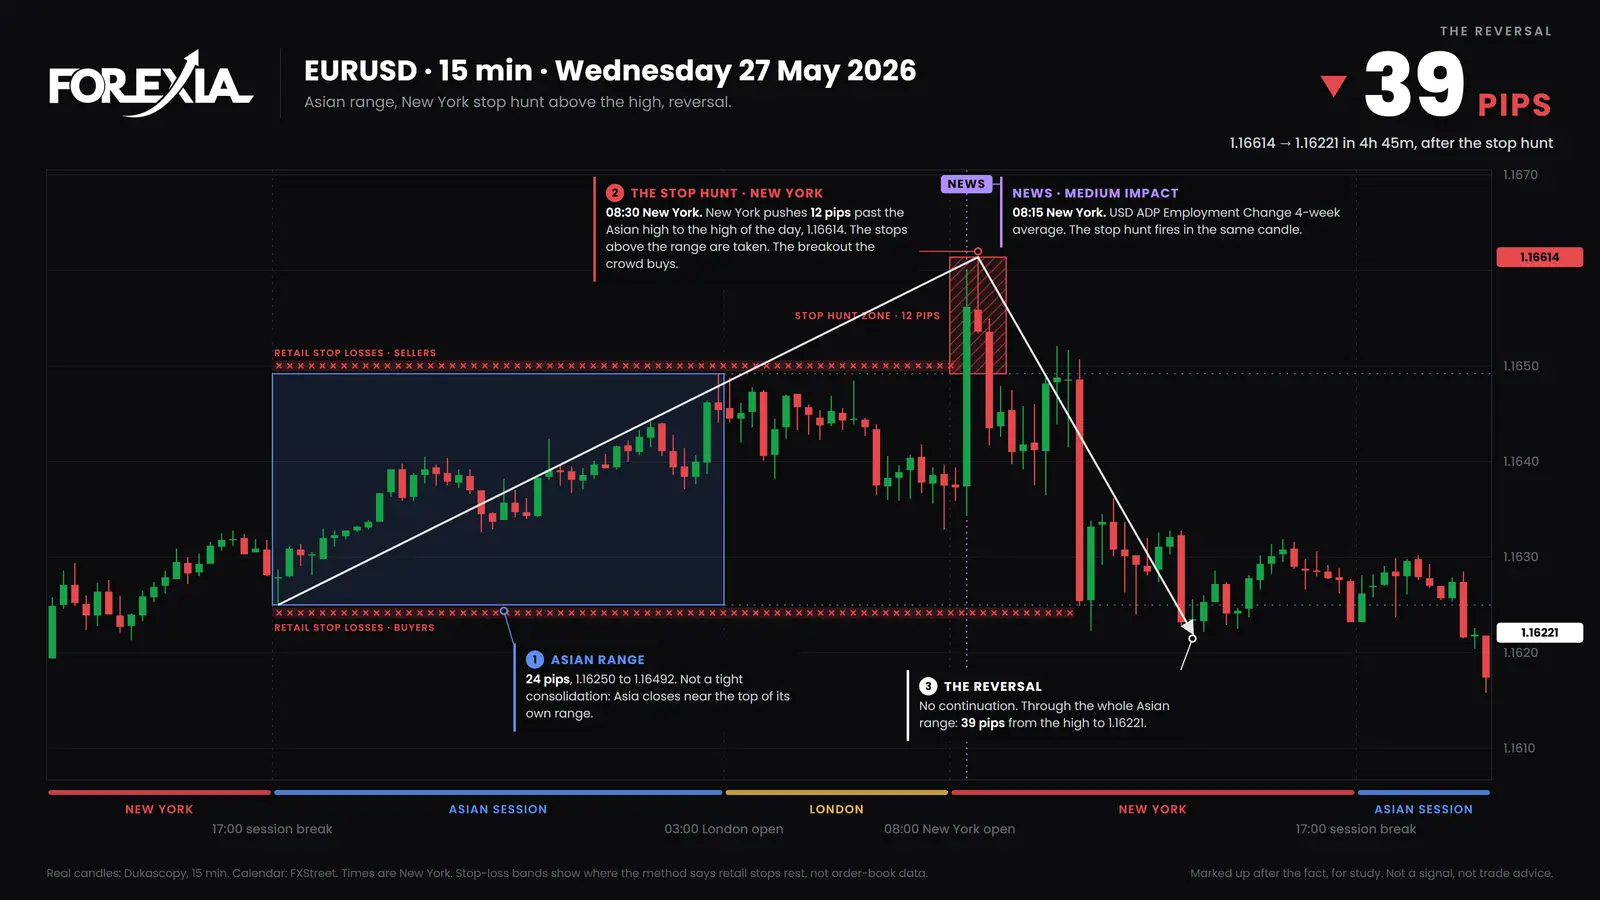
How often does a liquidity sweep reverse? We counted 1,601 levels taken: how many ran, how many were passed again and how many came back, with the rule.
8 min read
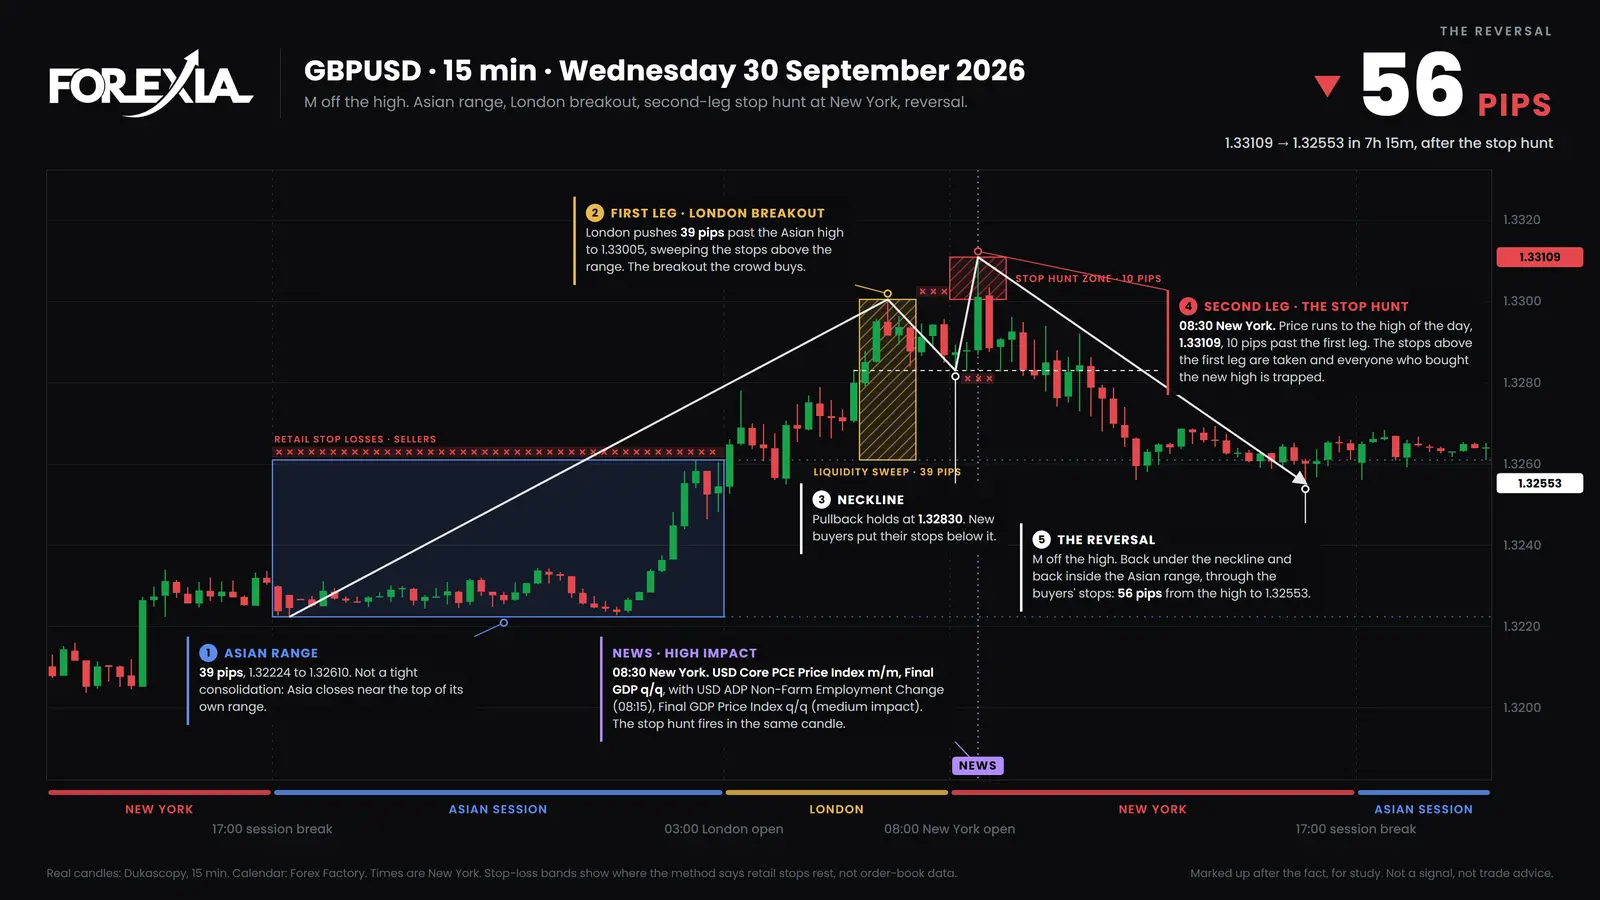
How often does New York reverse London? On 458 days with London's break standing, 91 reversed, 173 came back with no new extreme first and 194 did not.
8 min read
How to choose a forex signal provider: seven questions on the record, the losses, a stop after TP1 and risk per trade, with our own free record as the example.
9 min read
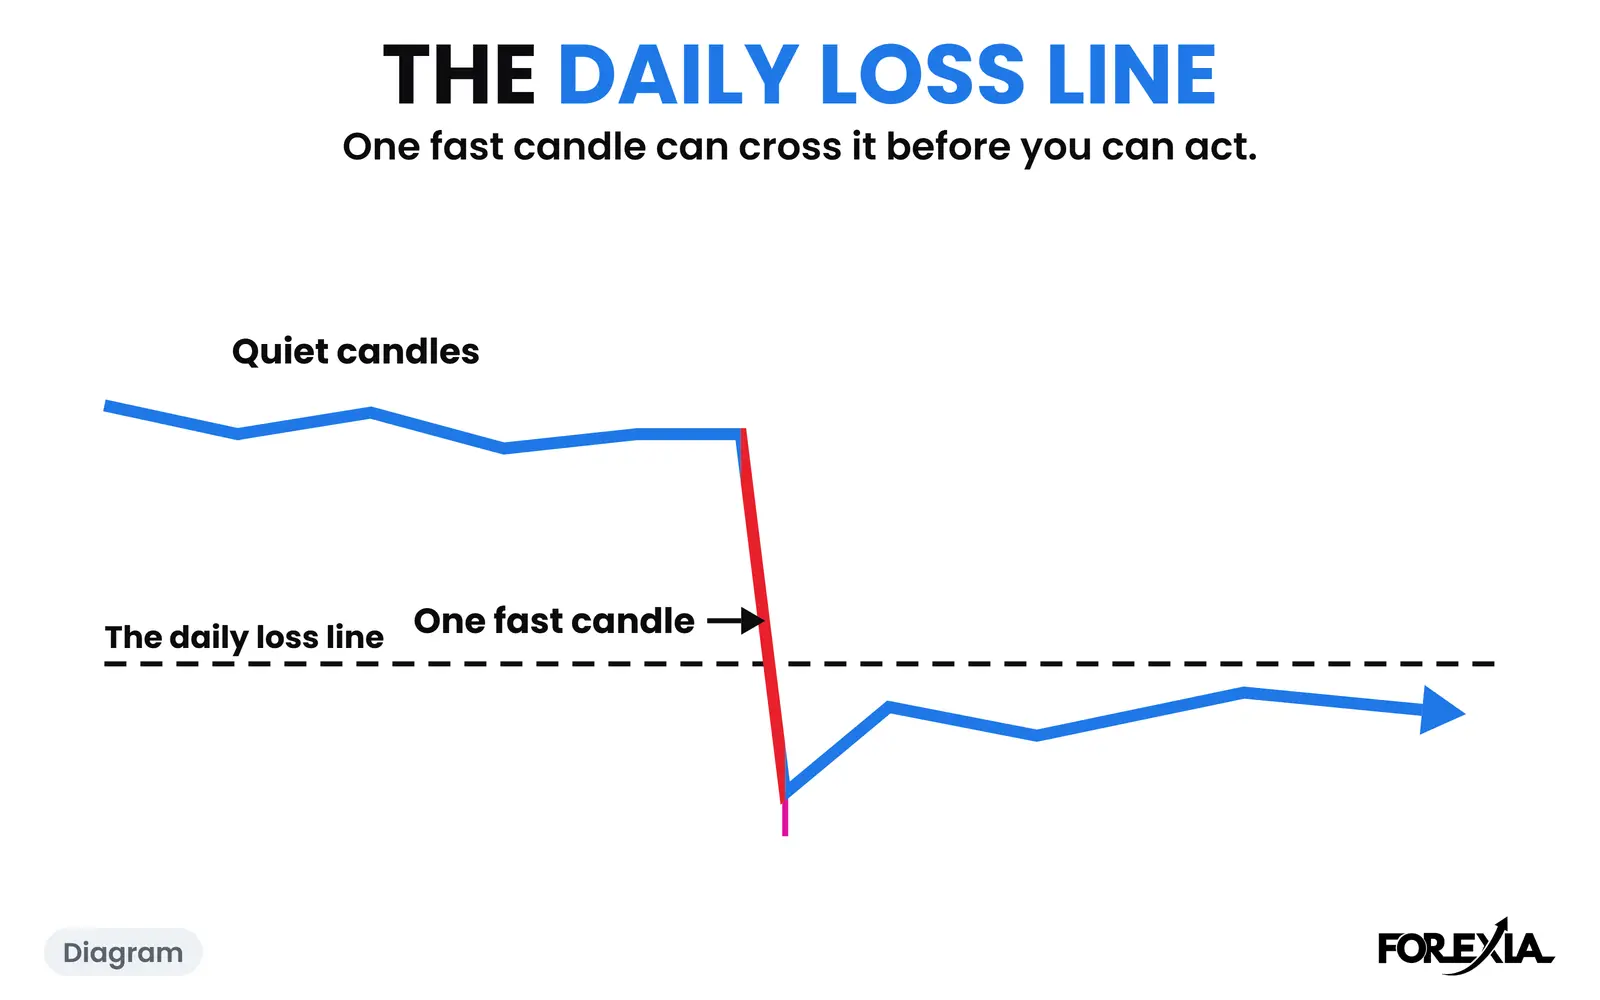
A prop firm challenge is passed by staying under its daily loss rule first. Risk sums, one 73-pip candle and one 37-pip hunt on real EUR/USD days.
10 min read
How to read a forex signal: entry, stop, four targets and what a stop after TP1 means, on one real GBP/USD signal and the public record it sits in.
8 min read
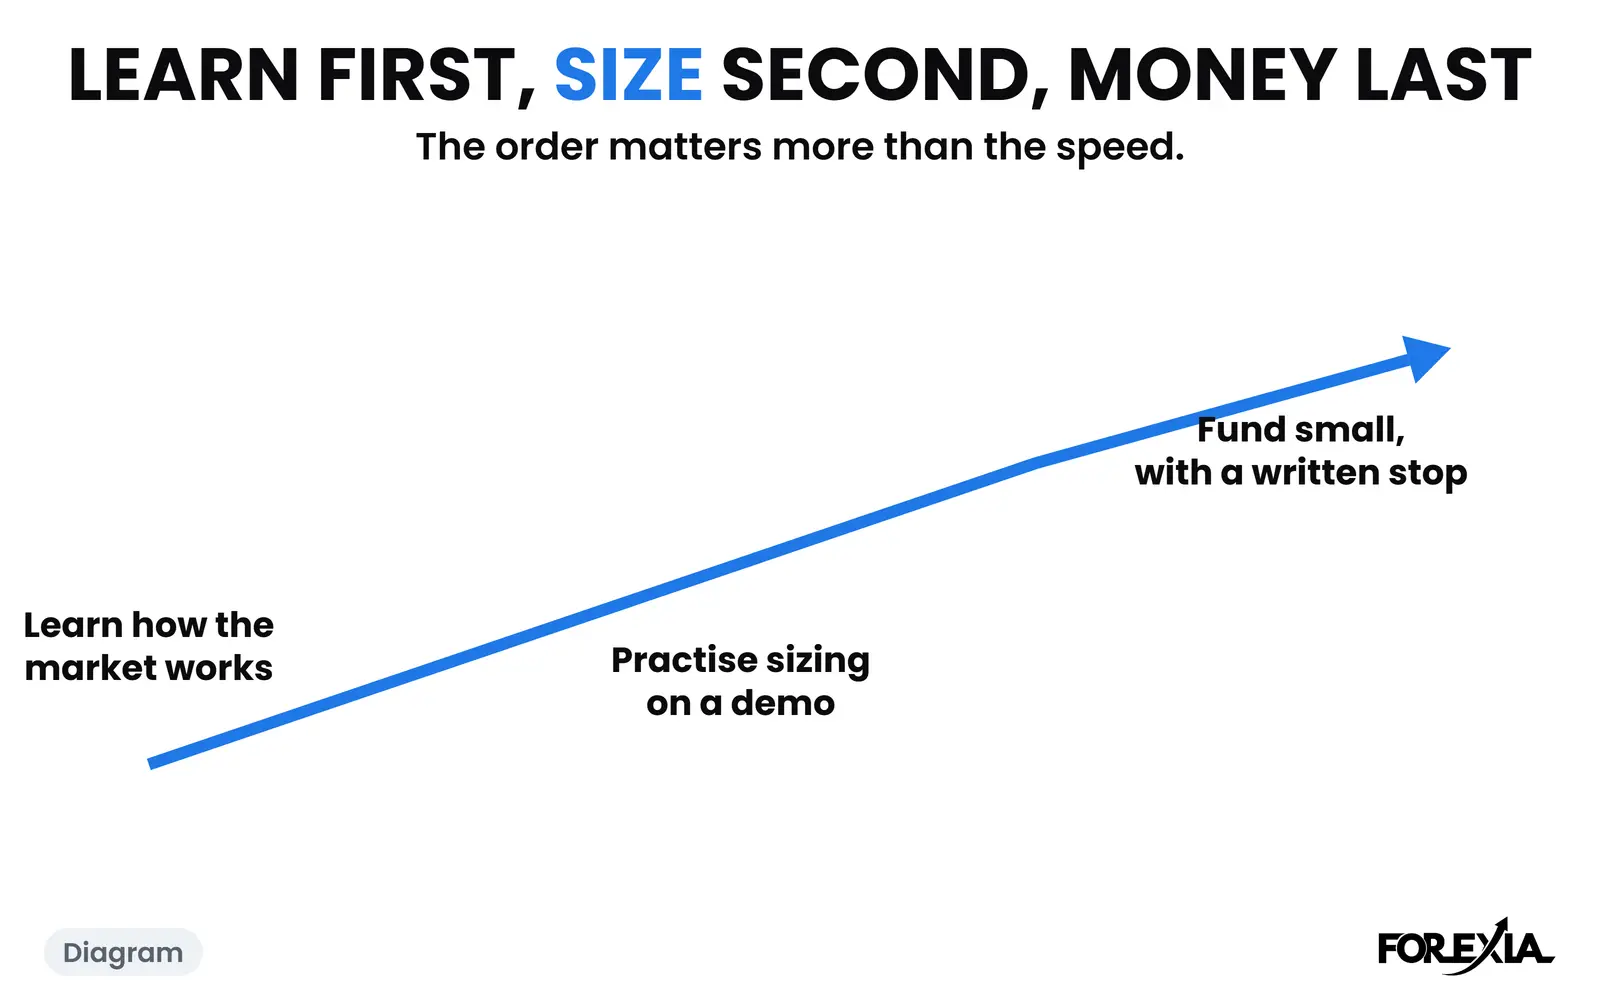
How to start forex trading step by step: learn the terms, read a chart, practise sizing on a demo, write your rules, then fund small. One real EUR/USD day.
8 min read
A leverage calculator and margin calculator for forex and gold: the margin a position holds back, the leverage it really uses and what it does to a stop.
6 min read
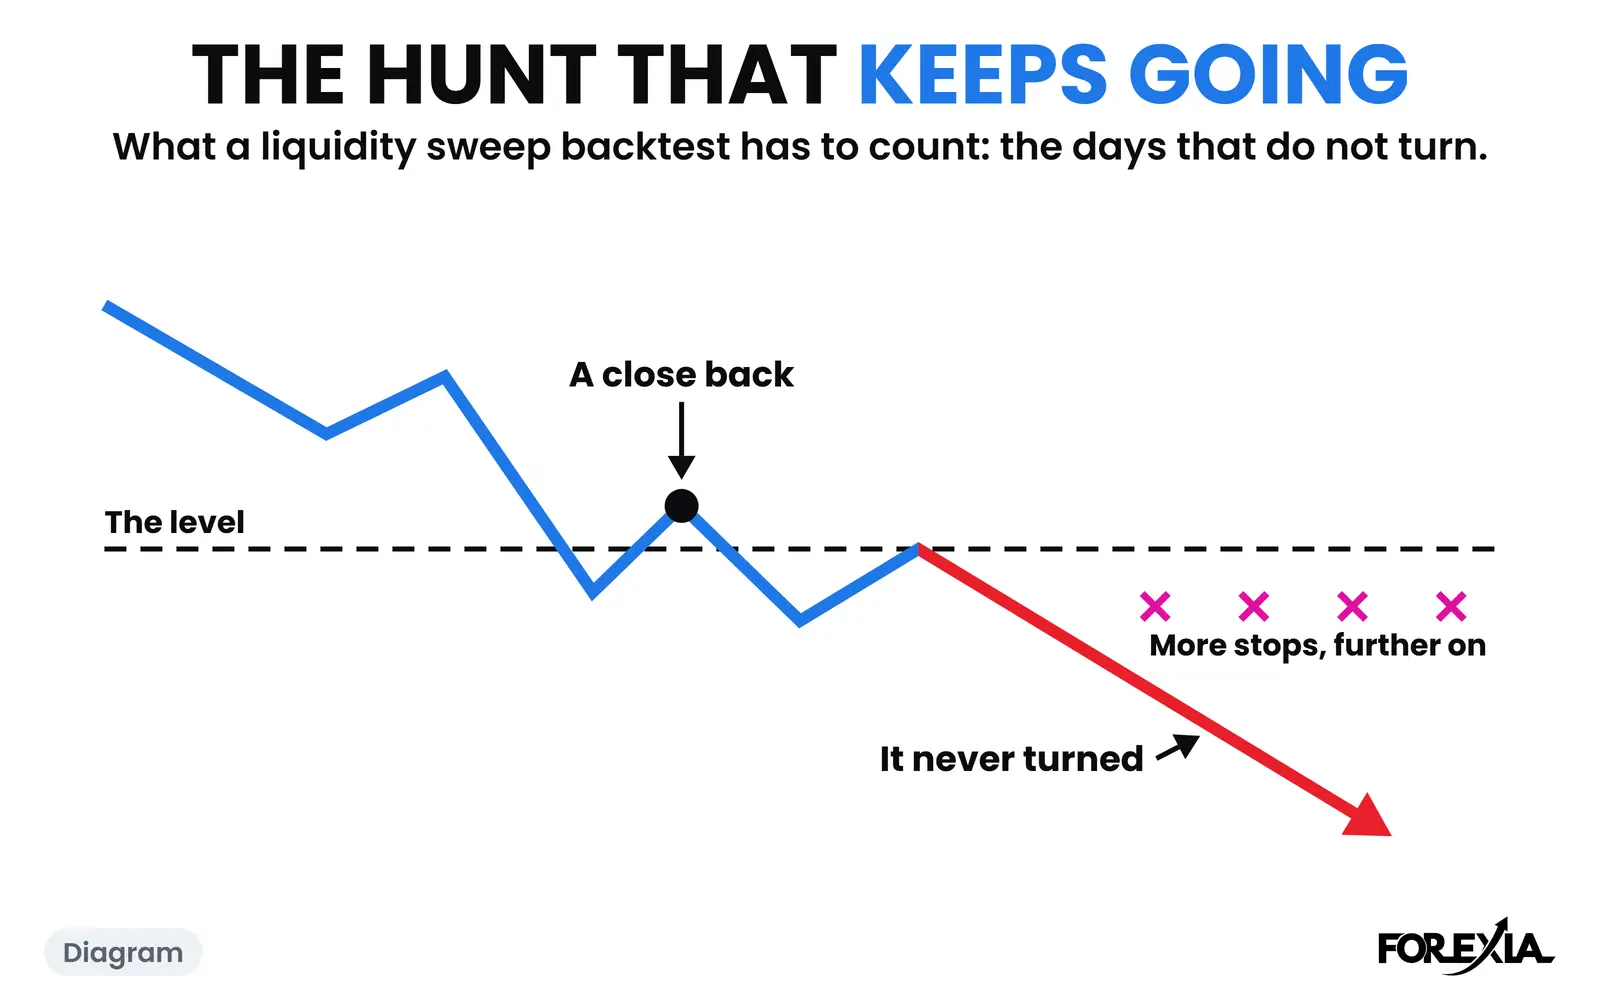
Our liquidity sweep backtest lost money after costs. What it found, where the stops went, and three real days when the hunt kept going or failed late.
9 min read
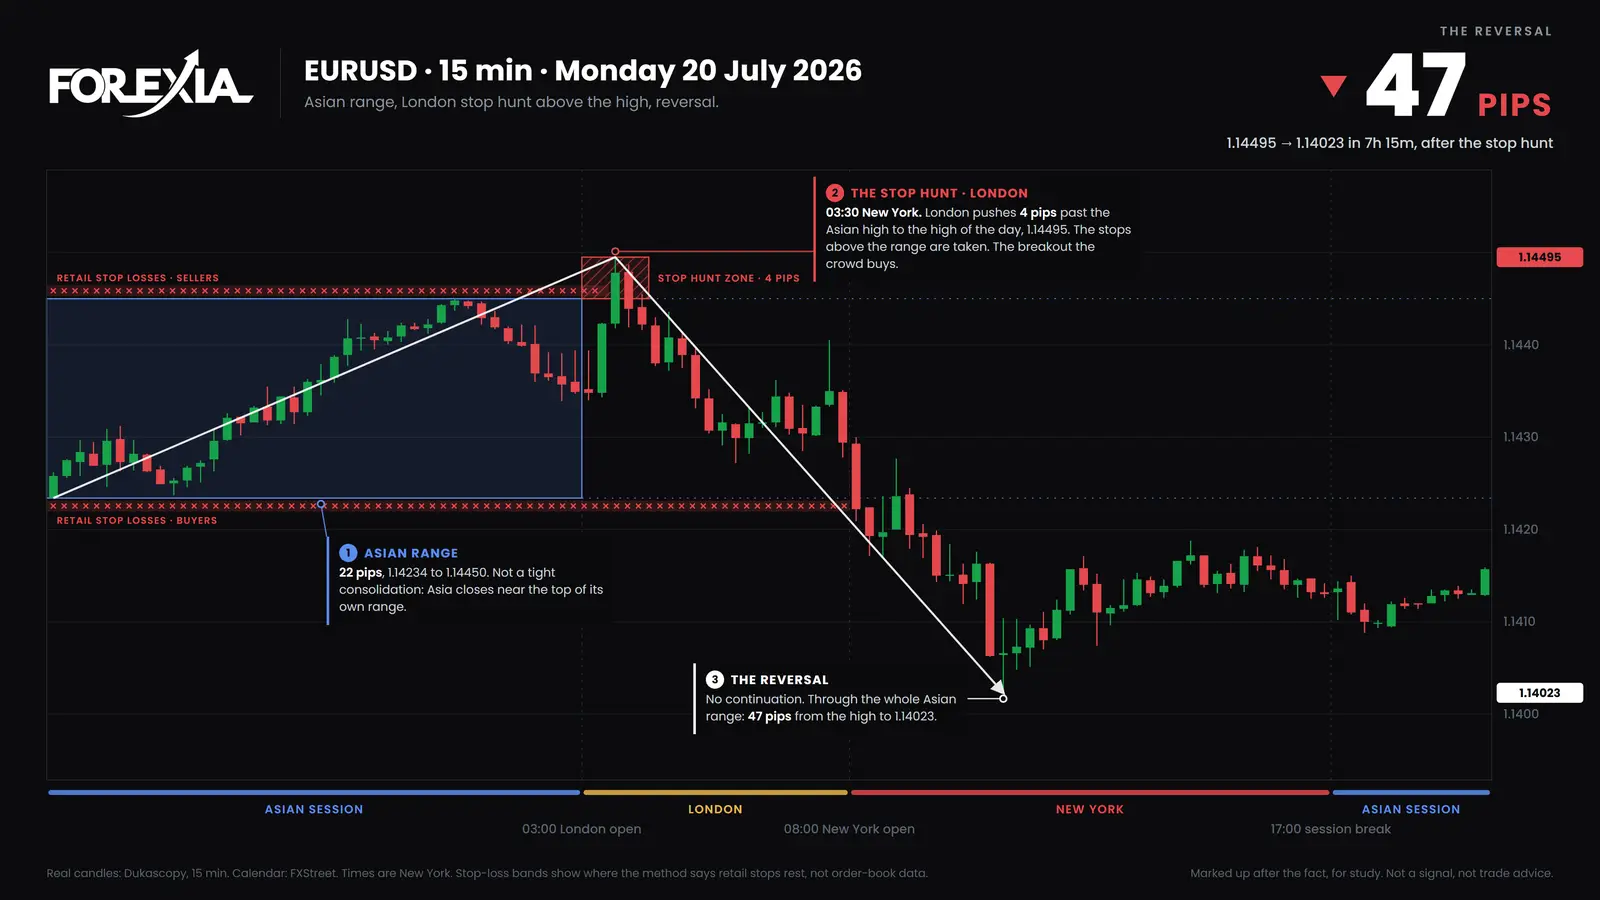
Is the London open a fakeout of the Asian range? On 958 market-days we counted which side went first and where the day ended, with the rule and charts.
8 min read
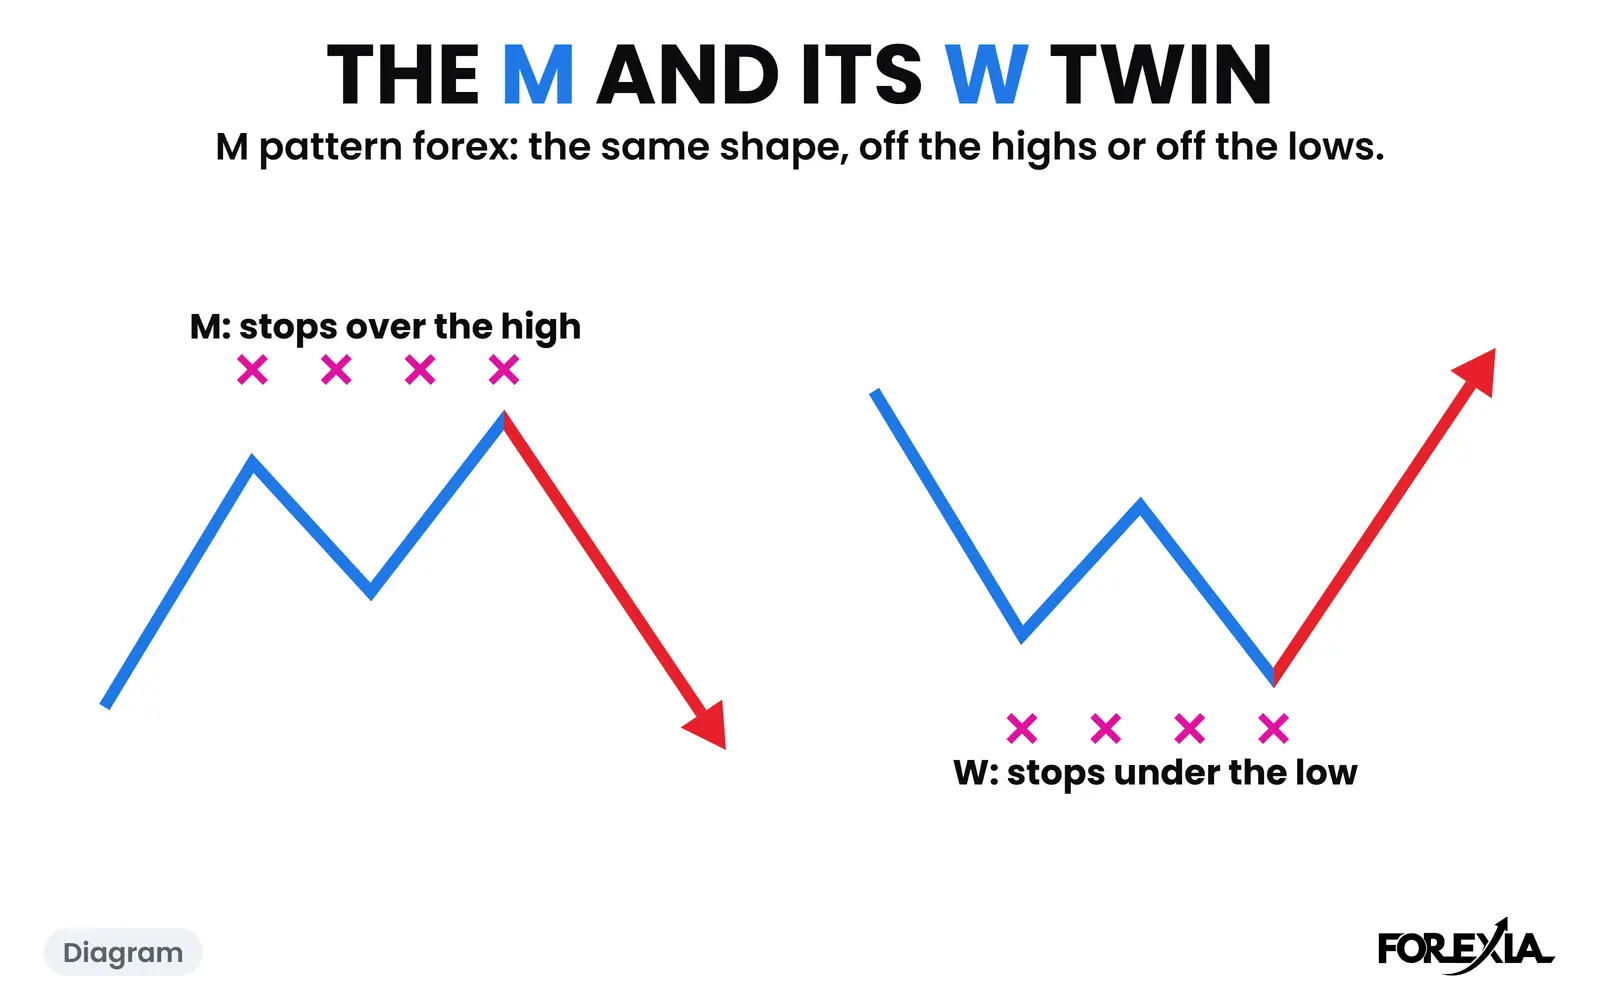
M and W pattern vs double top: the book draws the shape, we read the hunt behind it. Two dated 2026 days, USD/JPY and gold, and a count of 983 shapes.
7 min read
A forex strategy backtest from 2015 to 2026 of our own setup, with real costs: it lost in every period. Why, what we tried, and what it does not prove.
8 min read
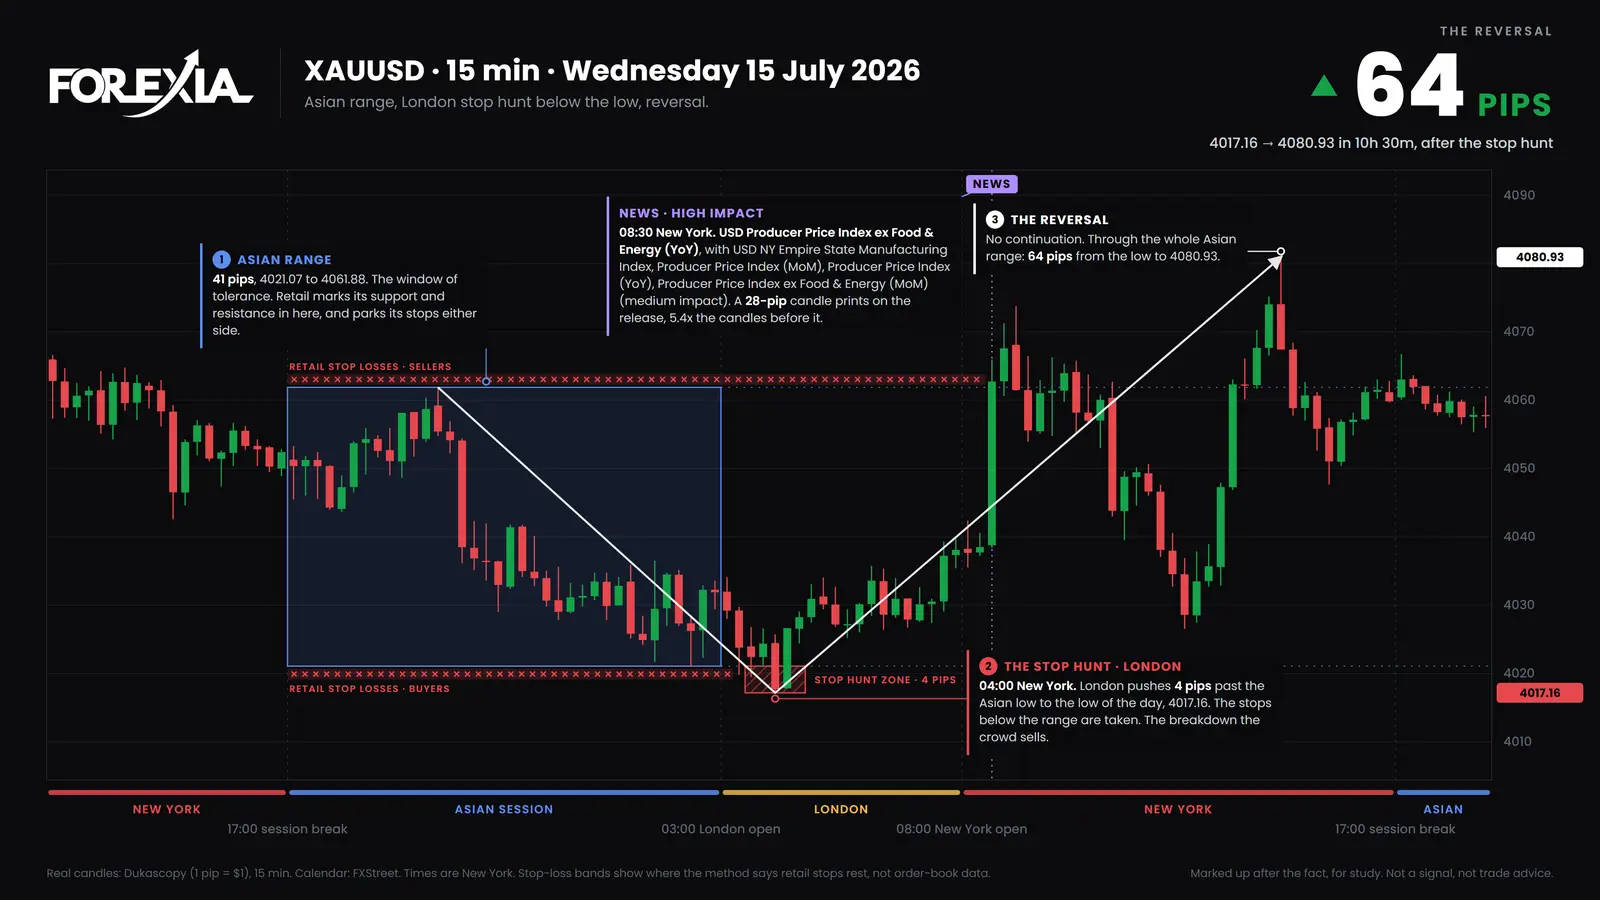
A pip calculator for forex and gold: what one pip is worth on your position, in your account's currency, with yen pairs, crosses and a real day worked.
7 min read
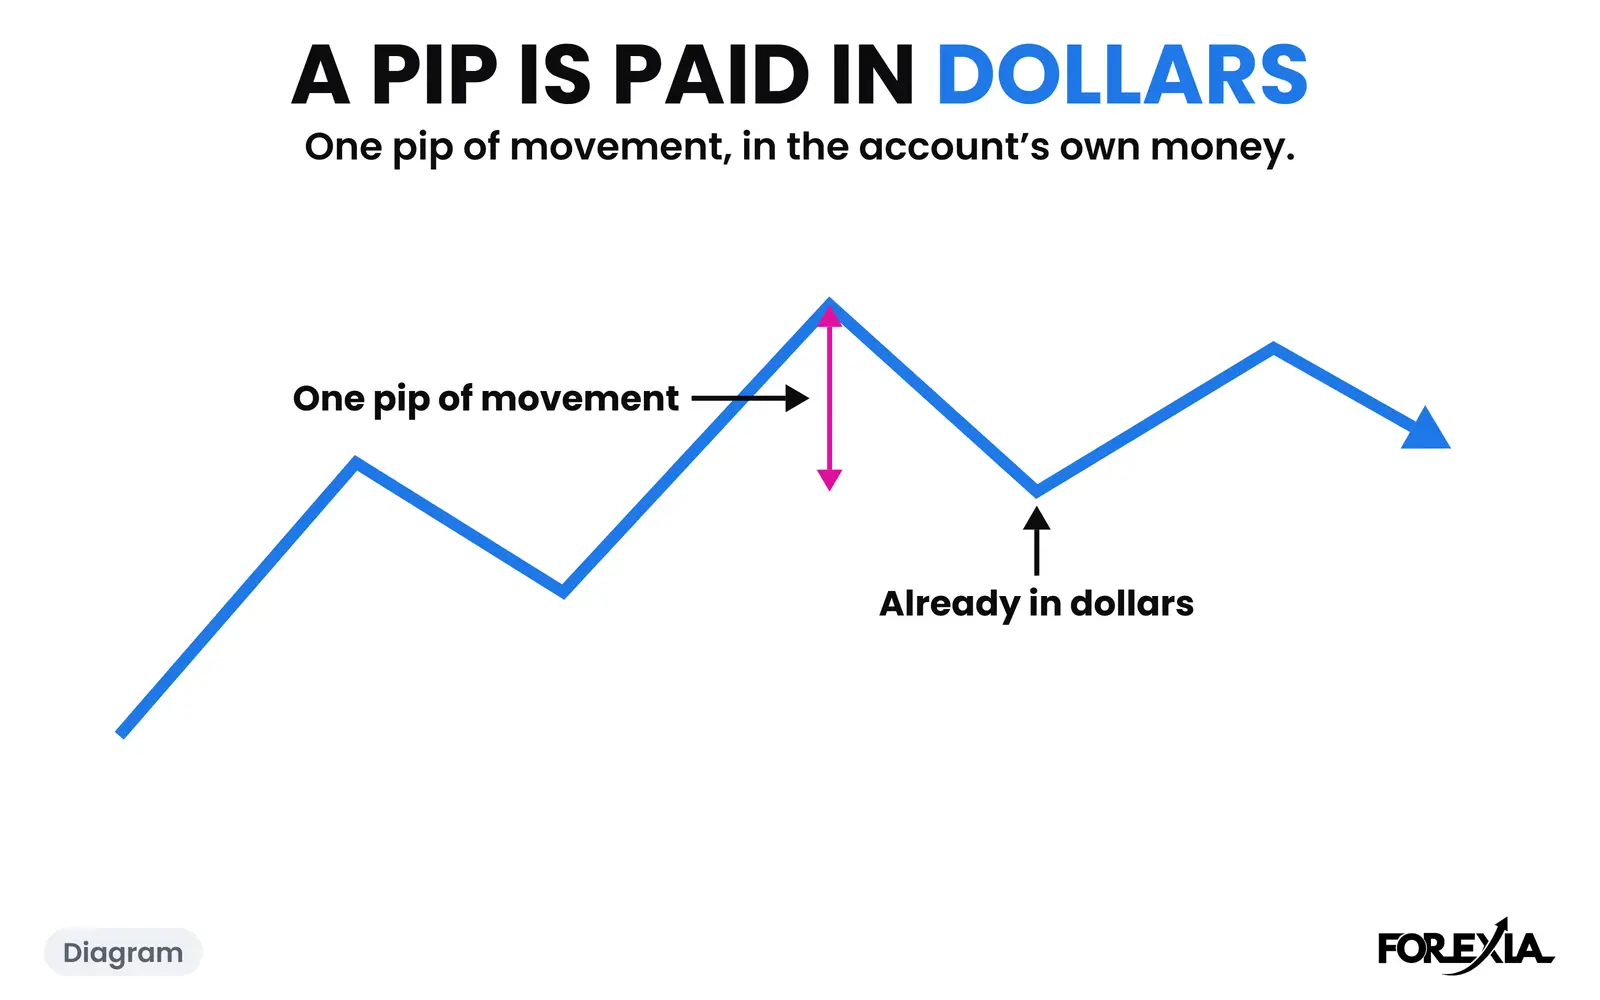
AUDUSD pip value on 9 November 2026: $10.00 a standard lot, $1.00 a mini lot and $0.10 a micro lot, with the day's range worked in pips and dollars.
8 min read
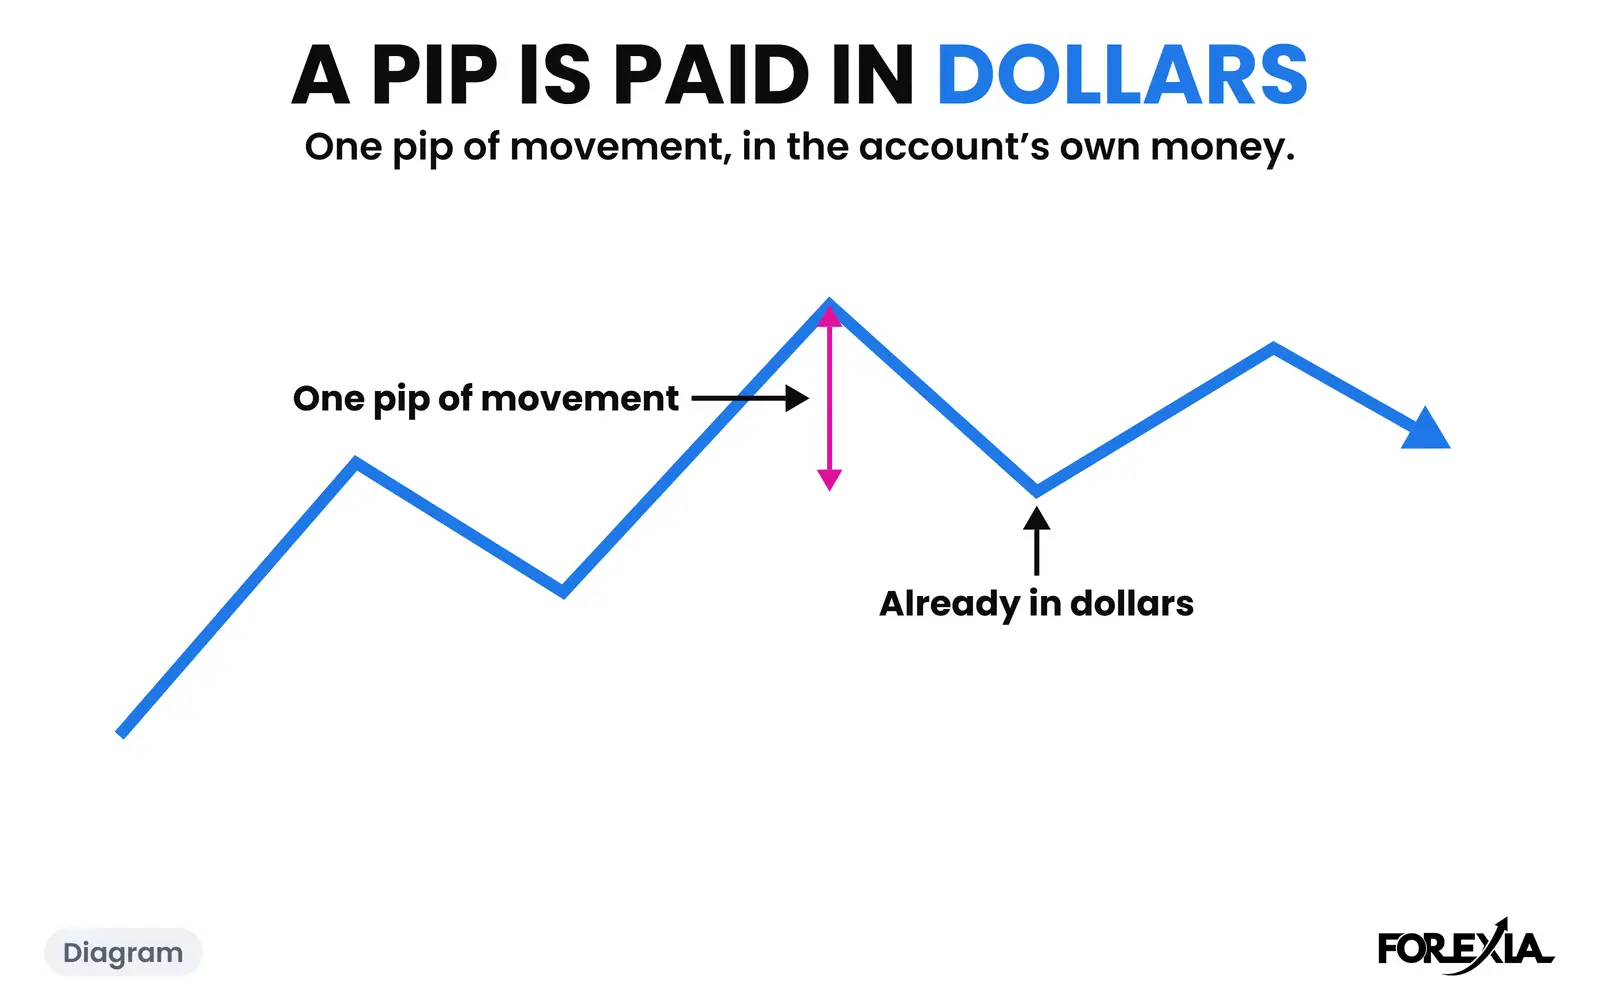
EURUSD pip value on 9 November 2026: $10.00 a standard lot, $1.00 a mini lot and $0.10 a micro lot, with the day's range worked in pips and dollars.
8 min read
GBPUSD pip value on 9 November 2026: $10.00 a standard lot, $1.00 a mini lot and $0.10 a micro lot, with the day's range worked in pips and dollars.
8 min read
NZDUSD pip value on 9 November 2026: $10.00 a standard lot, $1.00 a mini lot and $0.10 a micro lot, with the day's range worked in pips and dollars.
8 min read
USDCAD pip value on 9 November 2026: $7.08 a standard lot, $0.71 a mini lot and $0.071 a micro lot, with the day's range worked in pips and dollars.
8 min read
USDCHF pip value on 9 November 2026: $12.20 a standard lot, $1.22 a mini lot and $0.12 a micro lot, with the day's range worked in pips and dollars.
8 min read
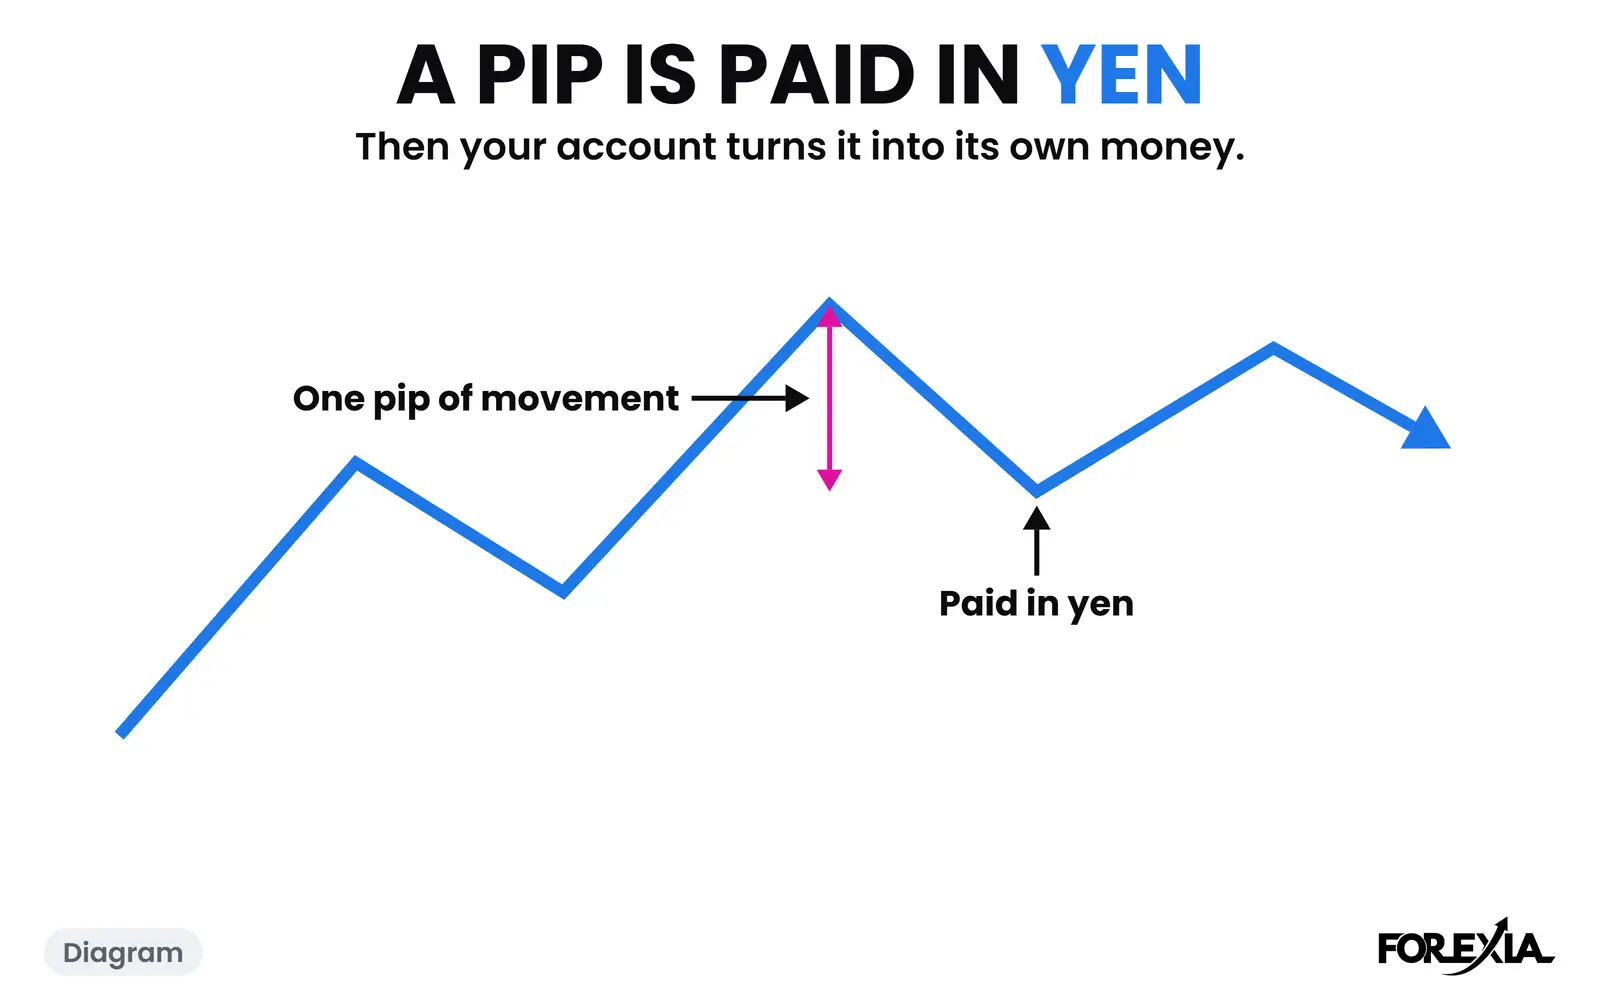
USDJPY pip value on 9 November 2026: $6.33 a standard lot, $0.63 a mini lot and $0.063 a micro lot, with the day's range worked in pips and dollars.
8 min read
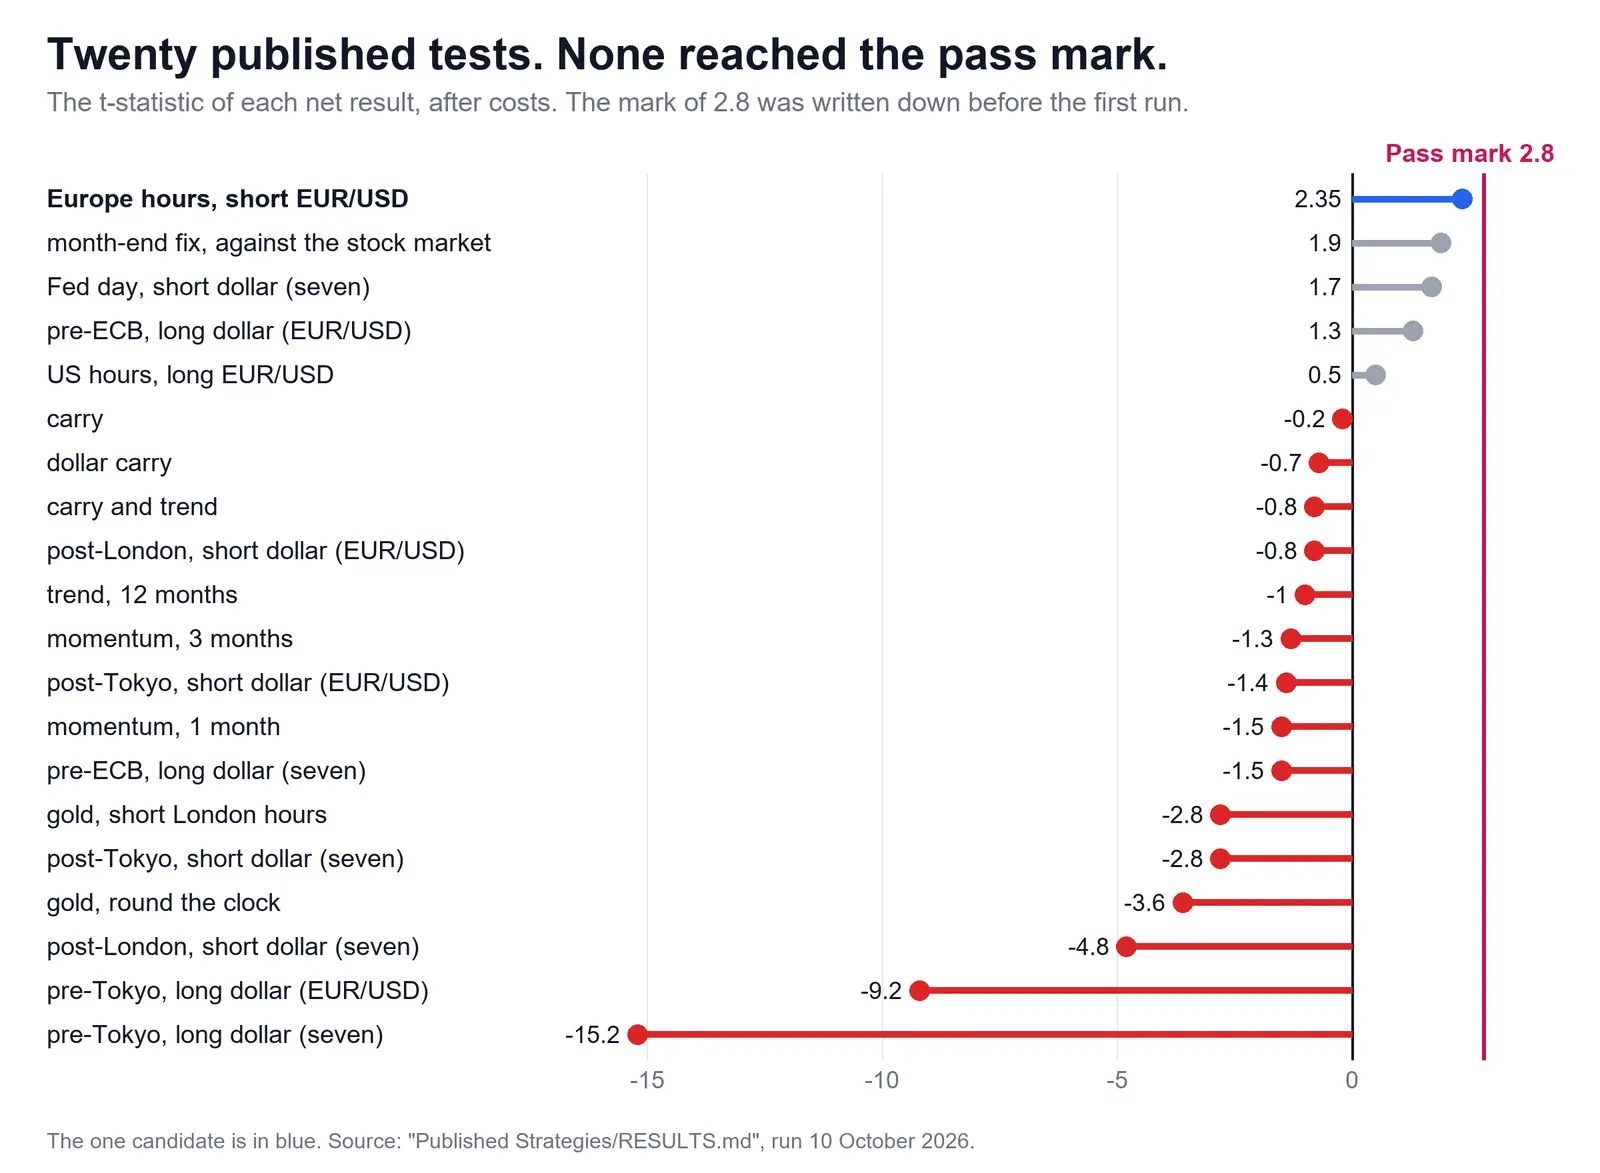
A published trading strategies backtest: 20 tests with retail costs against a mark set in advance. None passed. Every result, the rules and the limits.
7 min read
Reversal candlestick patterns: the hammer, shooting star, engulfing, star, doji and piercing line, where the stop goes, and one shape on two real CPI days.
10 min read
A risk reward ratio calculator for forex: the R a target offers, the share of trades that must be won to break even, and a real gold day worked in full.
6 min read
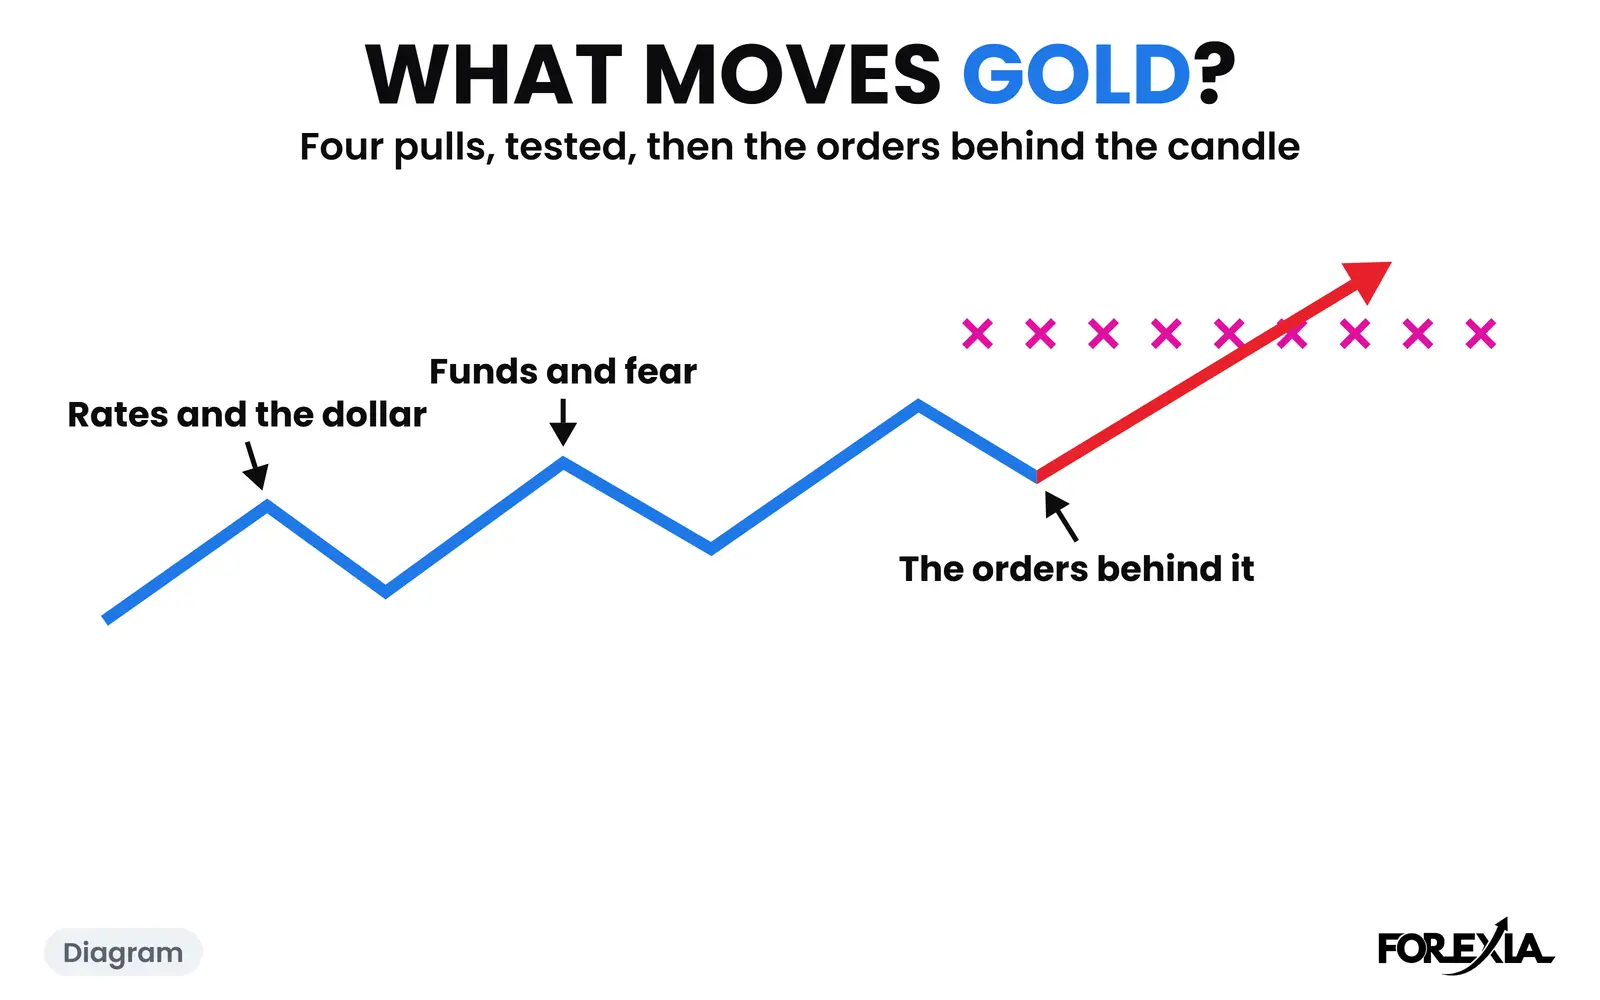
What moves gold in the forex market? Real yields, the dollar and funds, tested on 223 real days: the dollar matched gold's direction on 145 of them.
6 min read
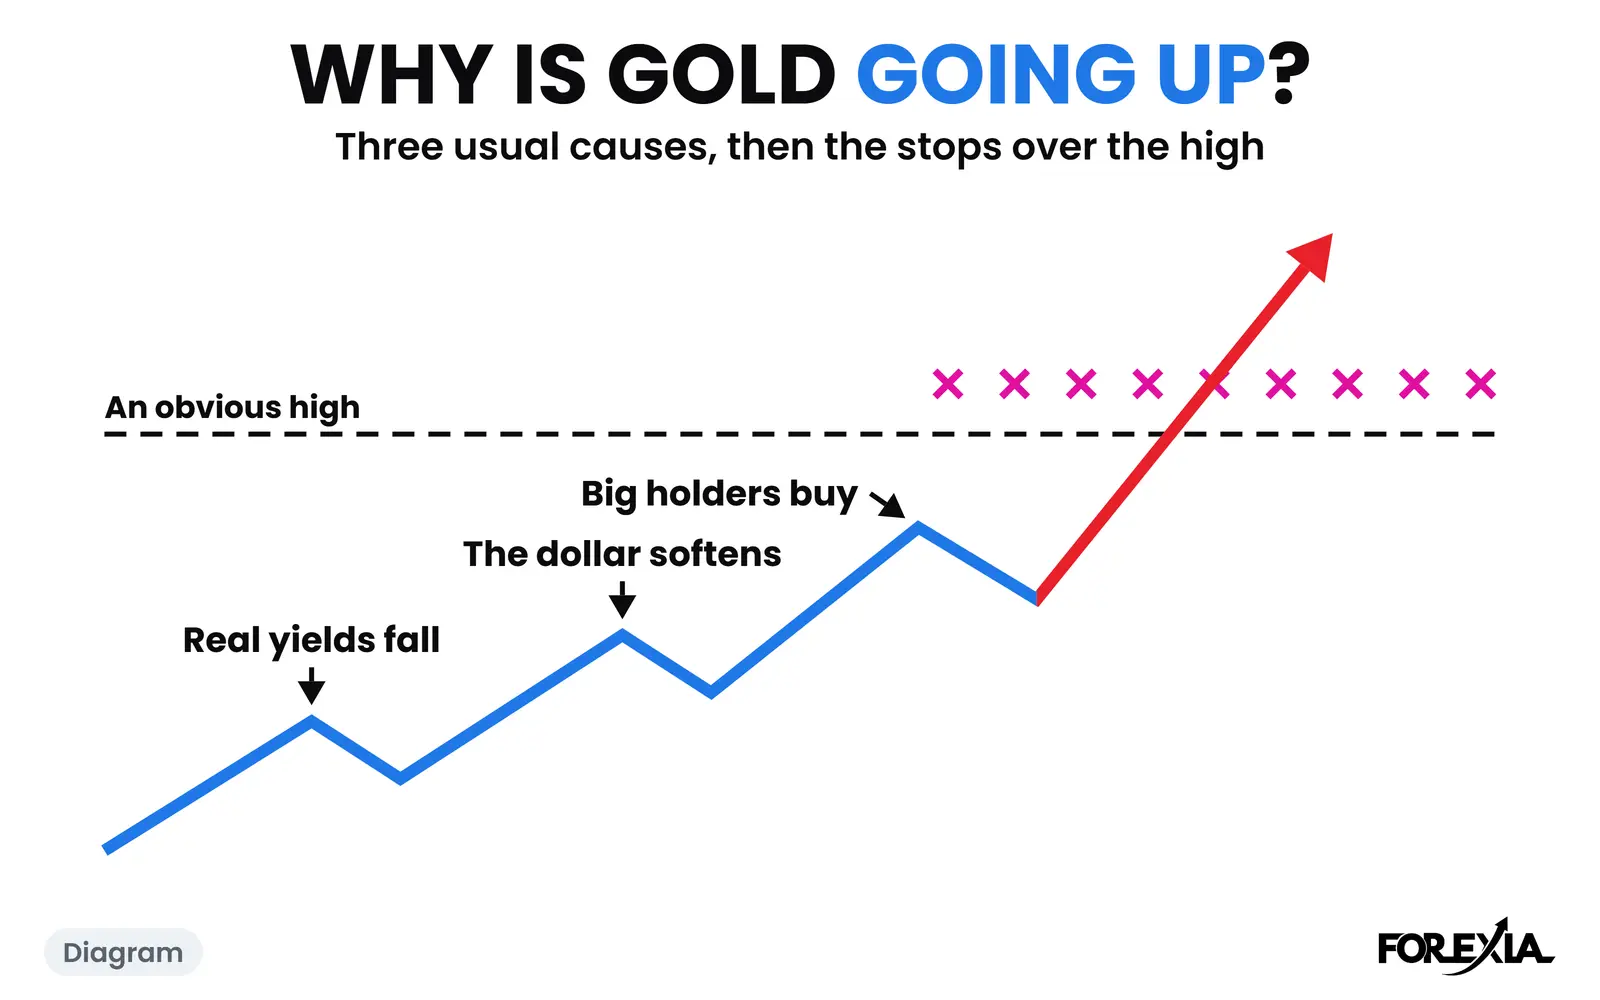
Why is gold going up? The latest rise, 130 pips on 4 November 2026, and three older rallies checked against yields, the dollar and the calendar.
9 min read
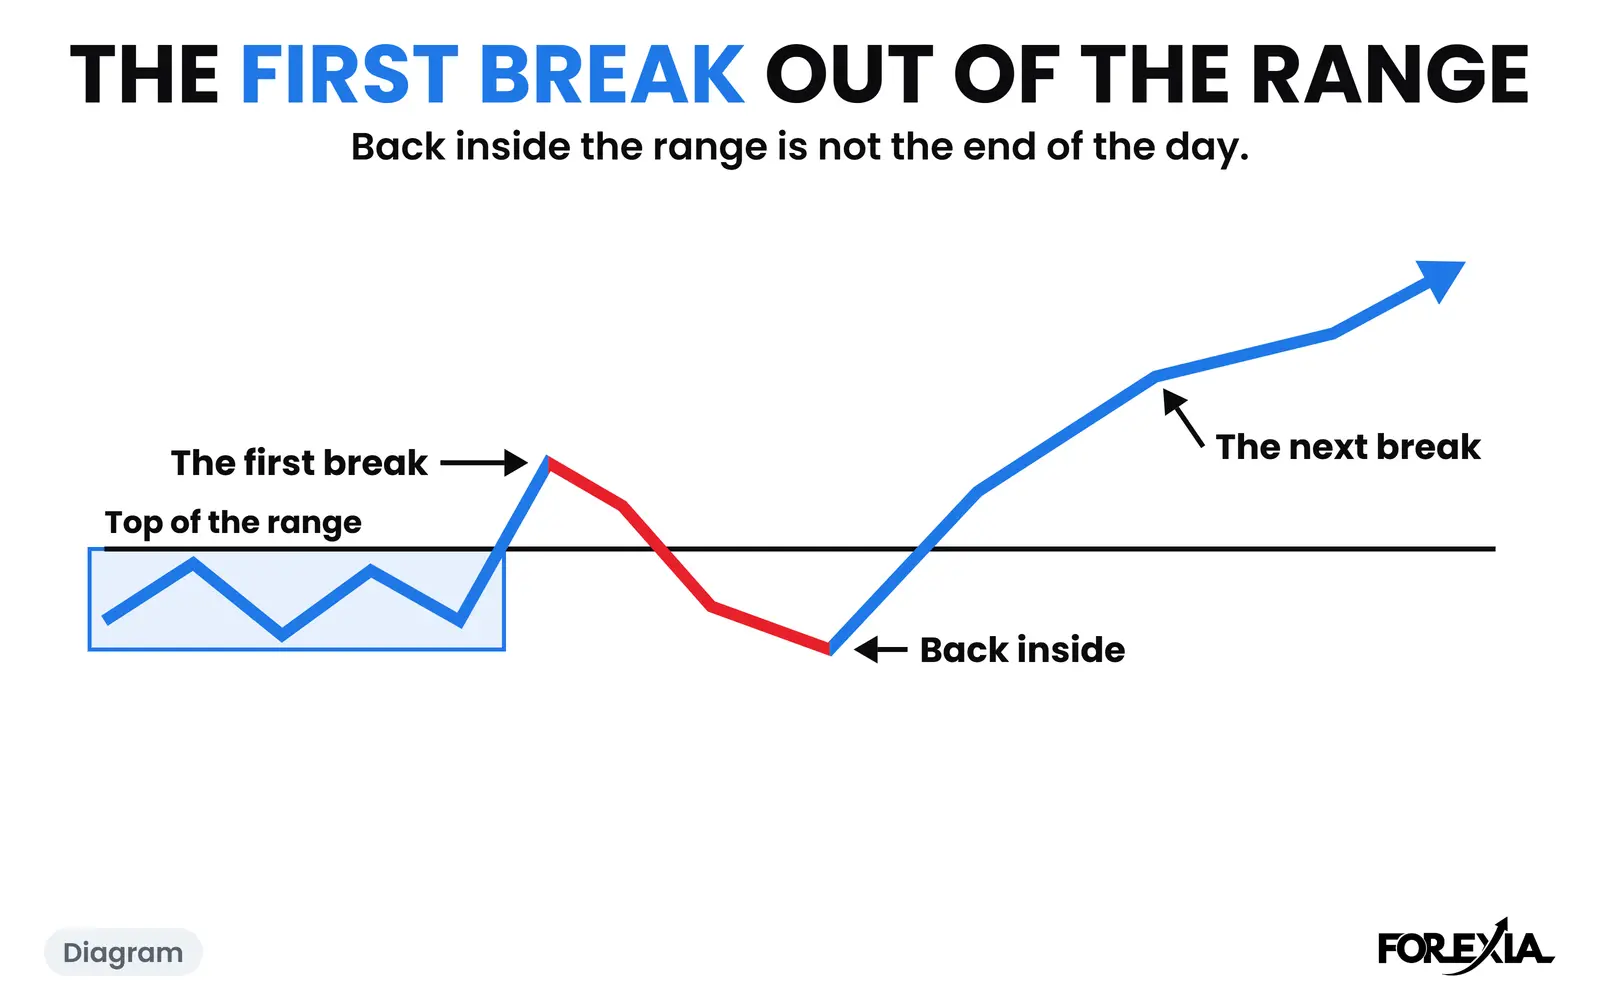
An Asian range breakout often closes back inside. Why, in resting orders, how often across eight markets, and a day it held. Real dated charts, no signals.
8 min read
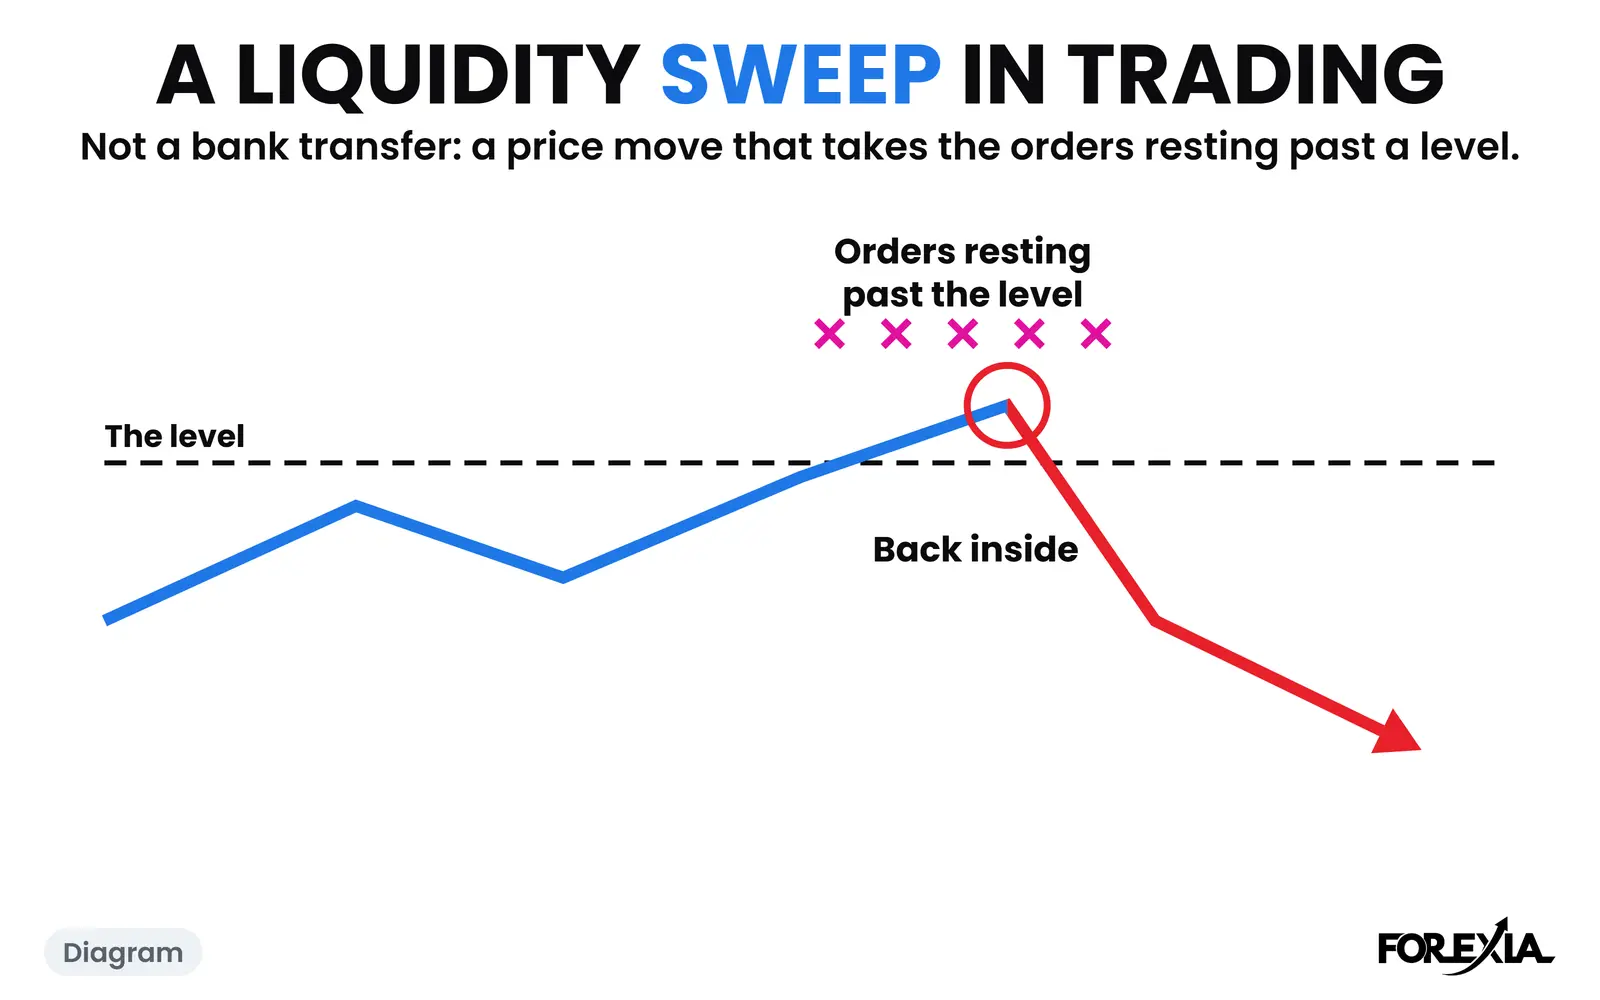
Liquidity sweep meaning in banking, in stock execution and in trading: three different things under one name, and the trading one on a real dated day.
6 min read
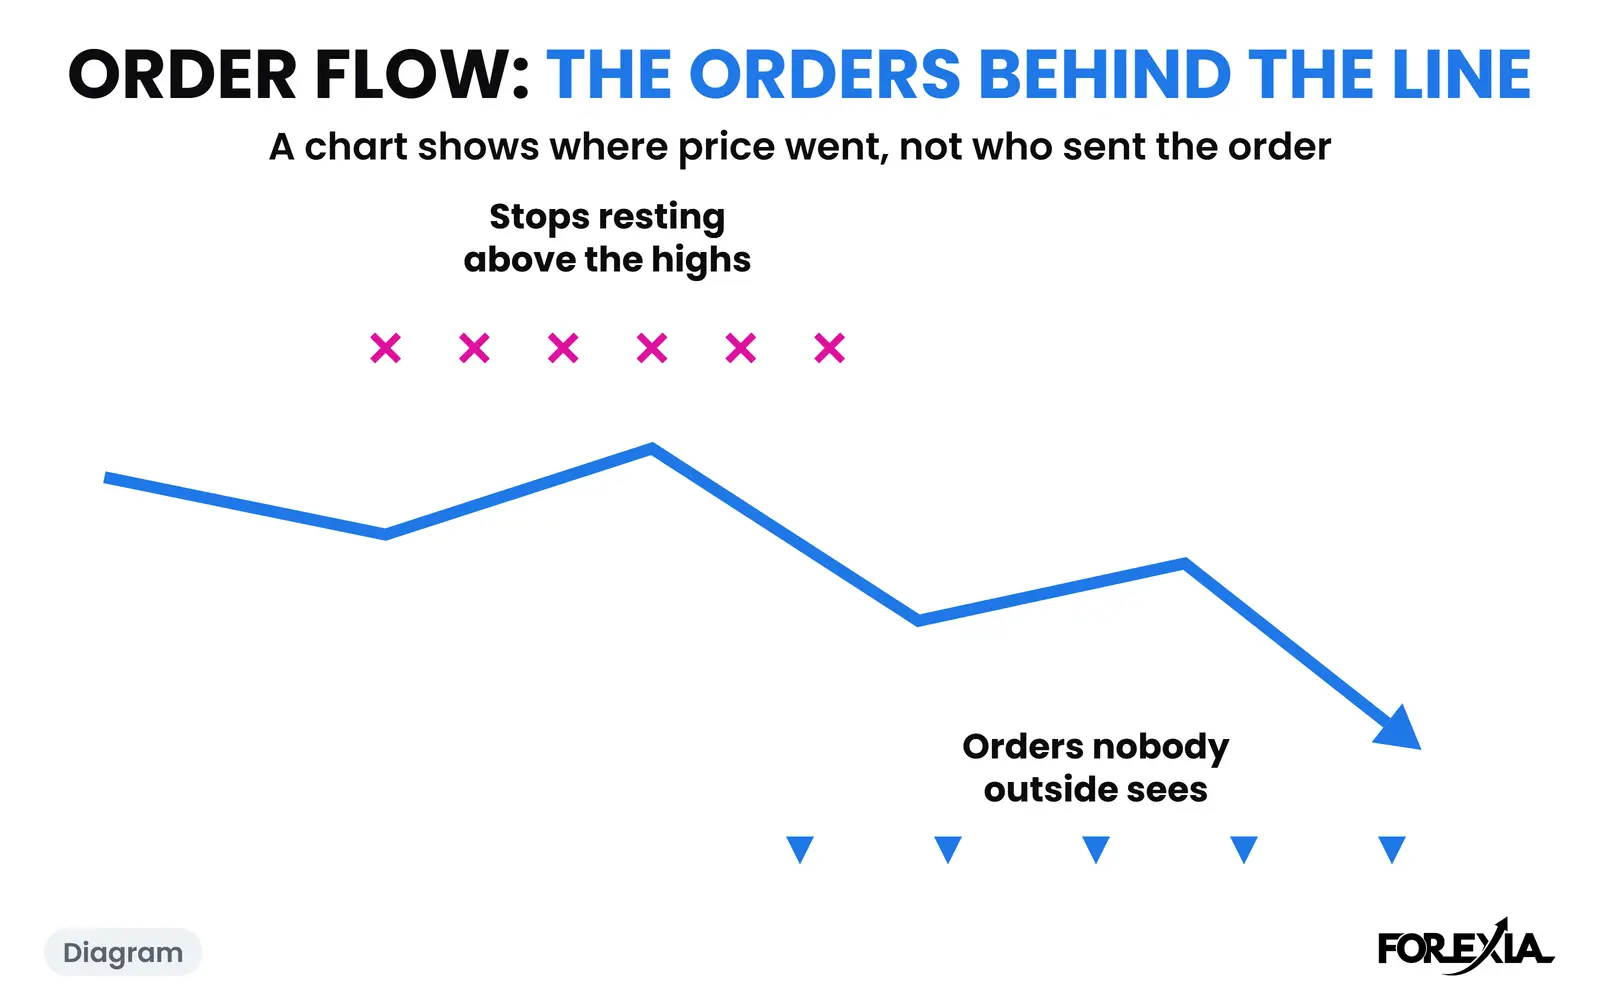
Forex order flow explained: what it is, why spot forex has no public order book, what a chart can and cannot show, and one real dated day on our chart.
6 min read
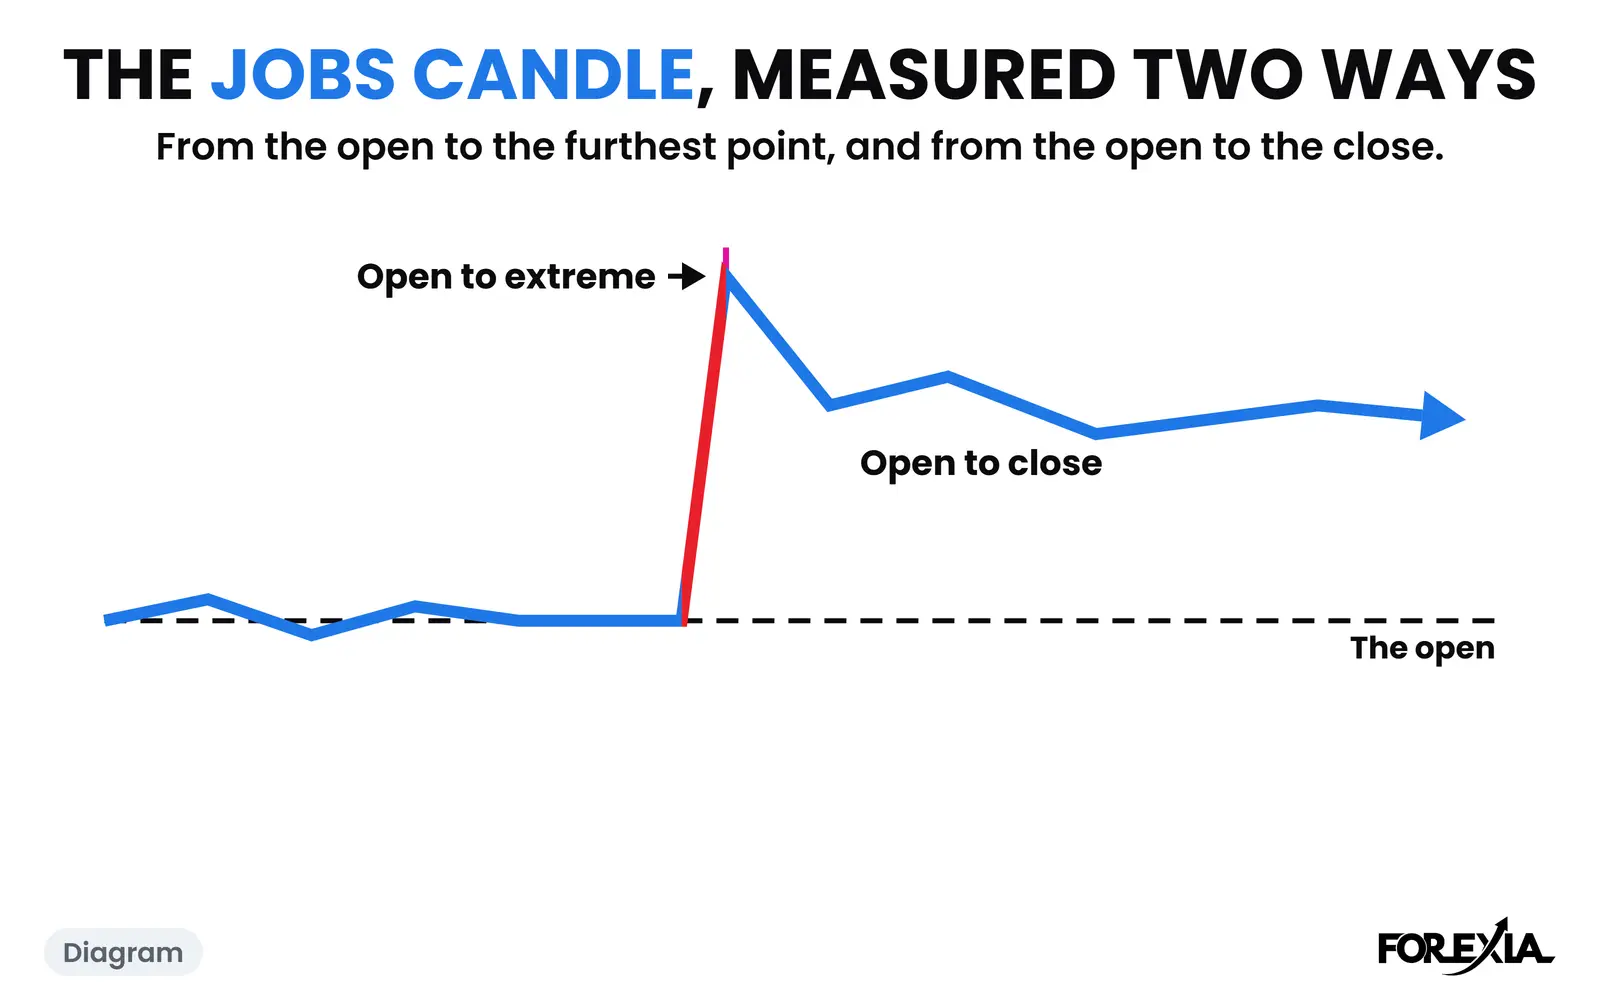
The average NFP move by pair, measured on five real jobs reports: EUR/USD 41 pips, GBP/USD 51, USD/JPY 74 and gold 62, open to extreme and open to close.
7 min read
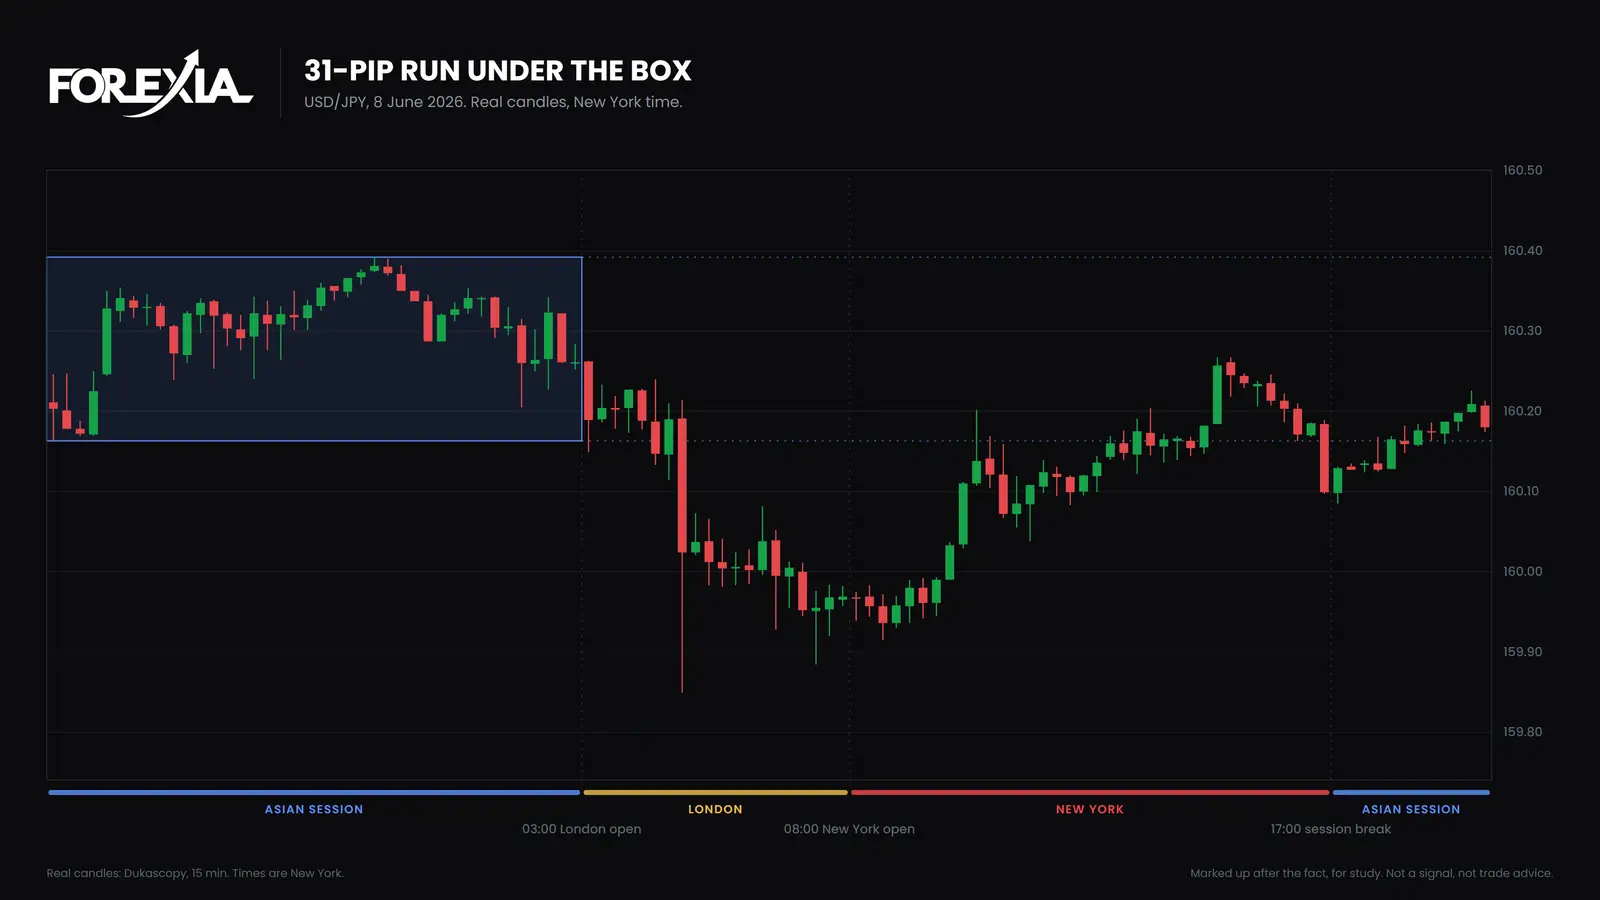
Is forex a scam? The market is real, much sold around it is not worth buying, and most retail accounts lose. What a regulator says and what we cannot show.
7 min read
The forex Sunday open is 17:00 New York. What a weekend gap is, how big it was on 26 Sundays across eight markets, and how often price came back. Real days
8 min read
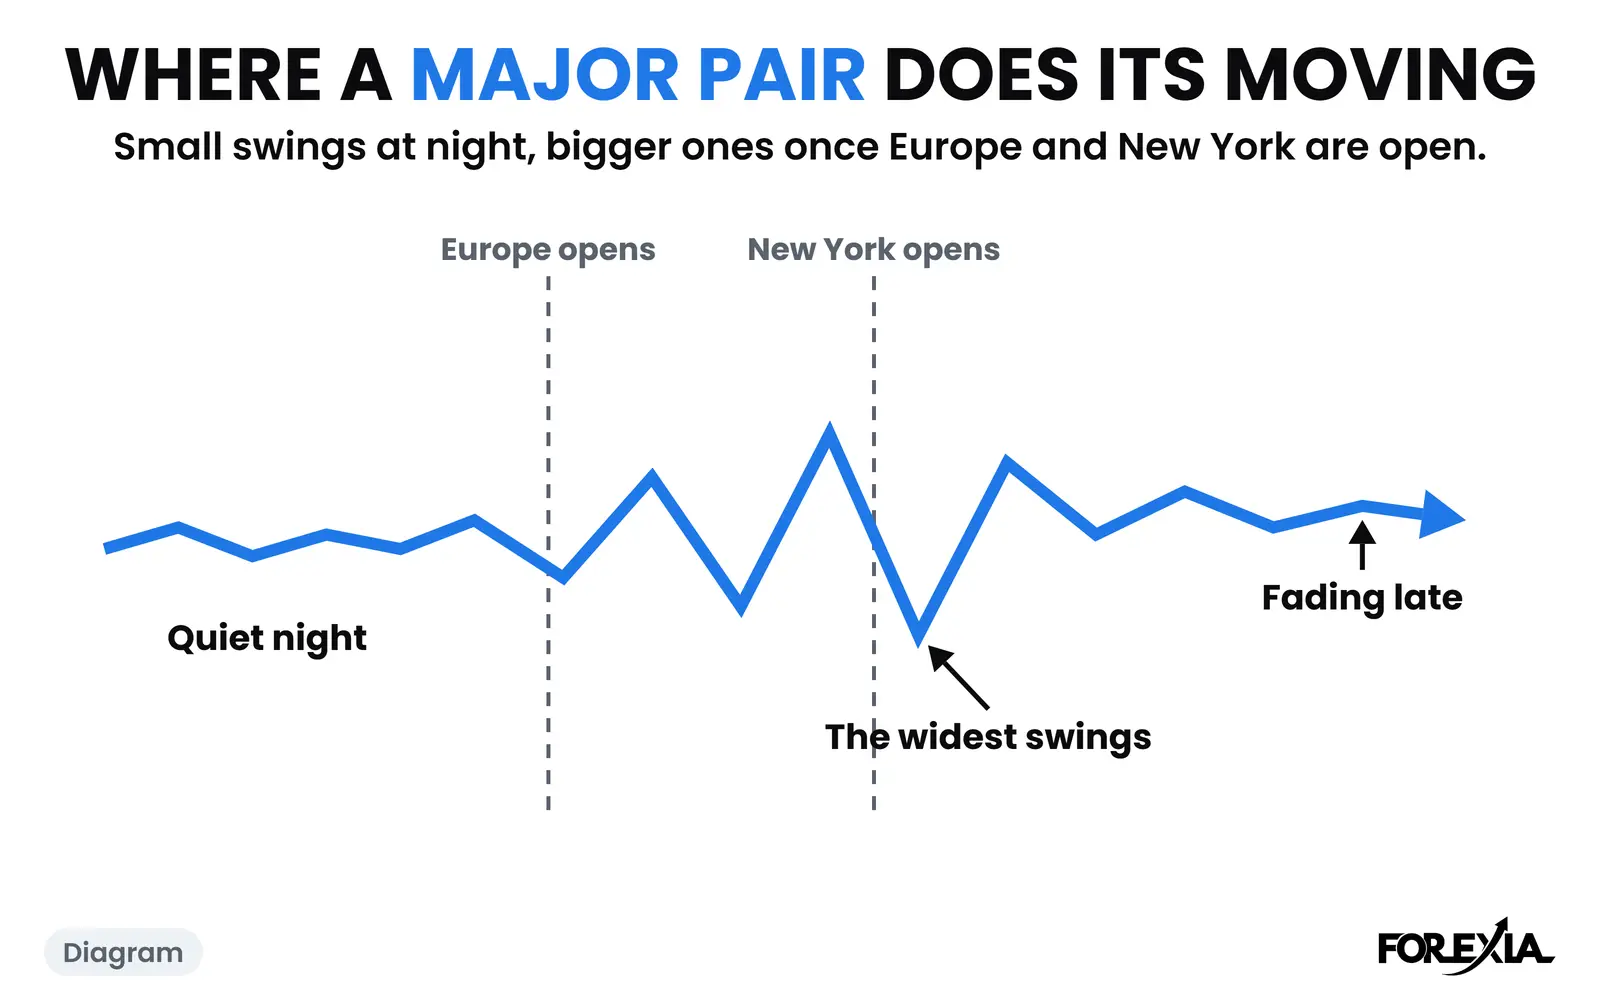
The best time to trade EUR/USD for movement is 08:00 to 11:00 New York. A median range for each hour on 129 market-days, and two real days. No signals.
7 min read
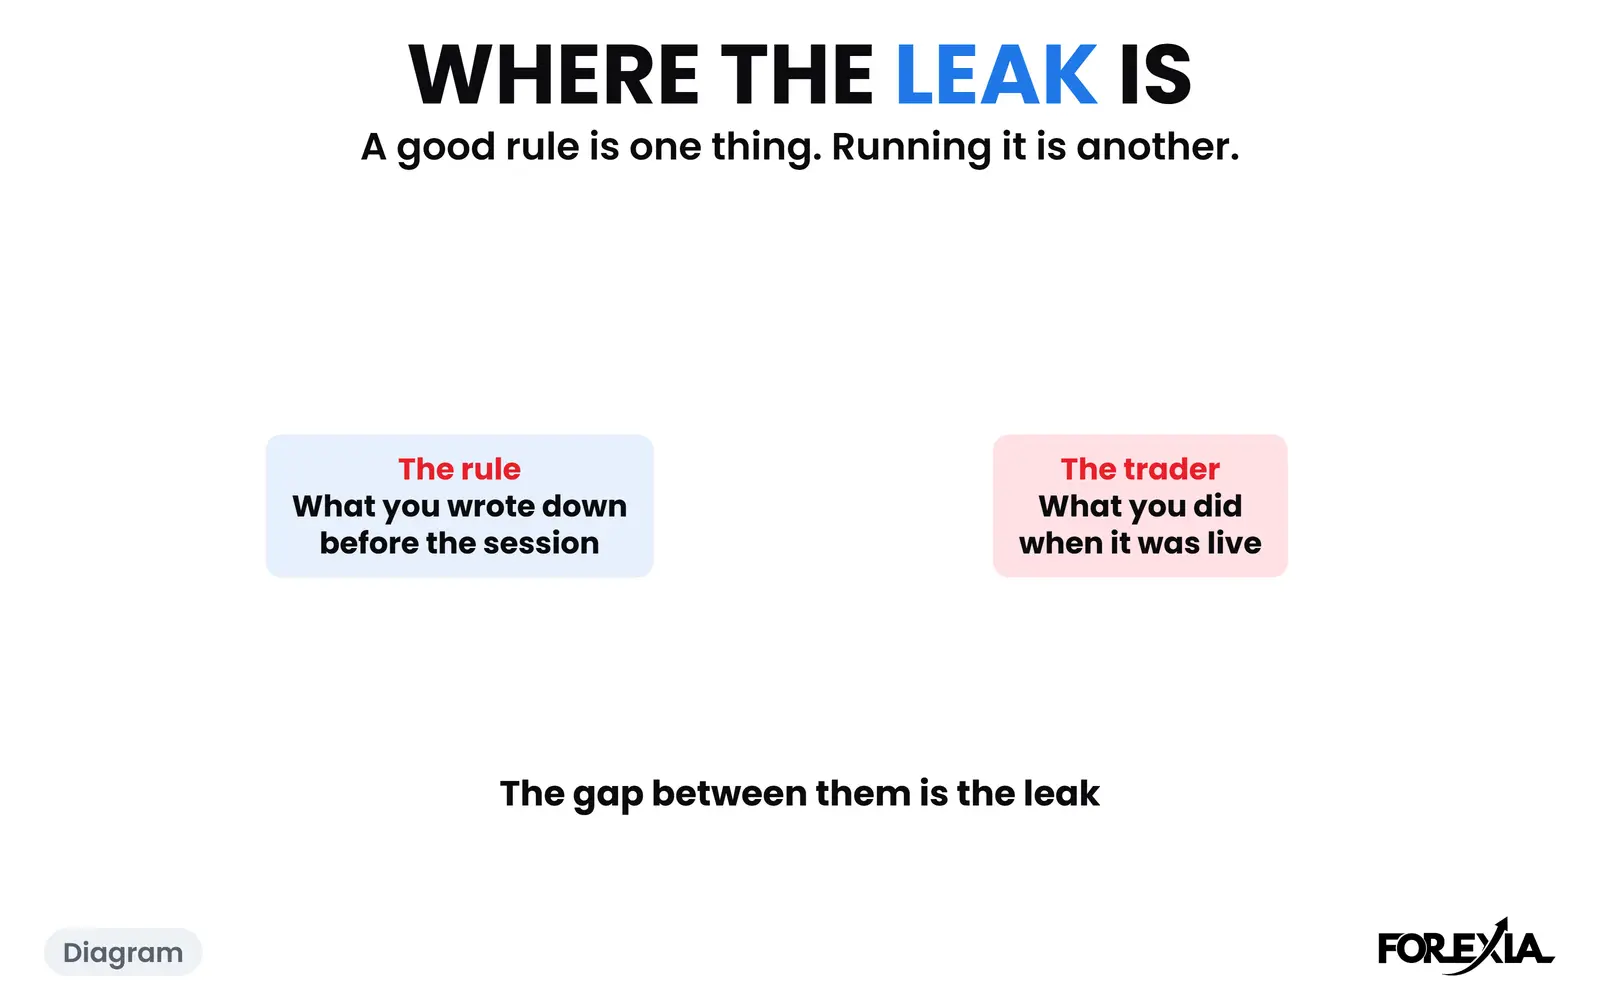
Why do you lose money in forex with a good strategy? The leak is usually between rule and trader, or the rule is not as good as it looks. Find yours.
6 min read
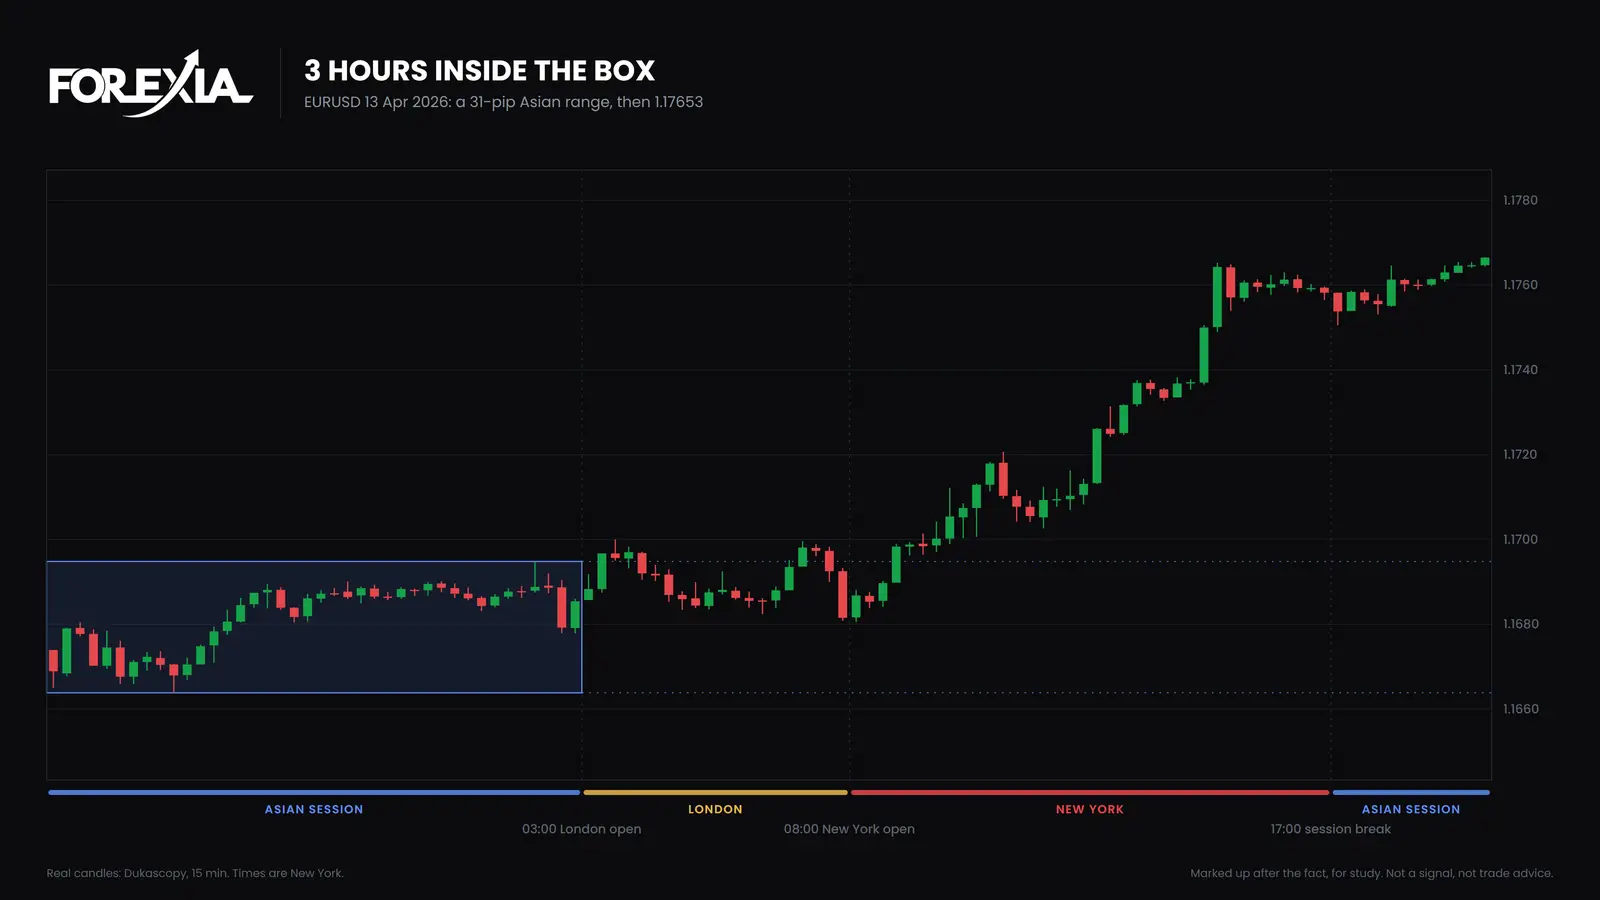
Is forex trading hard? Not to understand. It is hard to sit through, and most accounts lose. The honest reasons, with one real day and the research.
6 min read
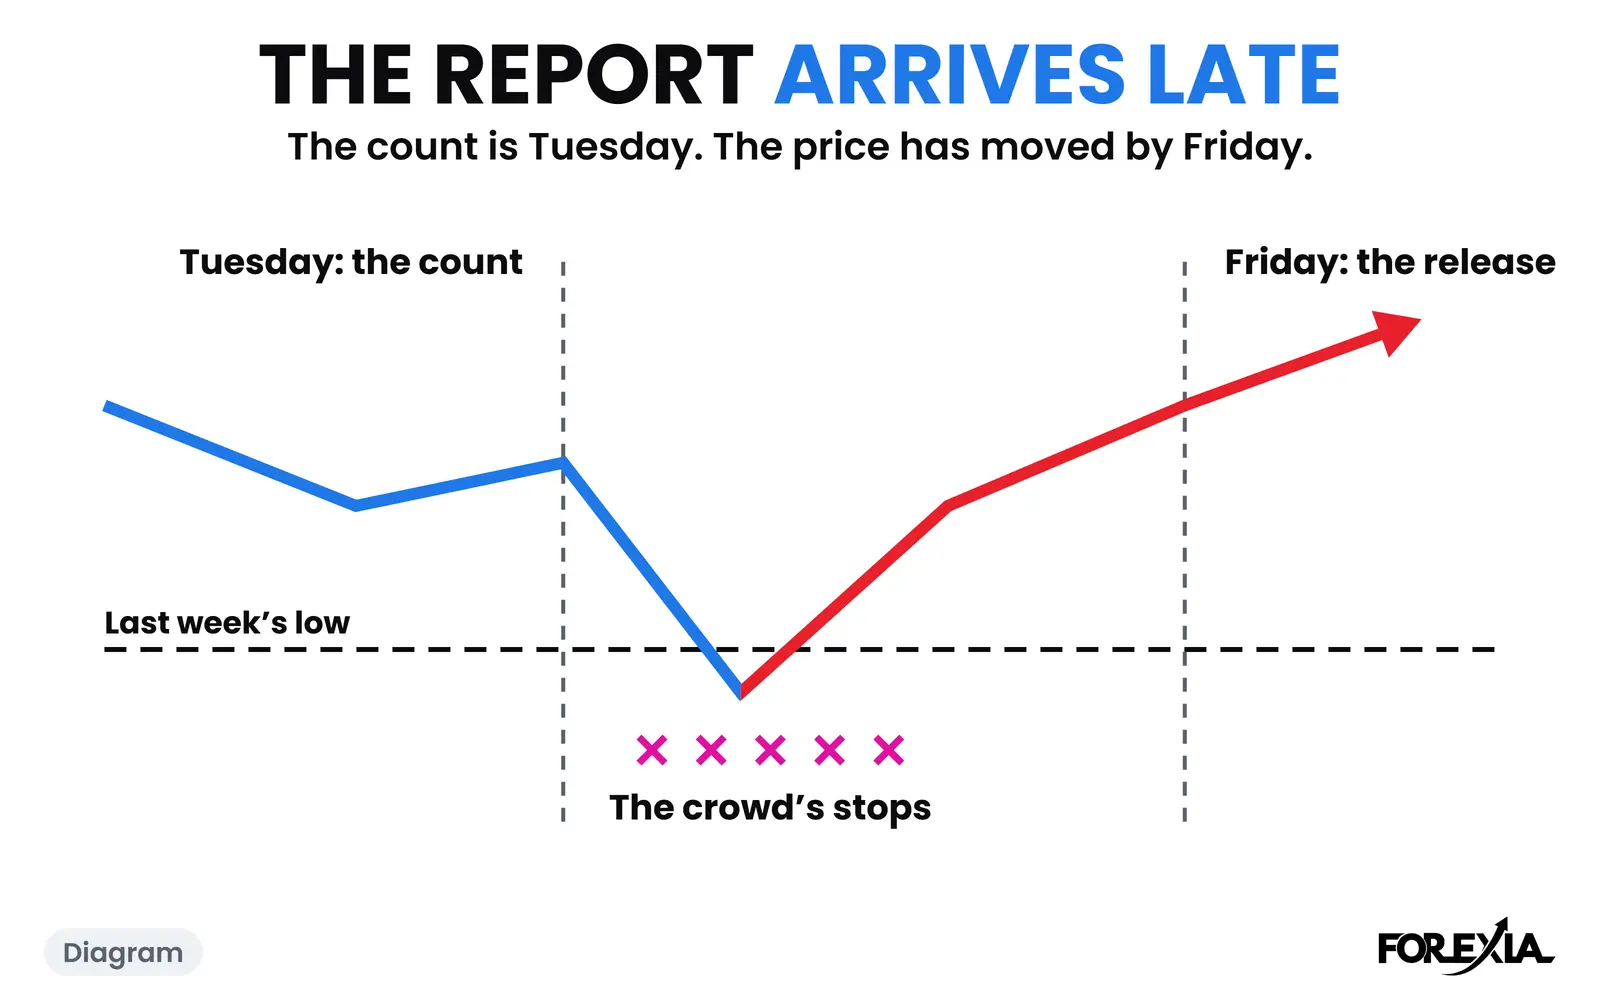
The COT report GBP counted 13 October 2026: the pound's crowd at index 0, who sat opposite, why the report came late, and what GBP/USD did next.
7 min read
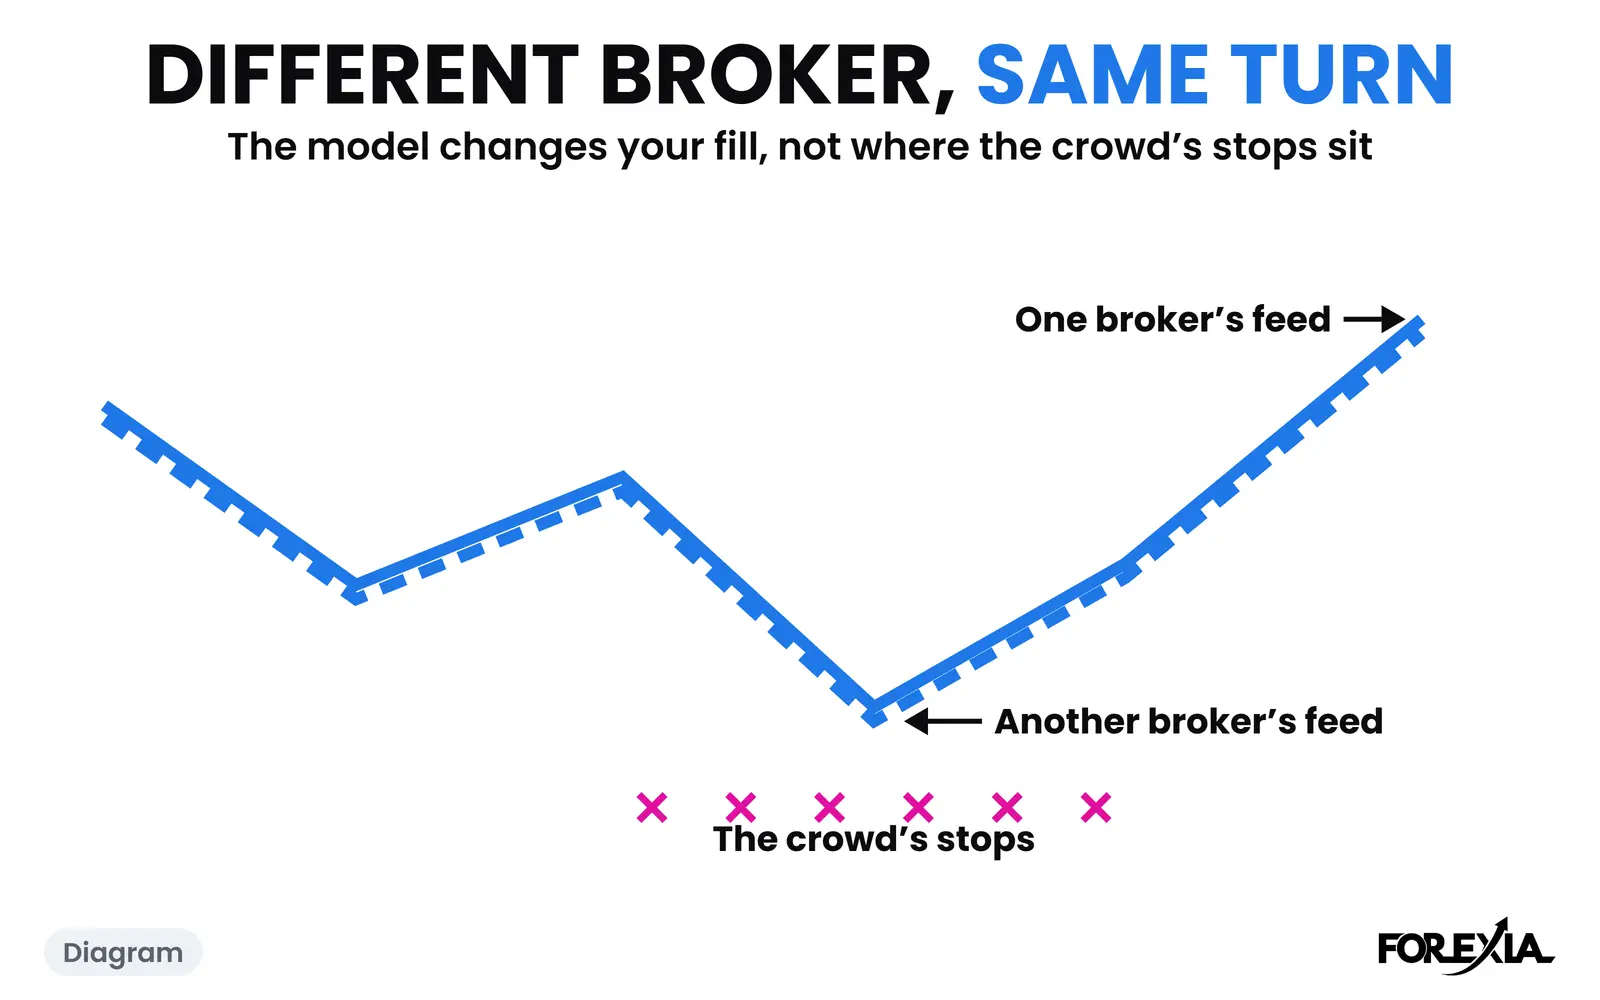
Market maker vs ECN broker: what each model does with your order, what it changes for your fill, and what none of them changes. One real dated gold day.
6 min read
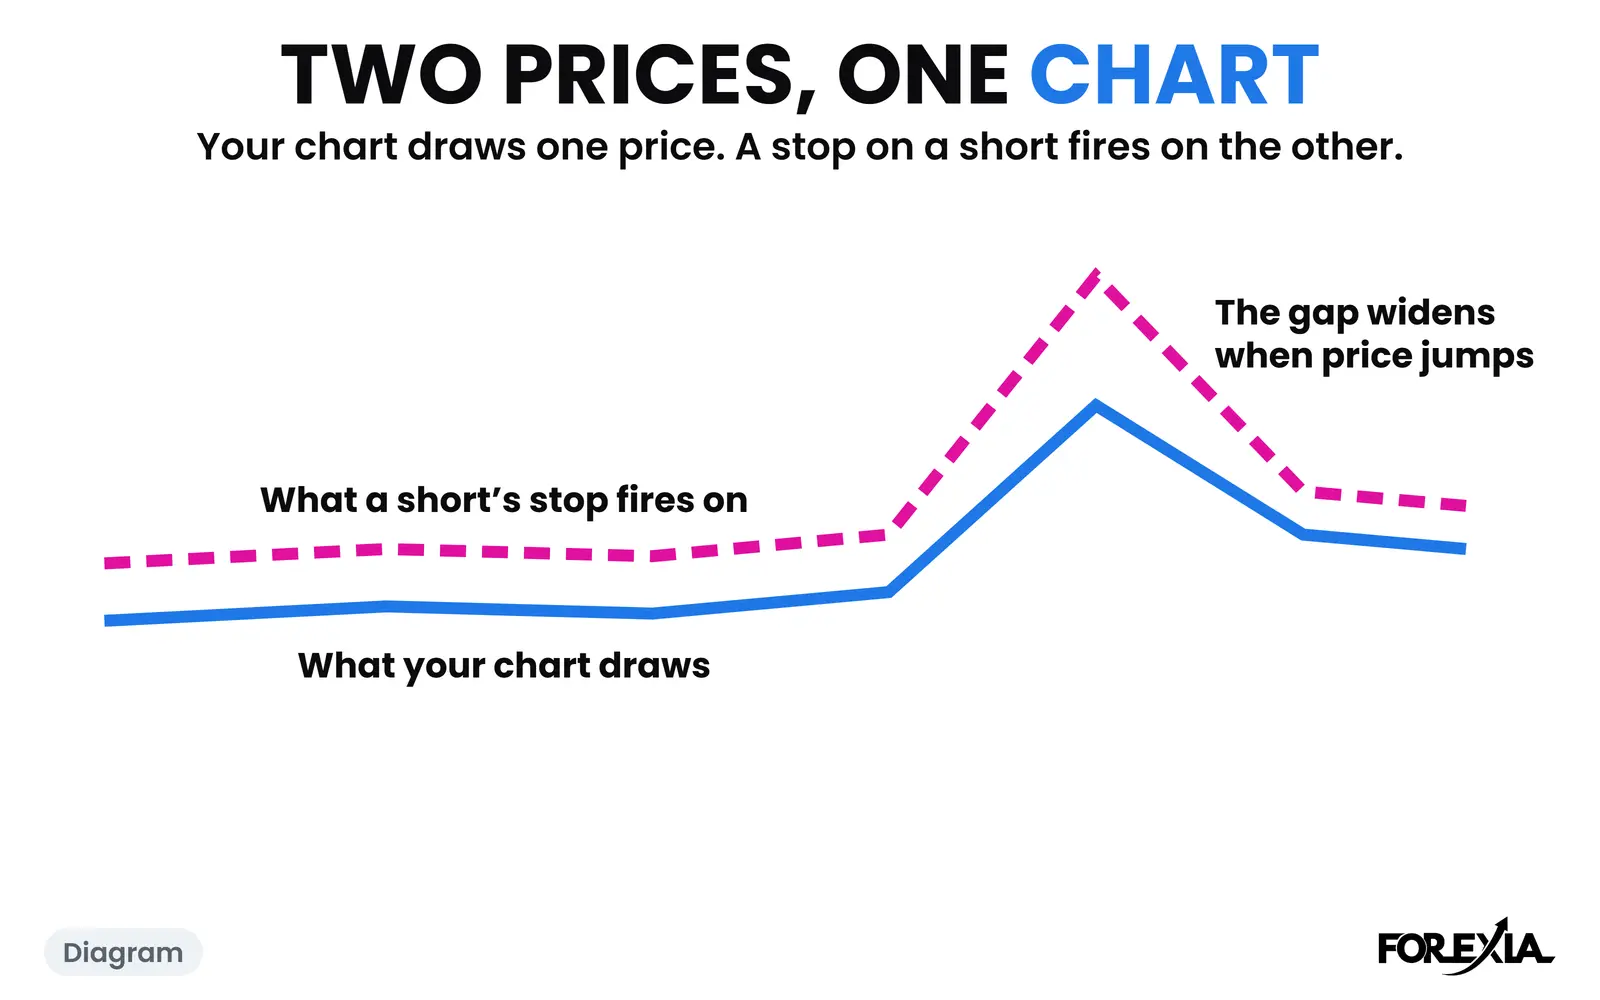
Do forex brokers hunt stop losses? What a broker can and cannot do, a five-step check of your own fills, and one real release candle where the ask ran off.
8 min read
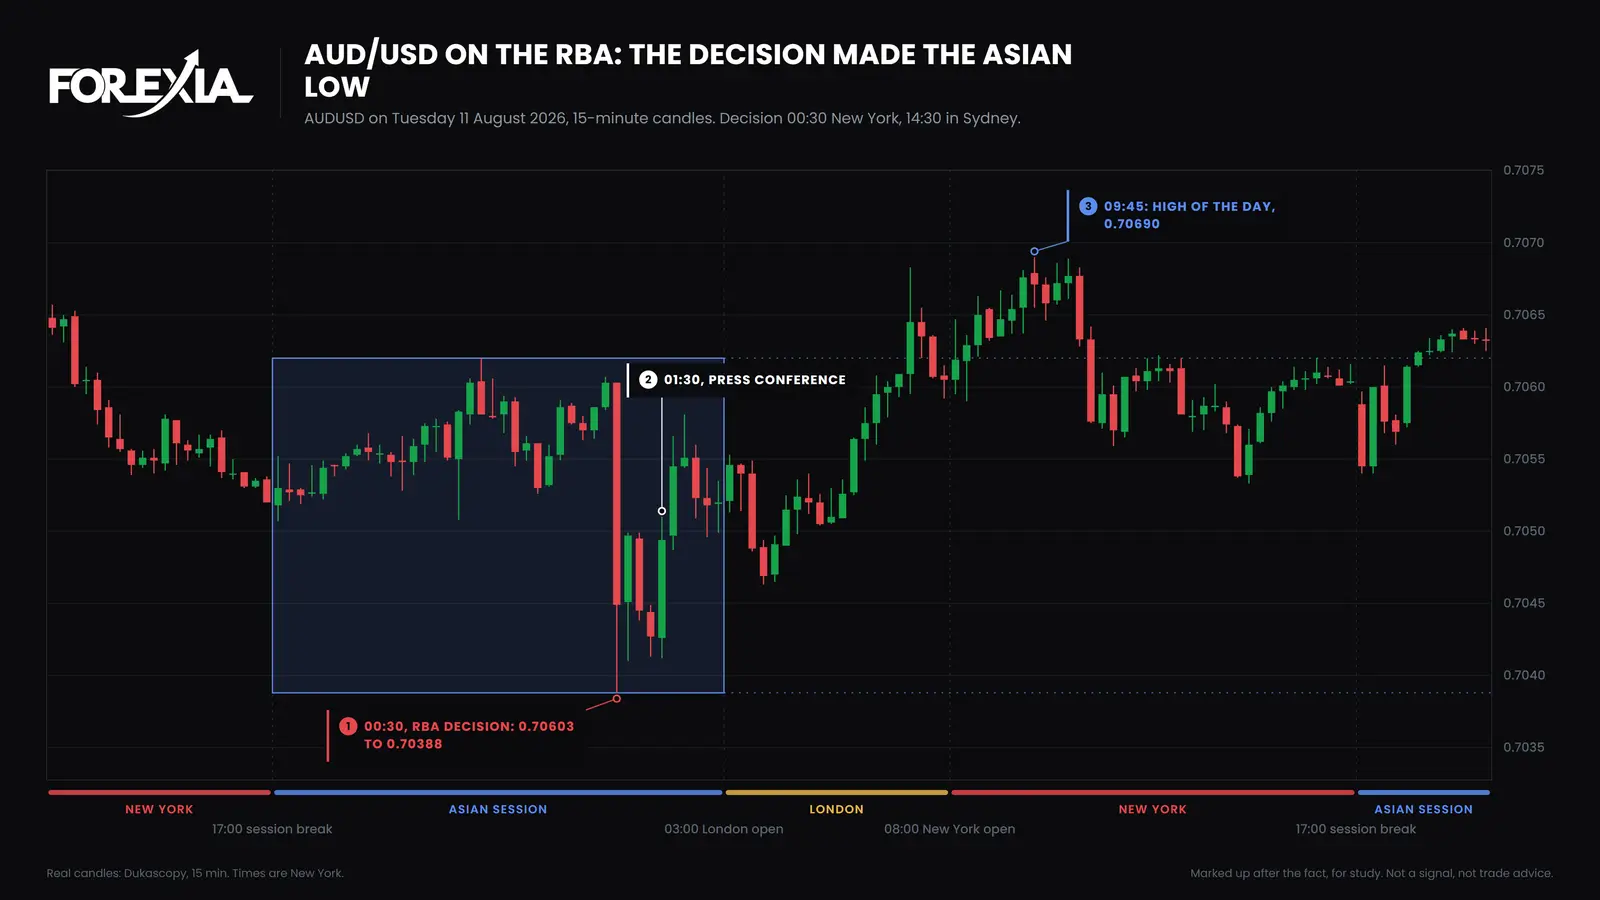
RBA rate decision forex on four real days: a 6 to 22 pip AUD/USD candle at 00:30 New York, and on 11 August 2026 the decision made the Asian low.
6 min read
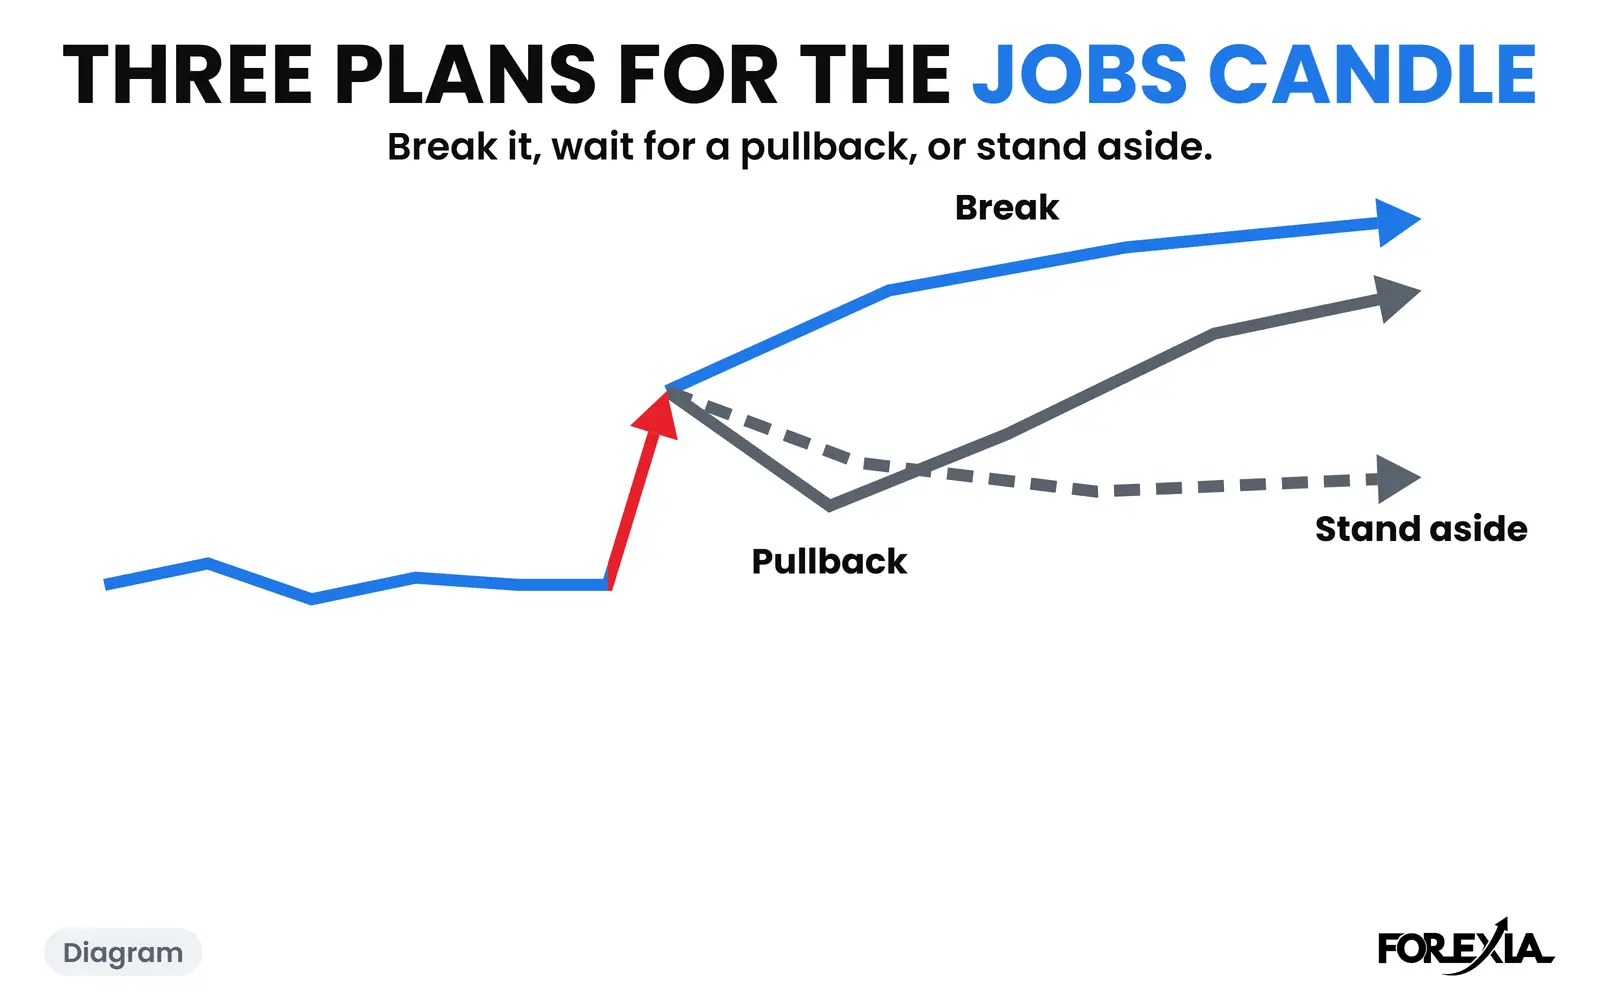
NFP breakout vs pullback, counted on 40 market-mornings: price broke the jobs candle extreme on 27 and came back to its middle on 23. Limits stated.
7 min read
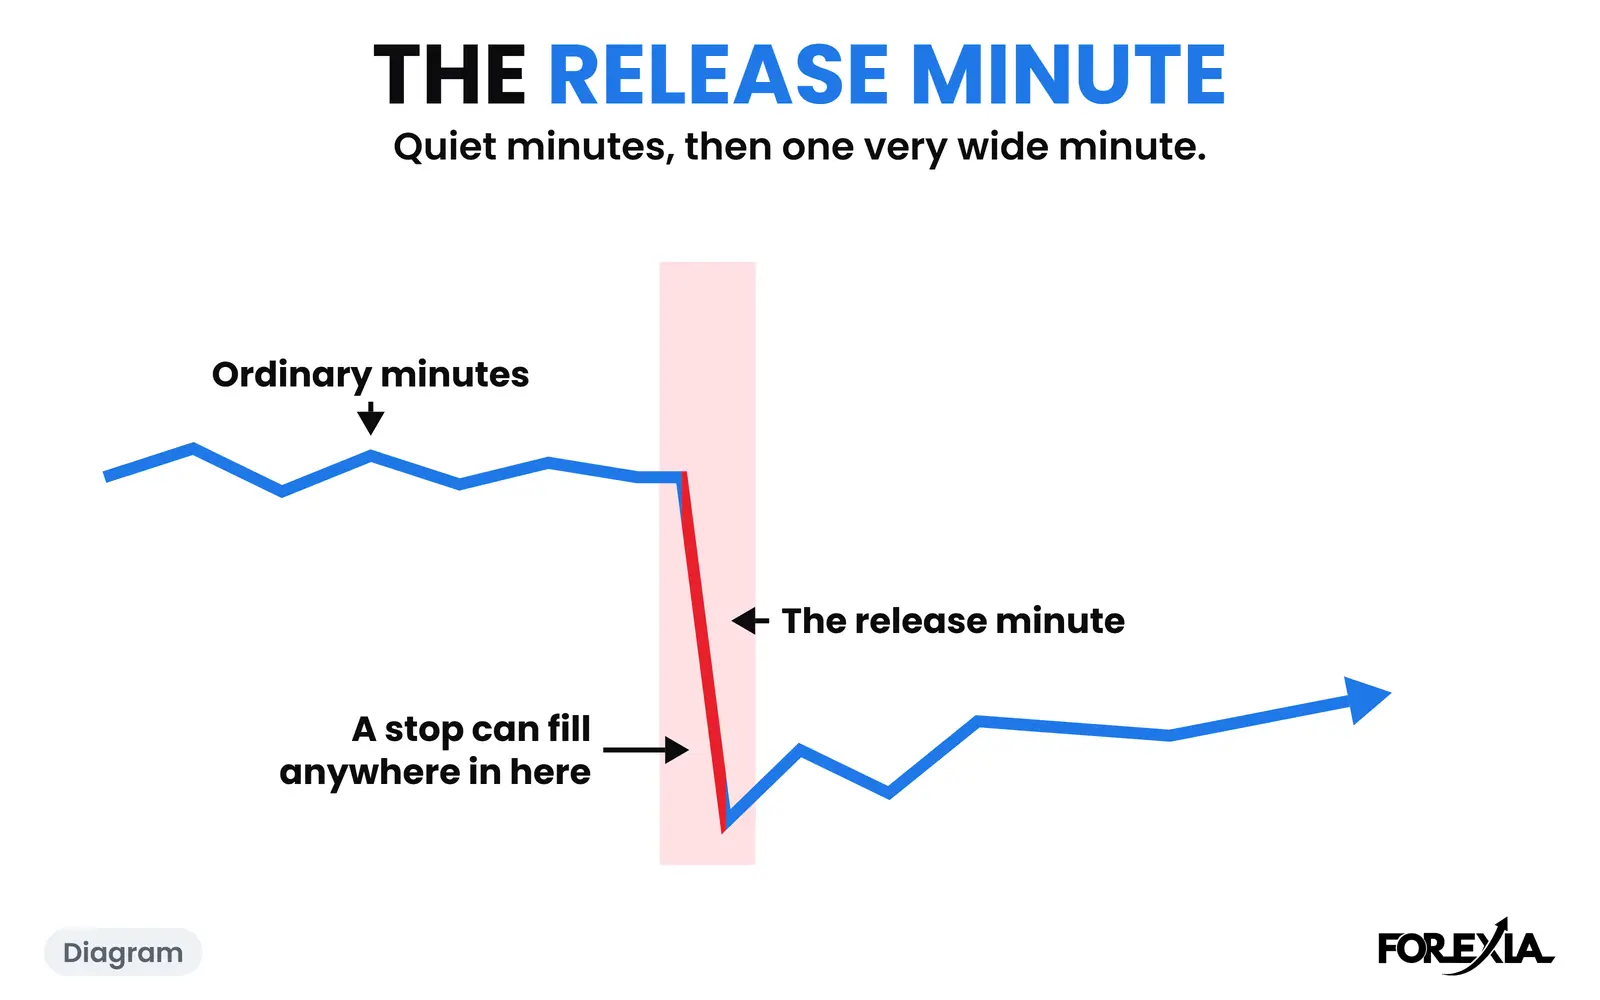
NFP spread widening cannot be seen on a bid-only chart, but the release minute can be measured: 11 to 34 times an ordinary minute on EUR/USD, five Fridays.
7 min read
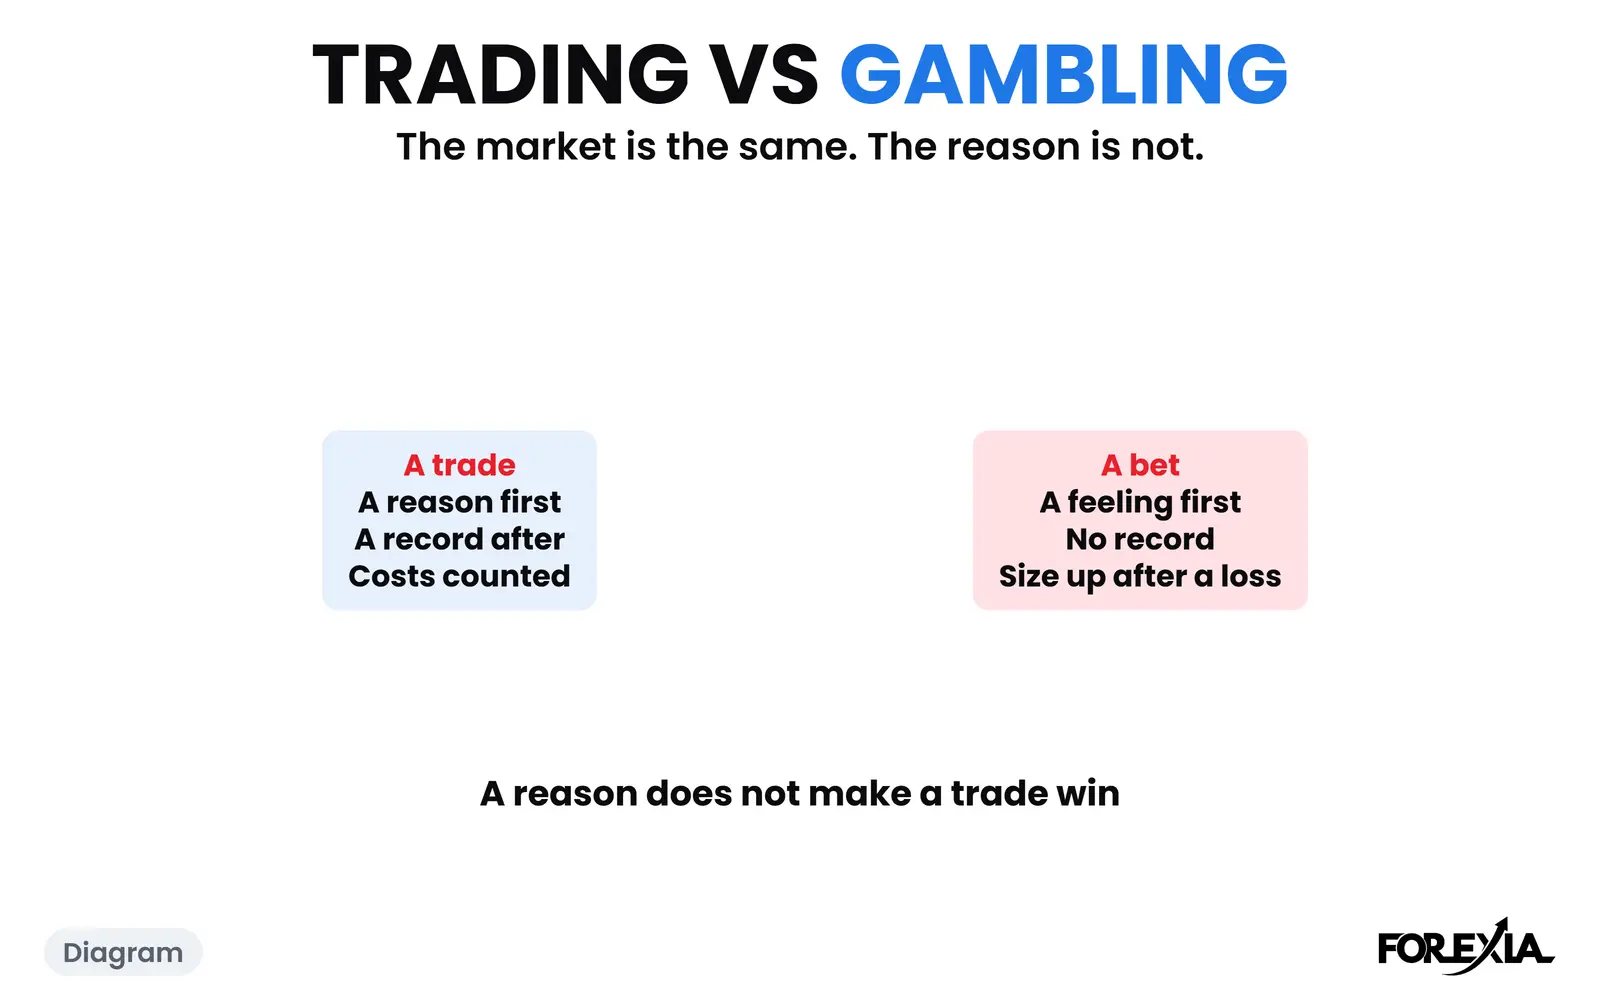
Forex trading vs gambling: the market is real, but a trade can still be a bet. Four questions for your last ten trades, and two real days that show why.
7 min read
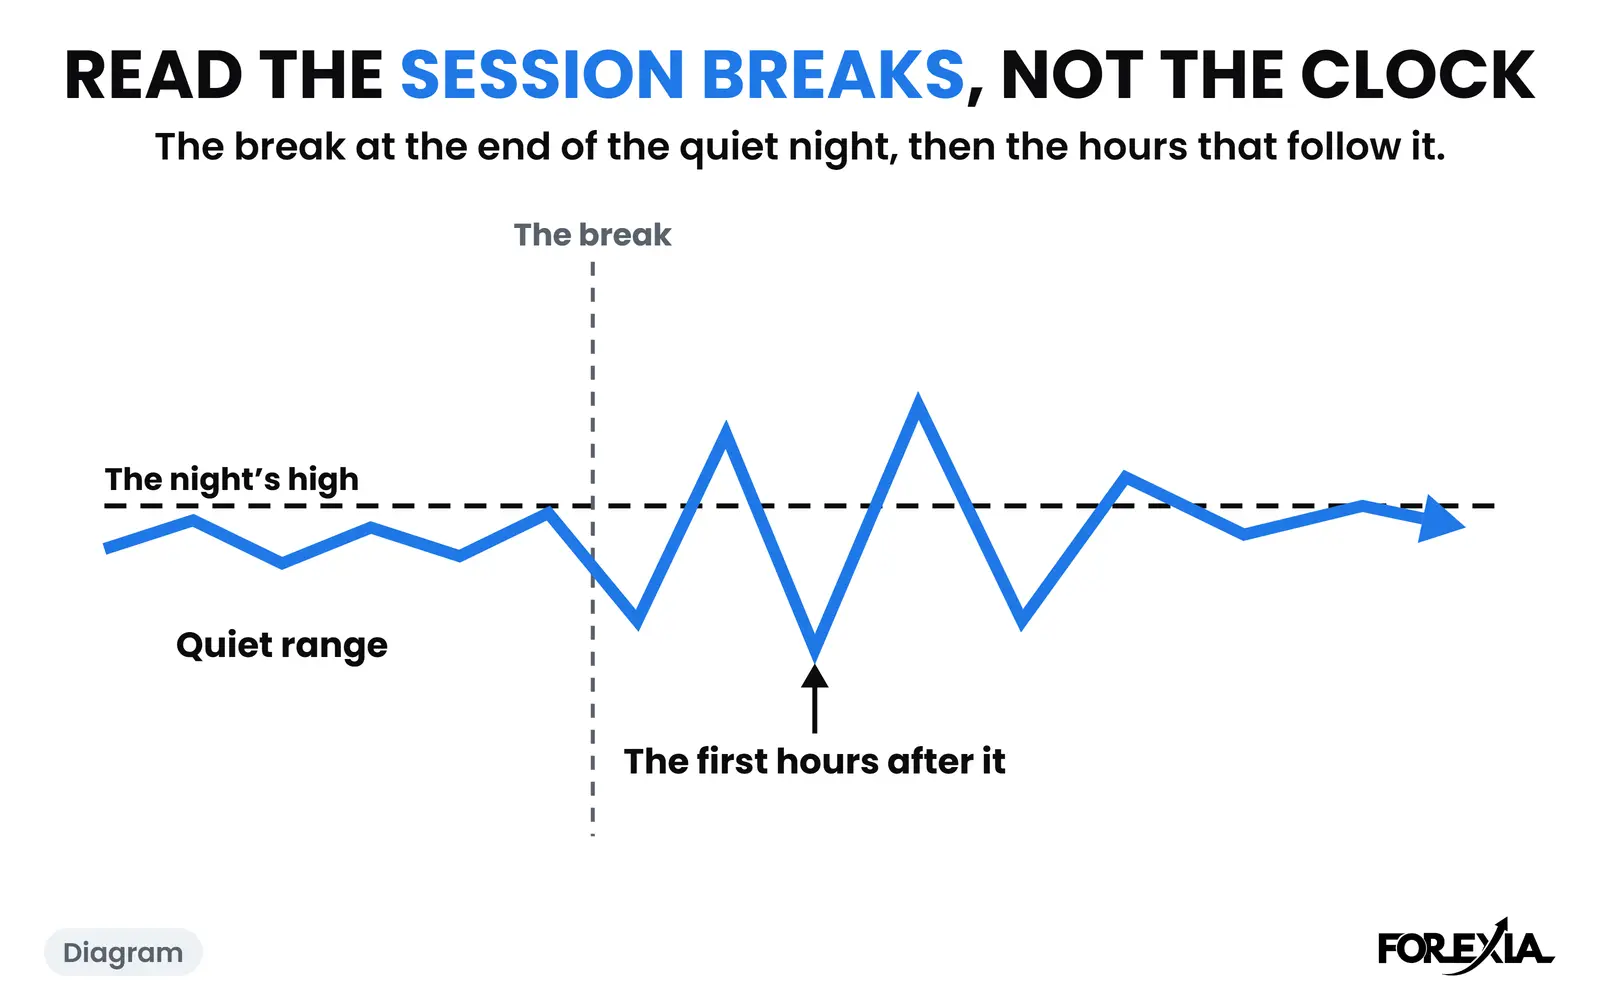
The best time to trade GBP/USD for movement is 08:00 to 11:00 New York, with London's open close behind. Median range per hour, two real days. No signals.
7 min read
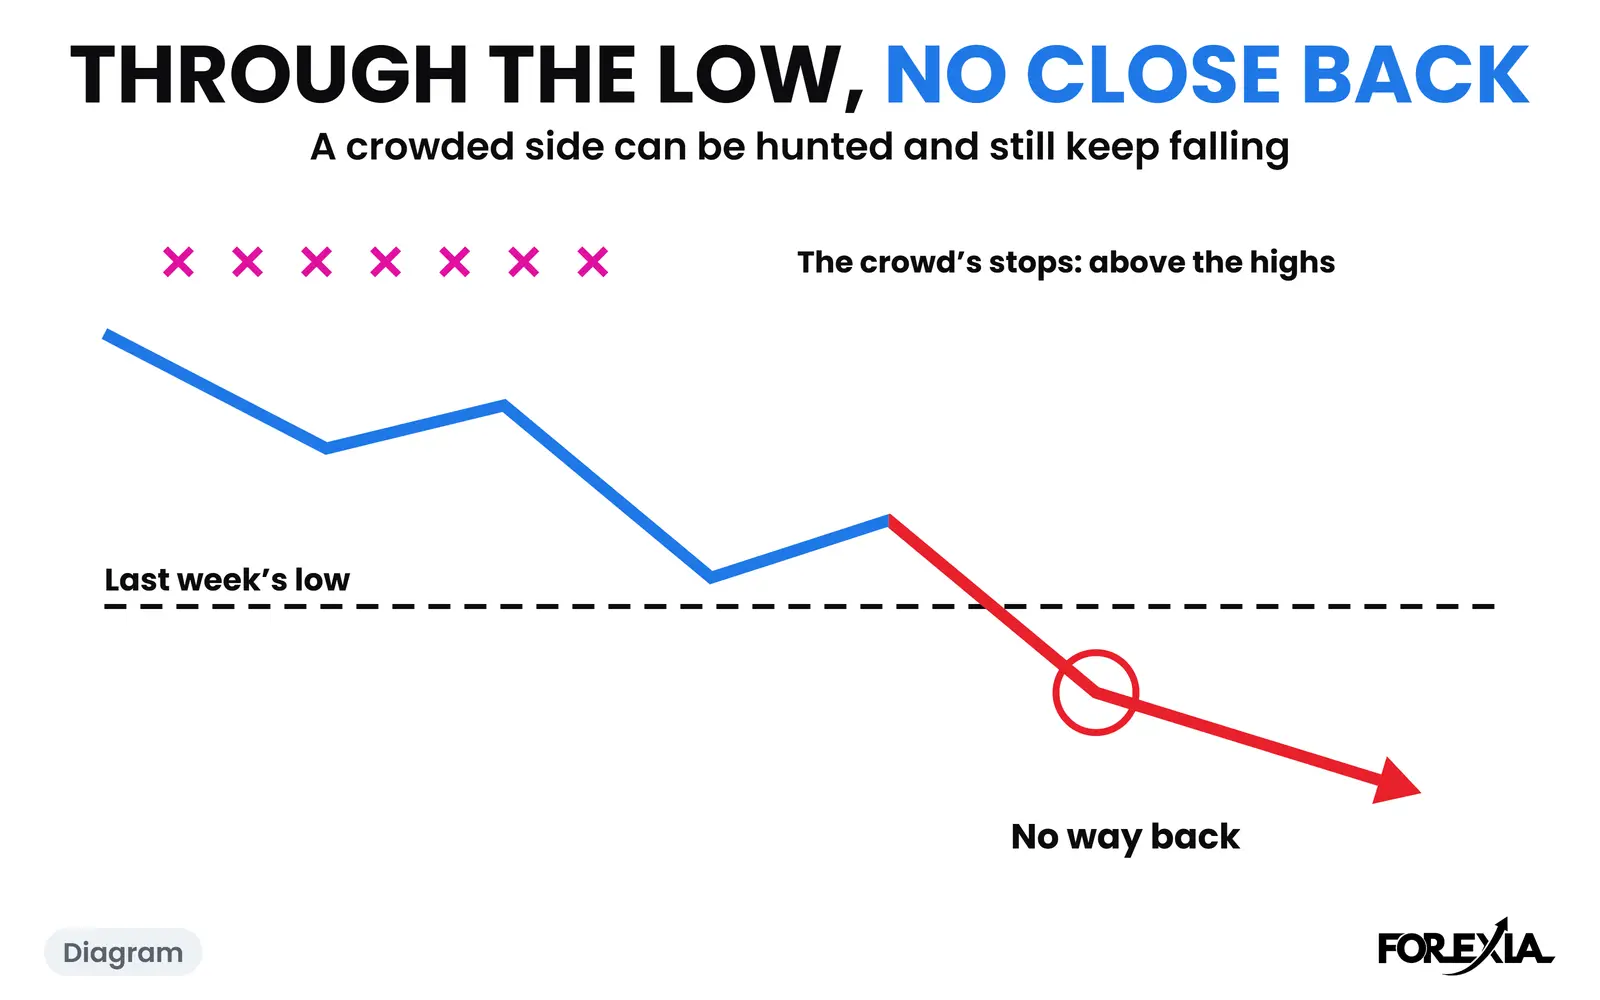
The COT report AUD counted 27 October 2026: the Australian dollar's crowd at index 16, who sat opposite, the low it lost, and what AUD/USD did next.
7 min read
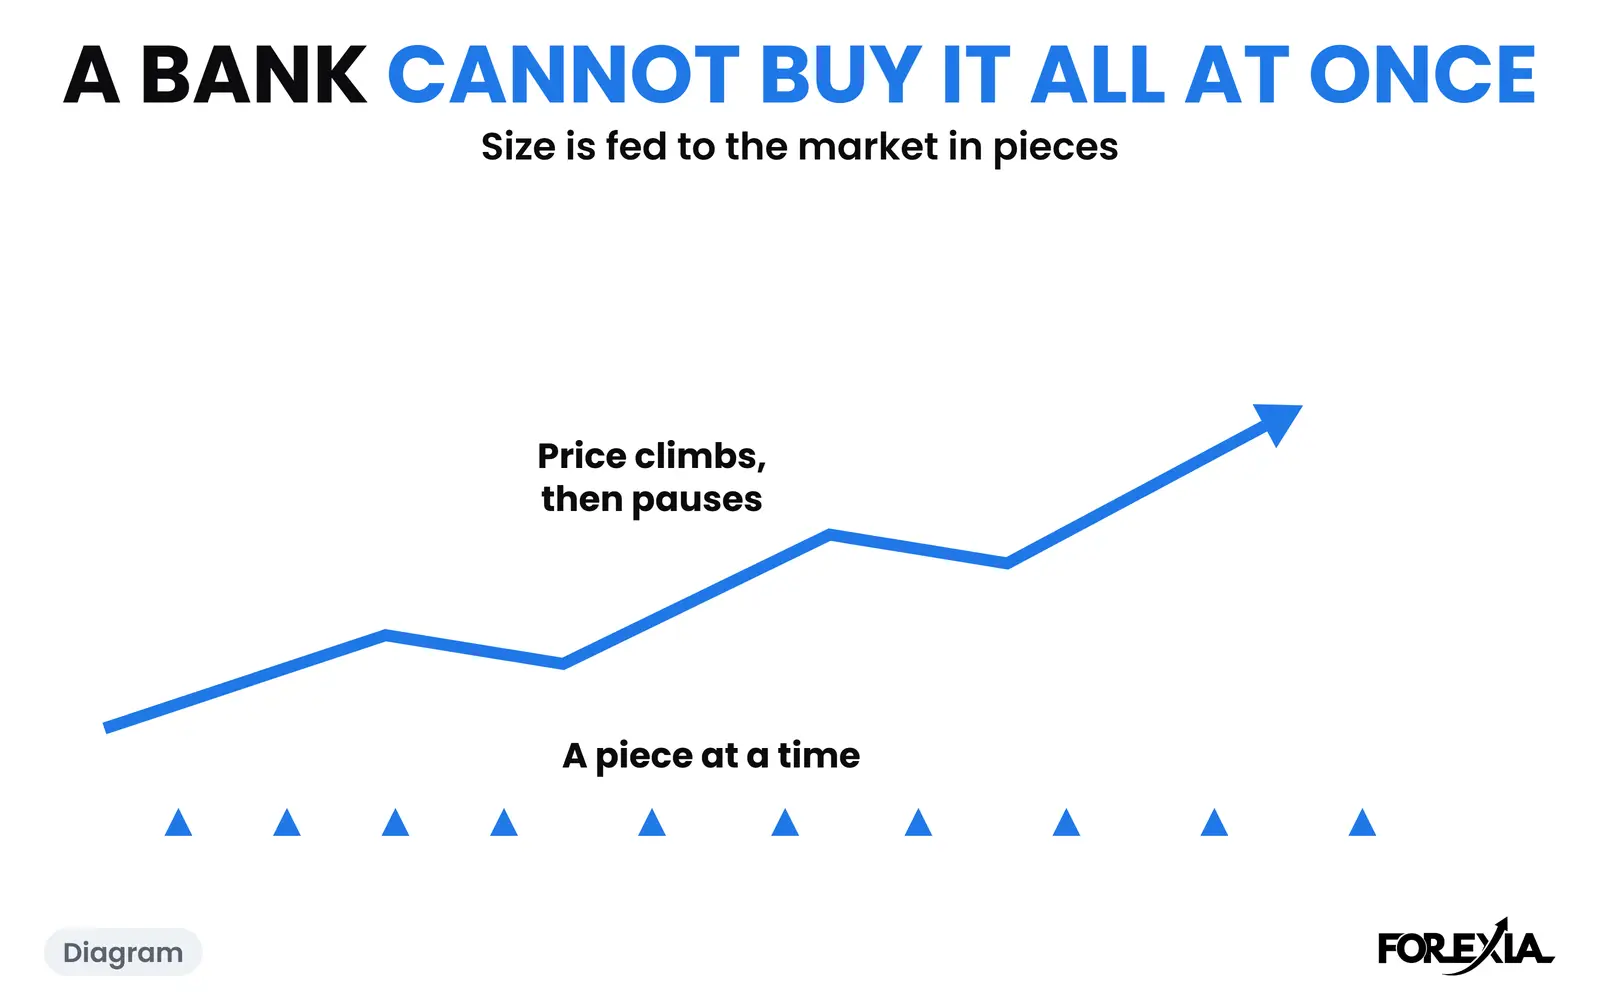
How do banks trade forex? Mostly for clients, in size, with their own books first. What that means for your chart, with BIS figures and one real dated day.
6 min read
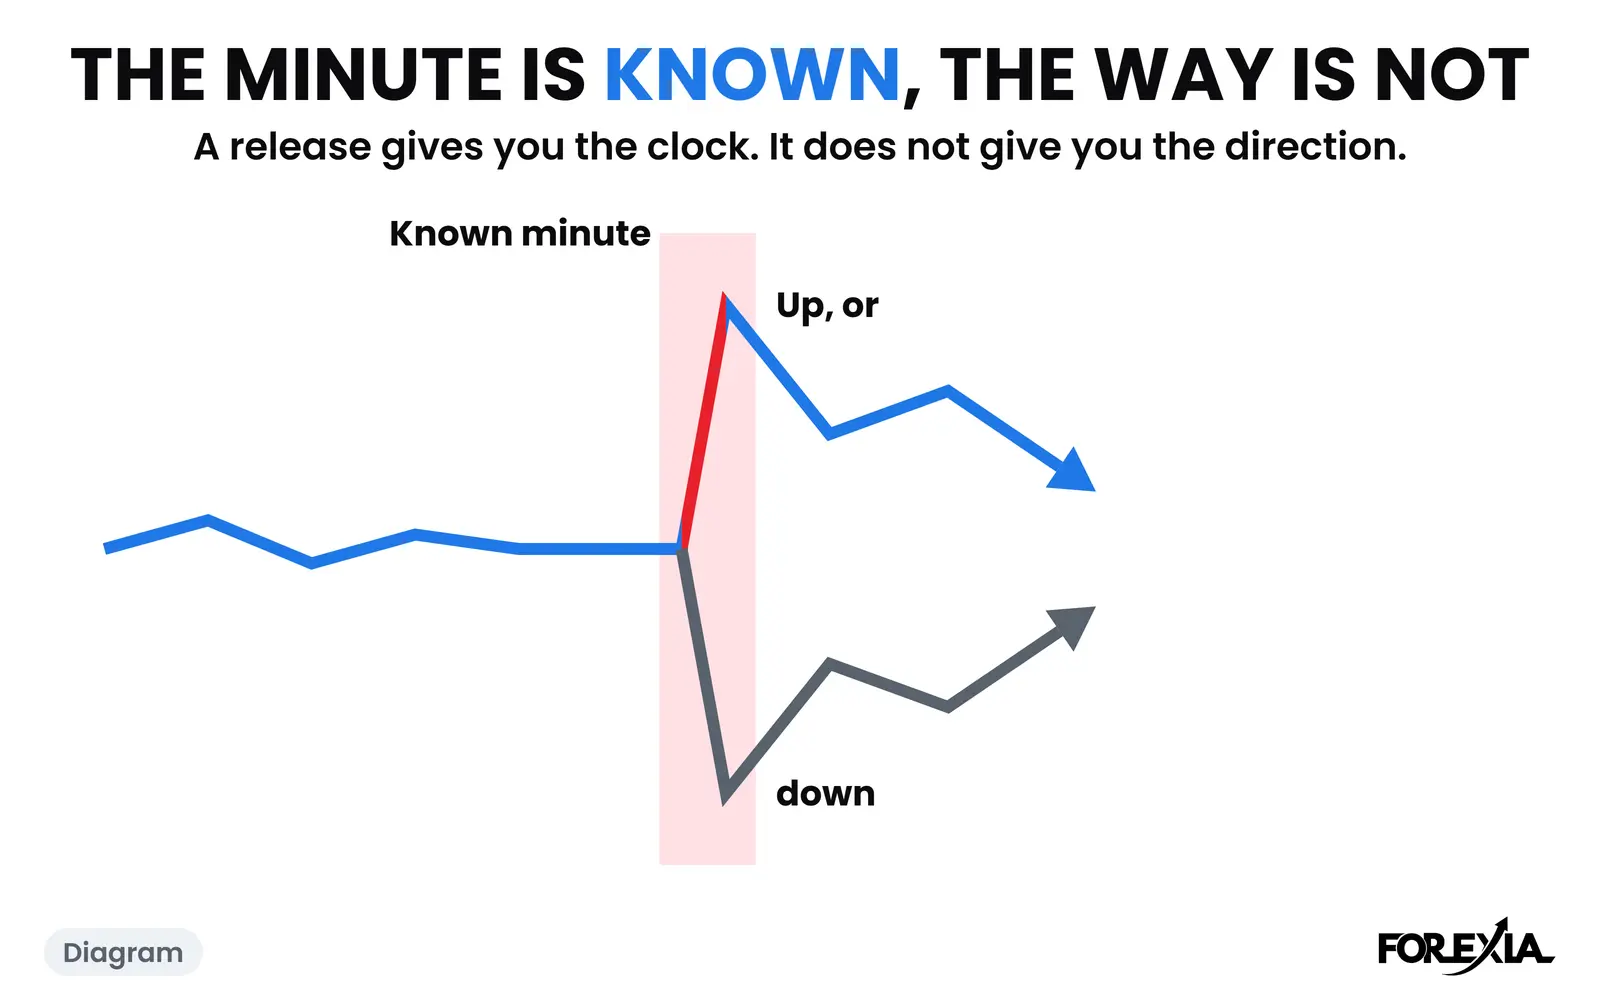
Should you trade the news? For most traders, not the release minute: it runs 6 to 10 times an ordinary candle, and our own test lost. Real dated days.
7 min read
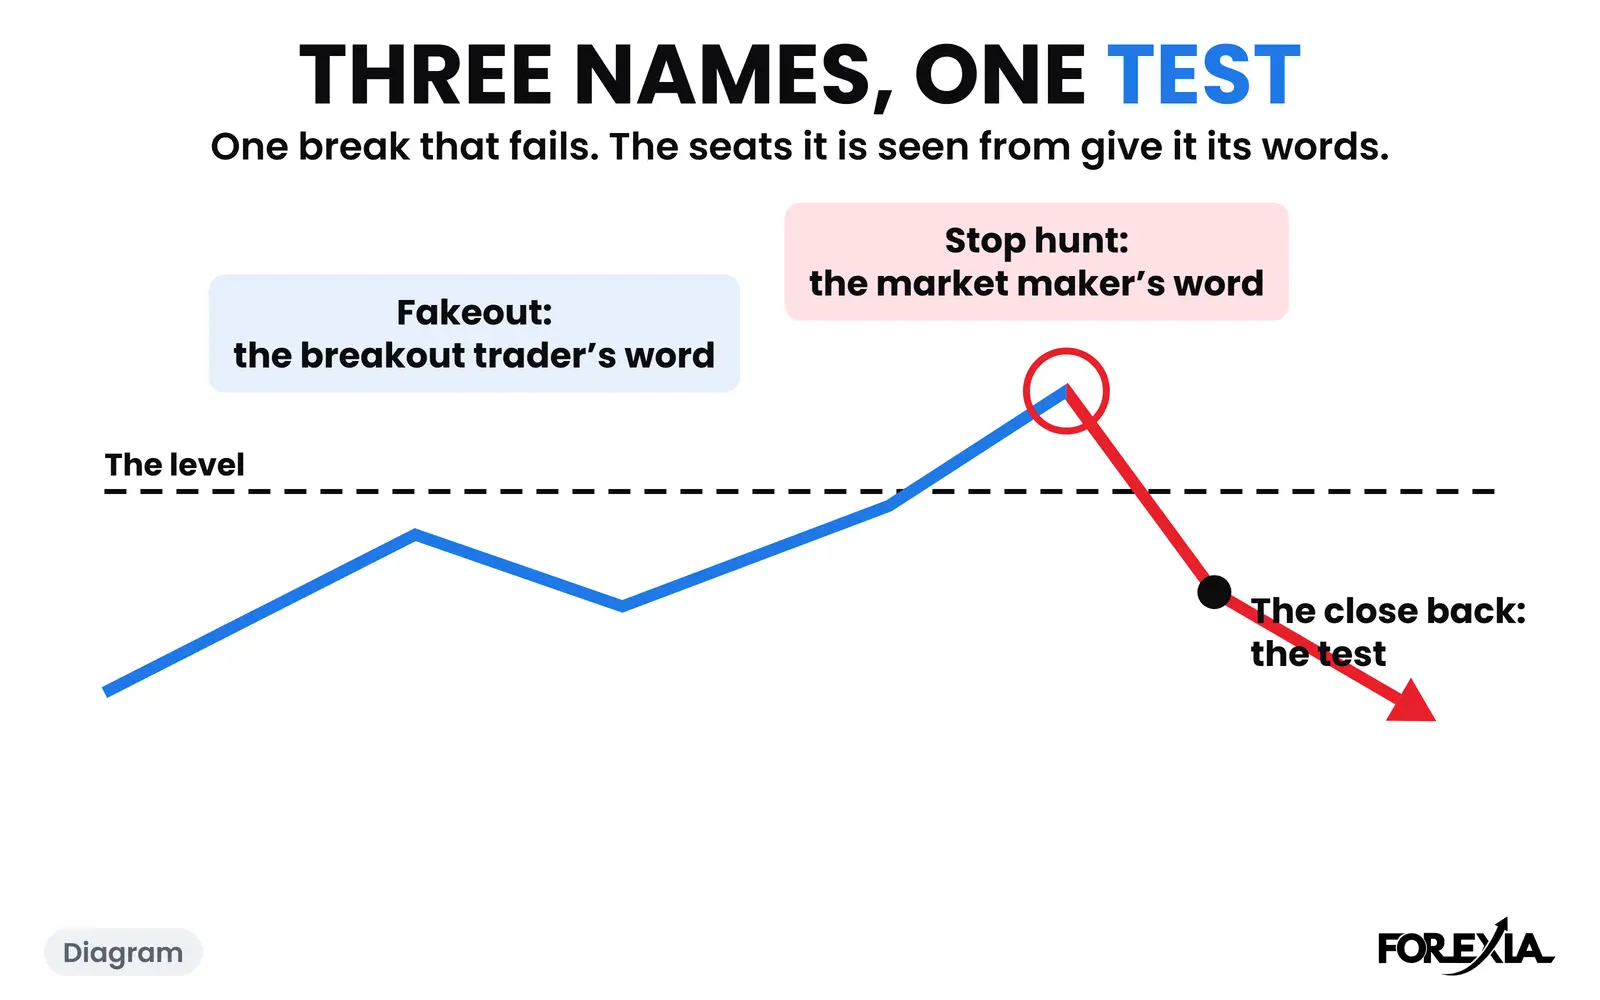
Stop hunt vs fakeout vs false breakout: three words for a break that fails and one test, the close back. Two real GBP/USD days and a count of 1,601.
8 min read
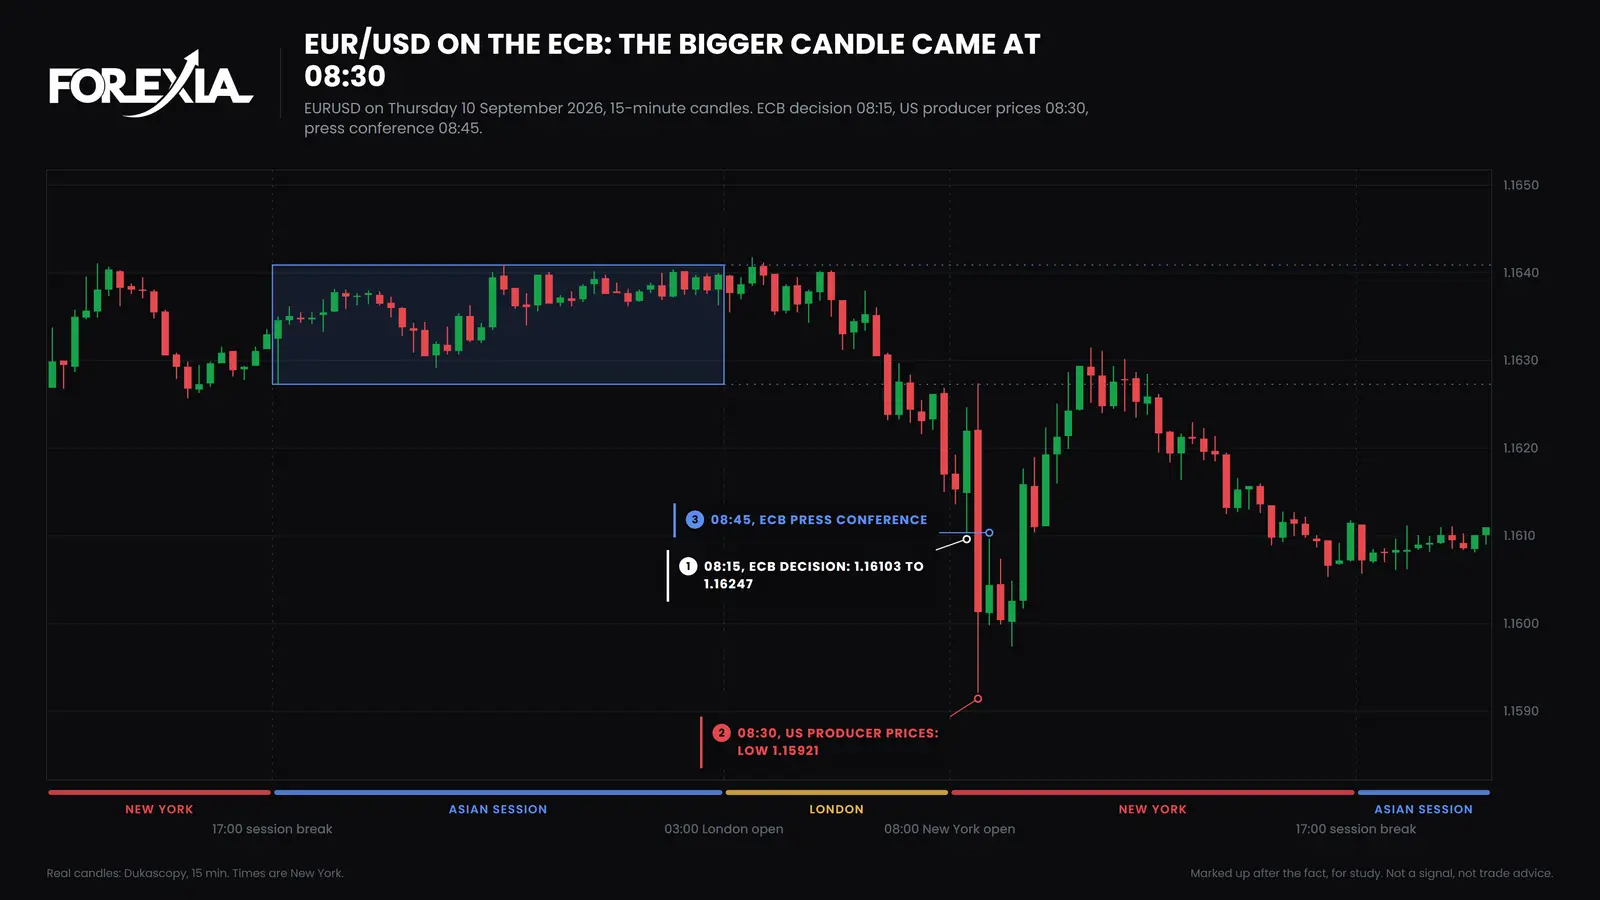
ECB rate decision forex on four real days: a 14 to 23 pip EUR/USD candle at 08:15, and on 10 September 2026 a bigger one 15 minutes later from US data.
6 min read
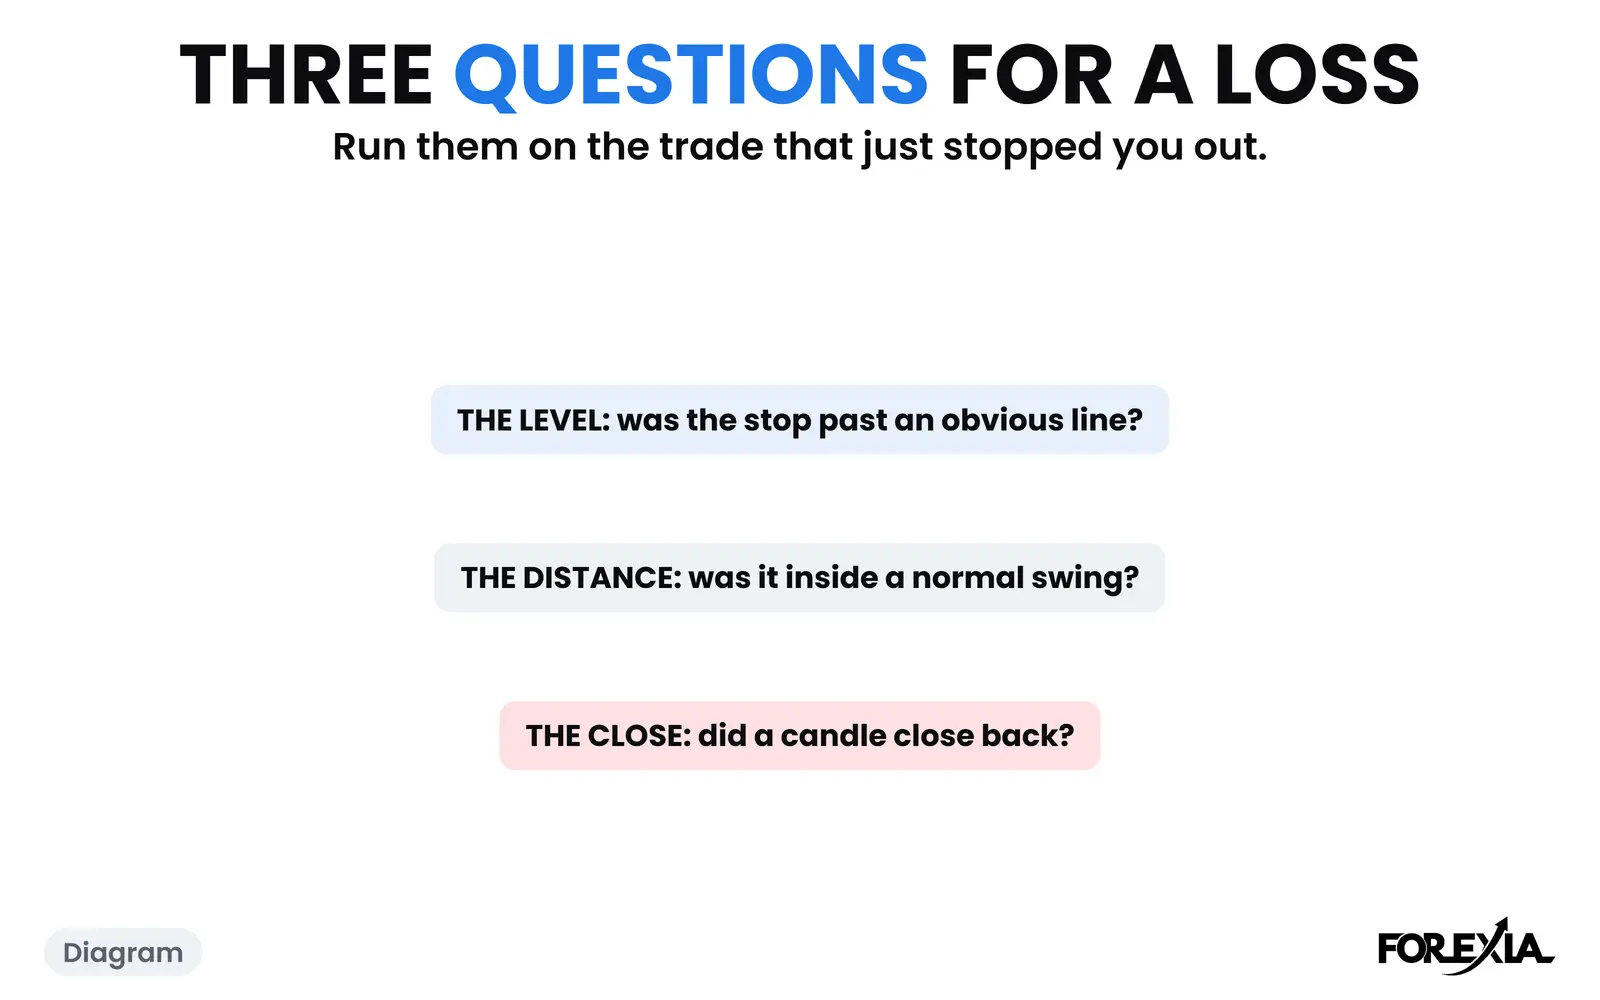
Stop too tight or stop hunt? Three checks for any losing trade: the level, the distance and the close. Two real GBP/USD days, one hunted, one a real break.
8 min read
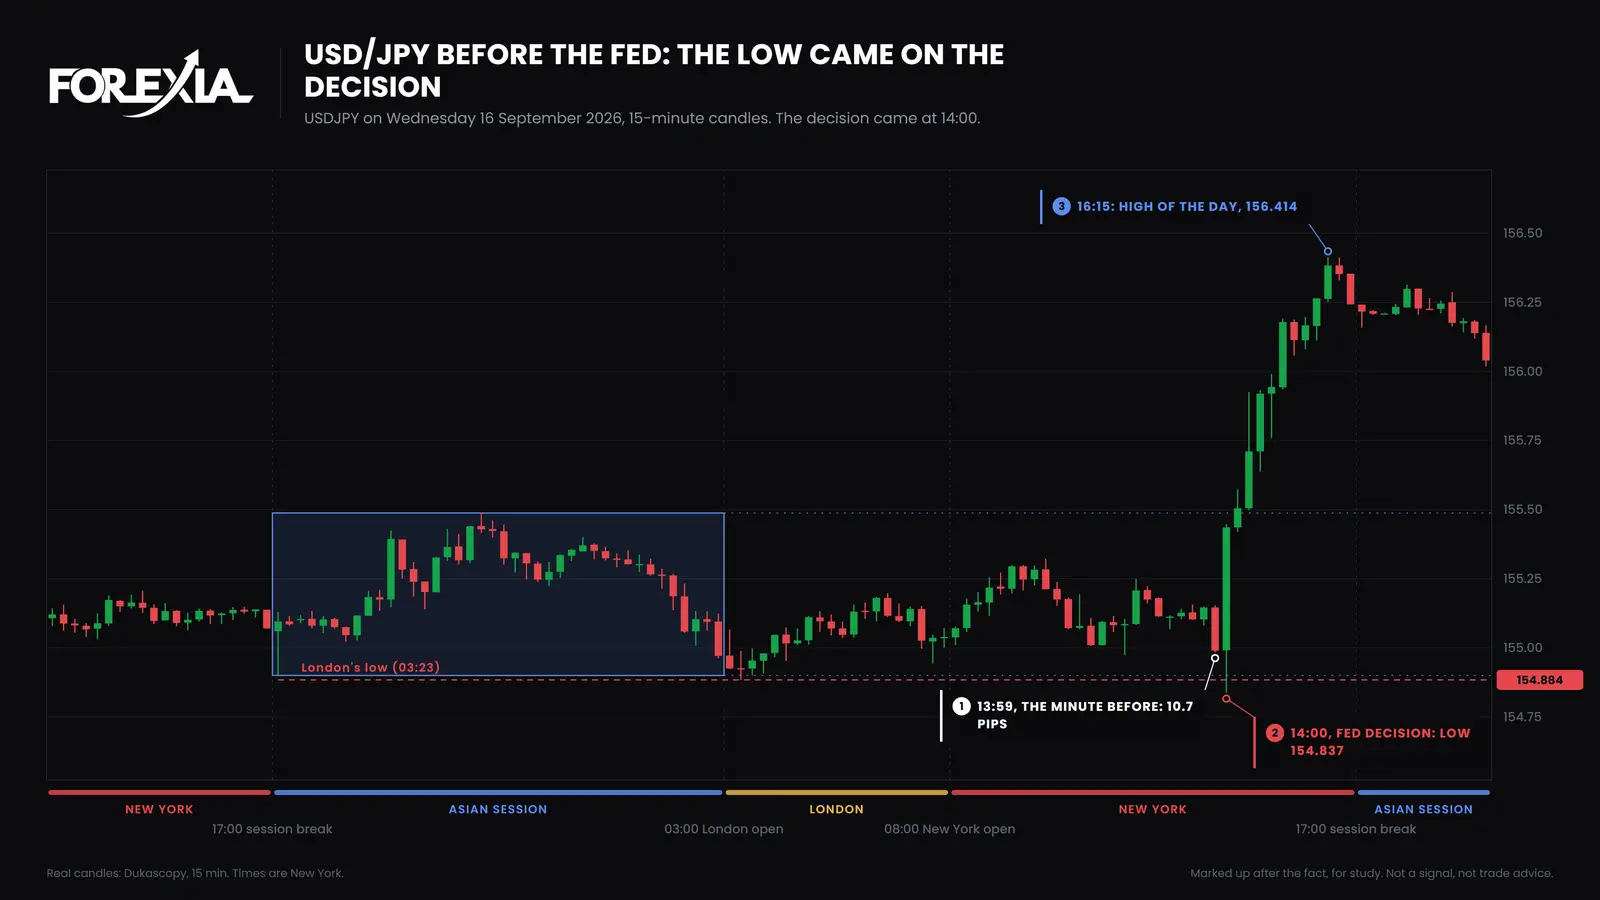
What happens before the FOMC decision: a quiet run-up, then a spike in the last minute. USD/JPY on 16 September 2026 and a count of four Fed days.
6 min read
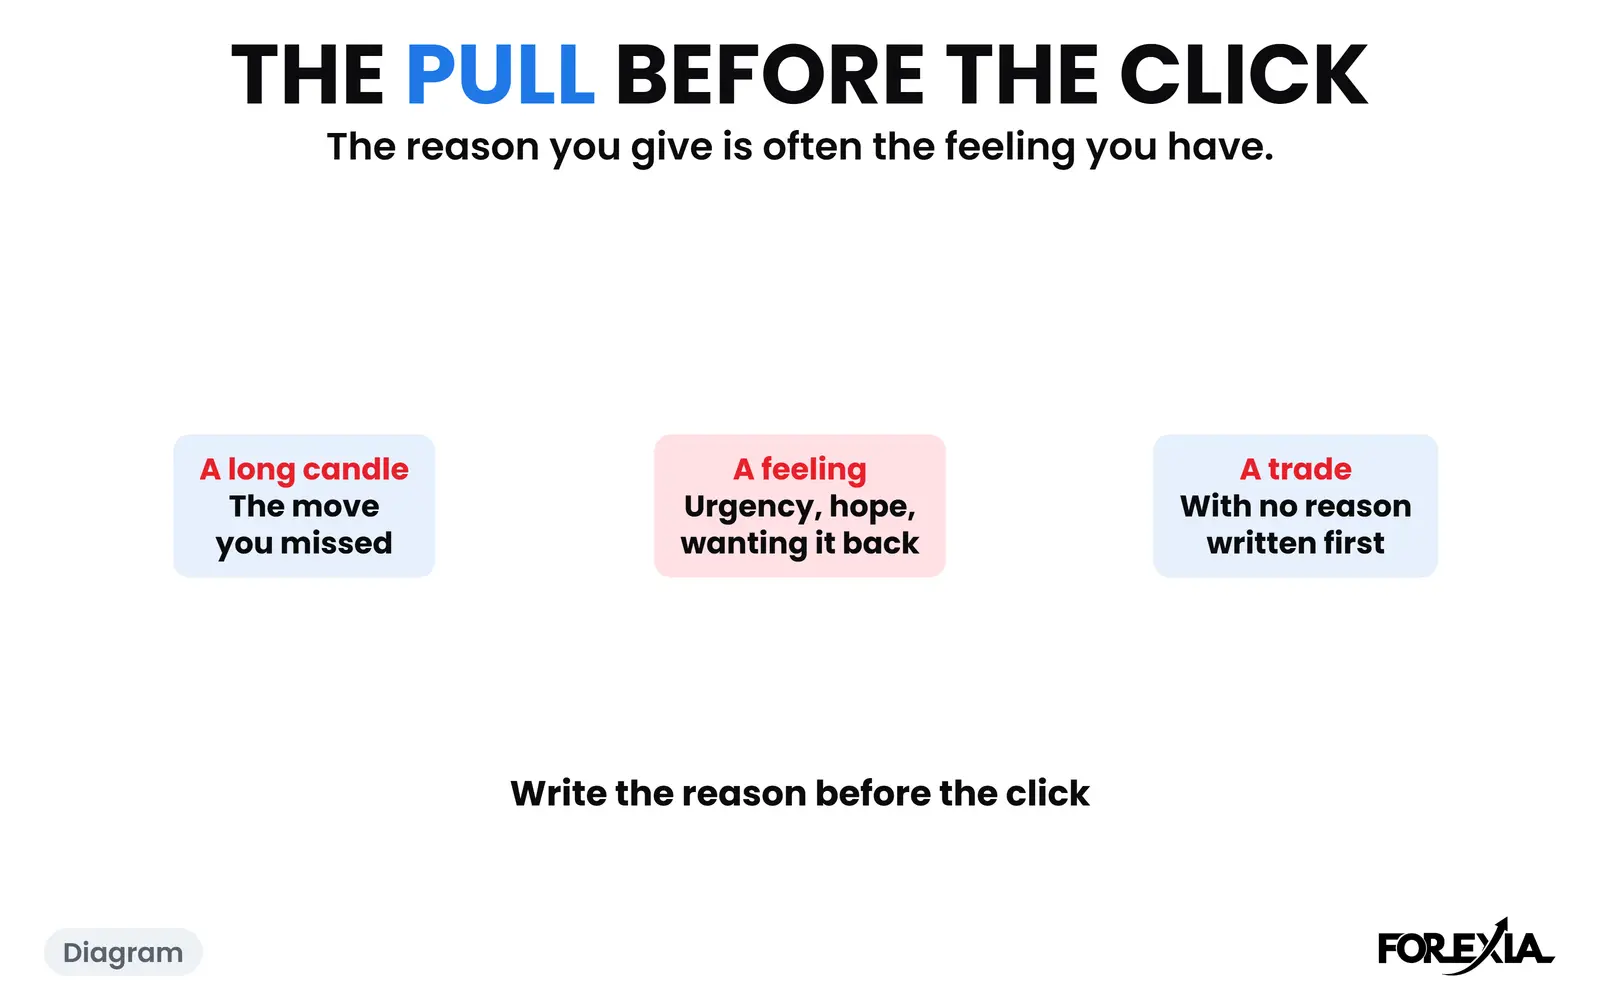
Why do you take trades you know you shouldn't? Knowing a rule is not following it. Three pulls from the research, one real day, and a note to write first.
6 min read
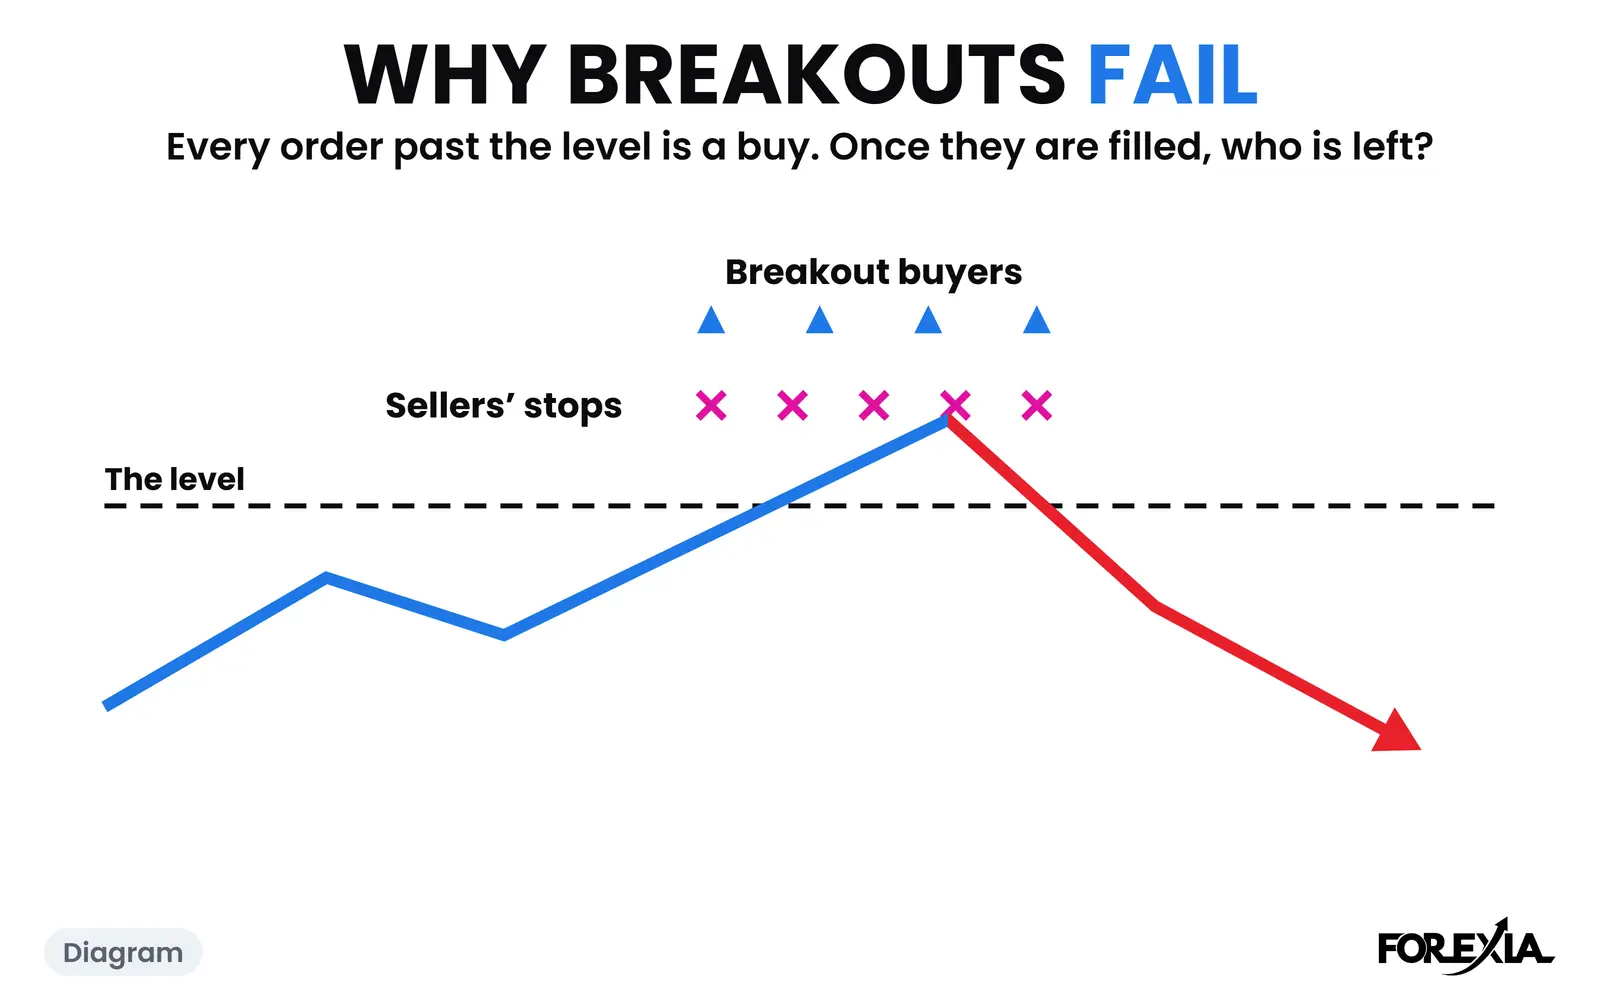
Why do breakouts fail? The break itself brings a crowd of buy orders, and once they are filled nobody is left. Two real days, and a count of 1,601 breaks.
7 min read
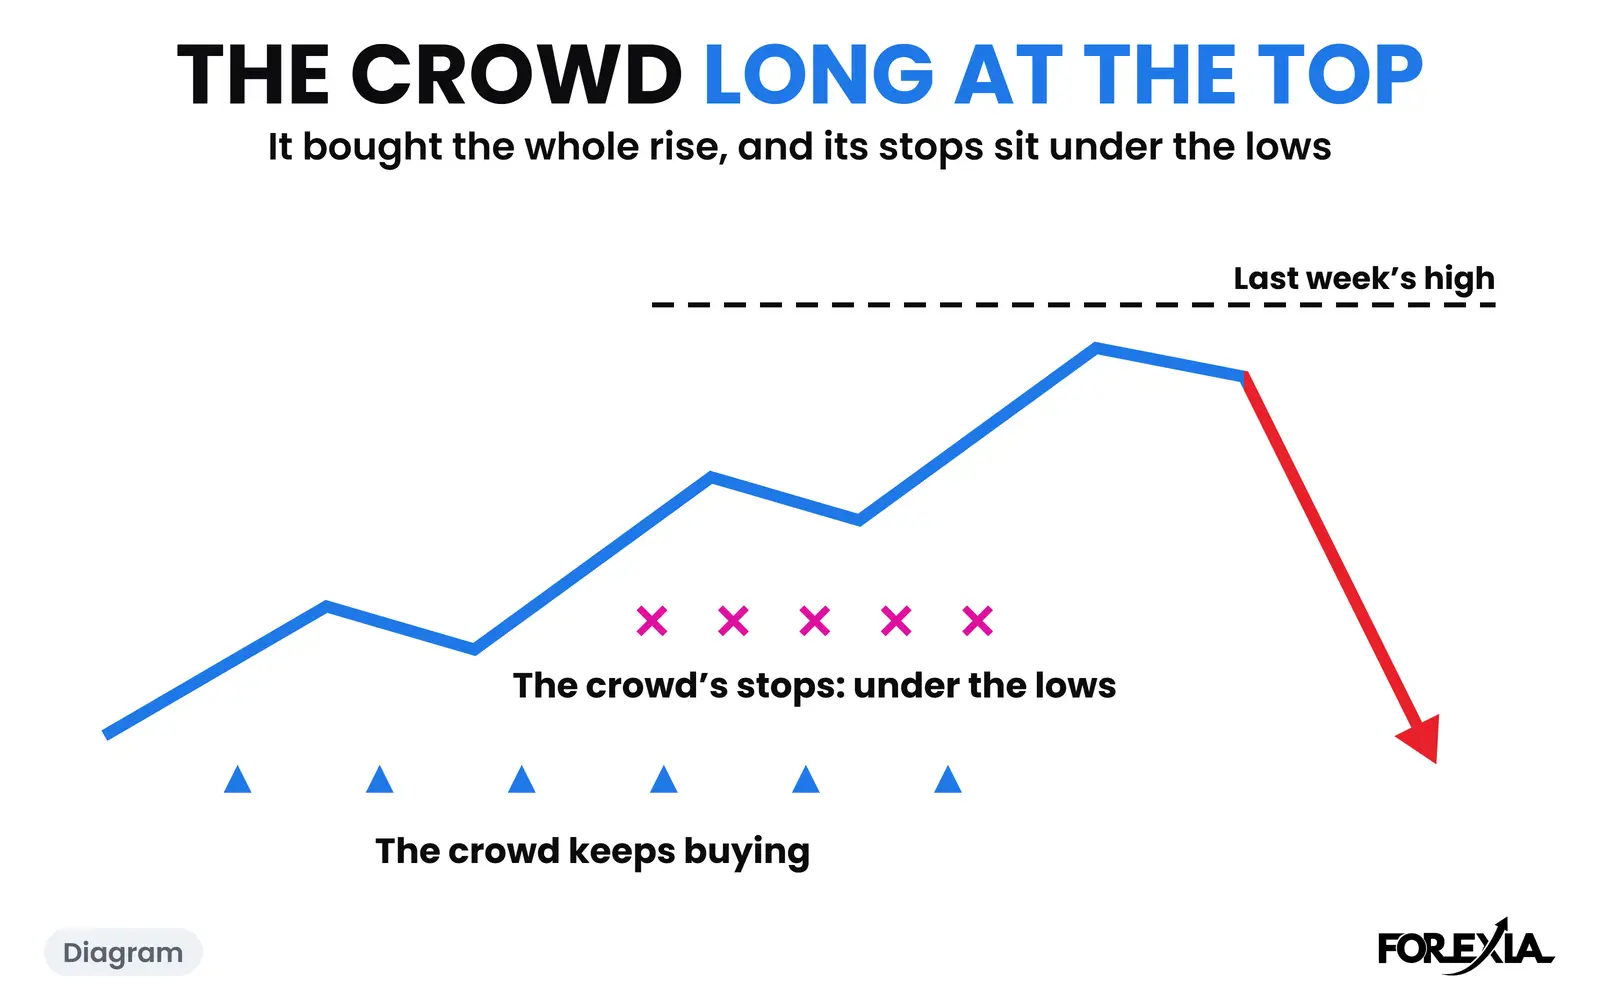
The COT report JPY counted 21 July 2026: yen futures turned round to USD/JPY, the crowd at index 83, who sat opposite, and what price did next.
7 min read
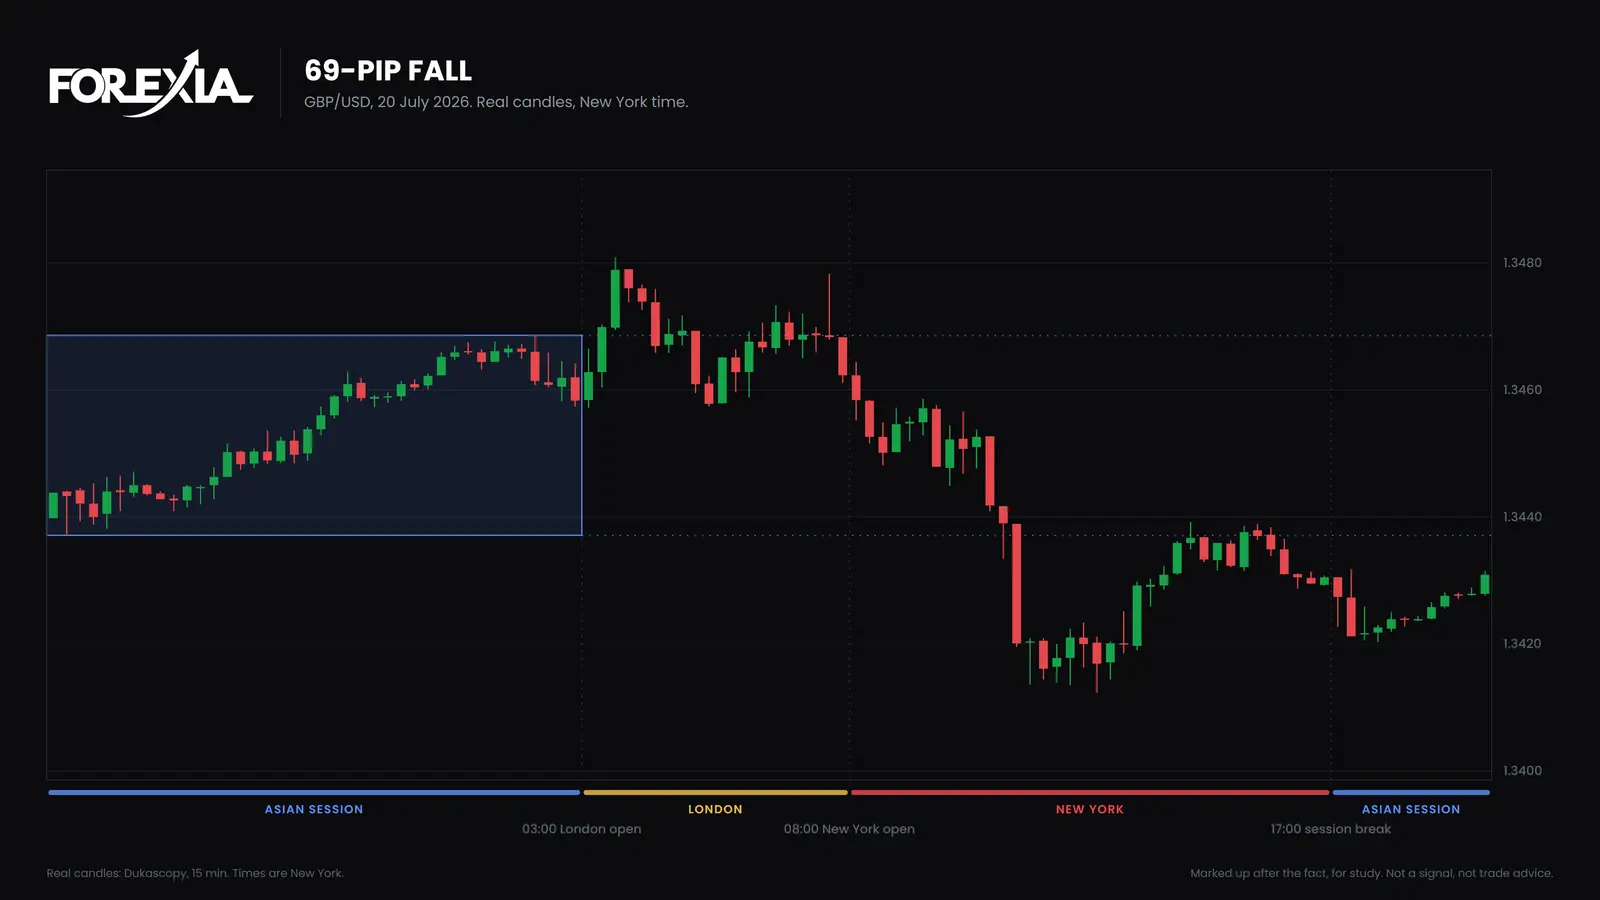
What is a bull trap in trading? A break above a level that reverses and catches buyers. The bear trap is its mirror. A real GBP/USD day and a USD/CAD day.
7 min read
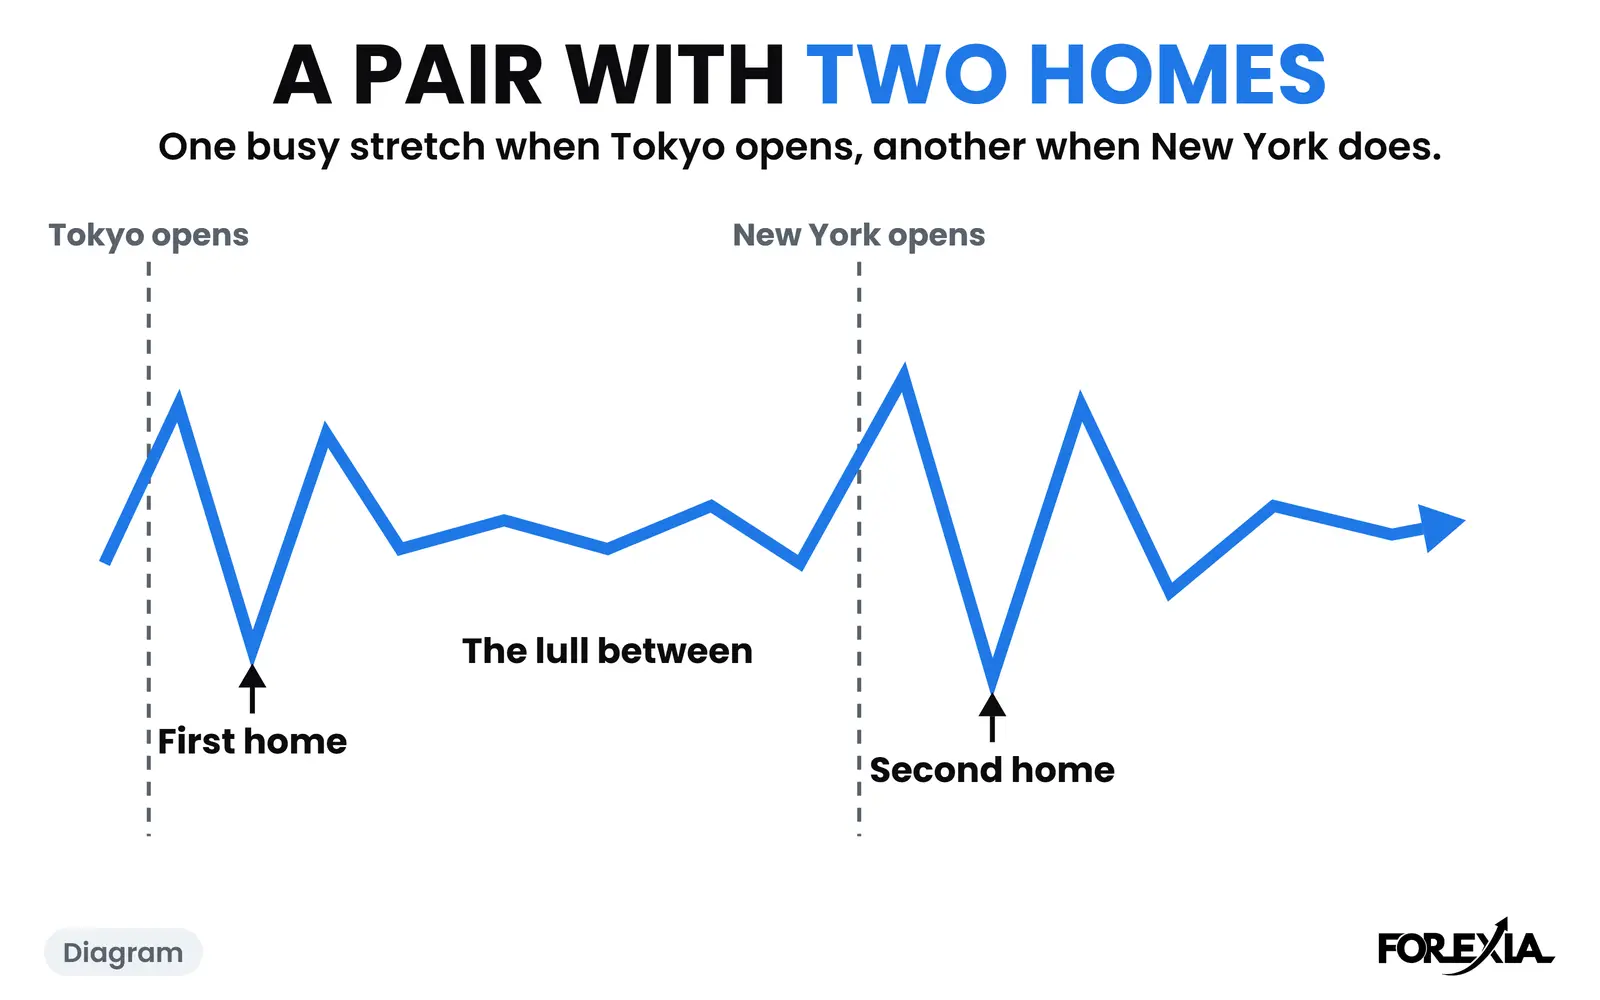
Best time to trade USD/JPY: New York's 08:00 to 11:00 moves most, with Tokyo's open close behind. Median range for each hour, and two real days.
7 min read
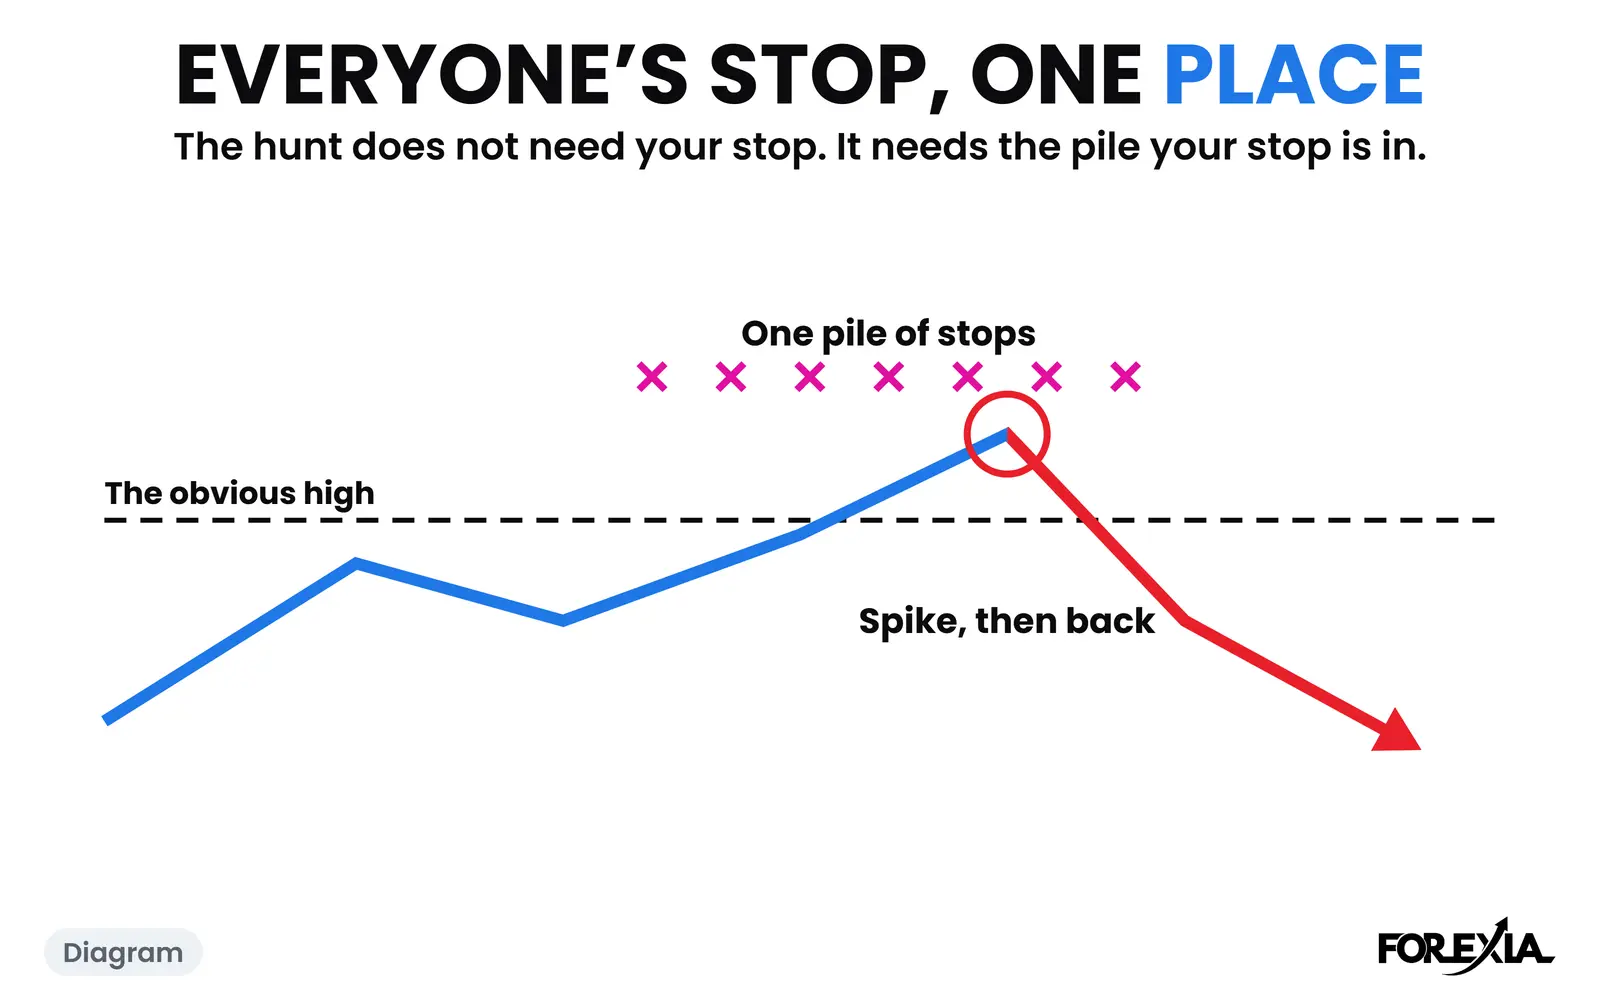
How to avoid stop hunts in forex: how far hunts really run, why a wider stop is not the cure, and what a pile of stops looks like, on three real days.
8 min read
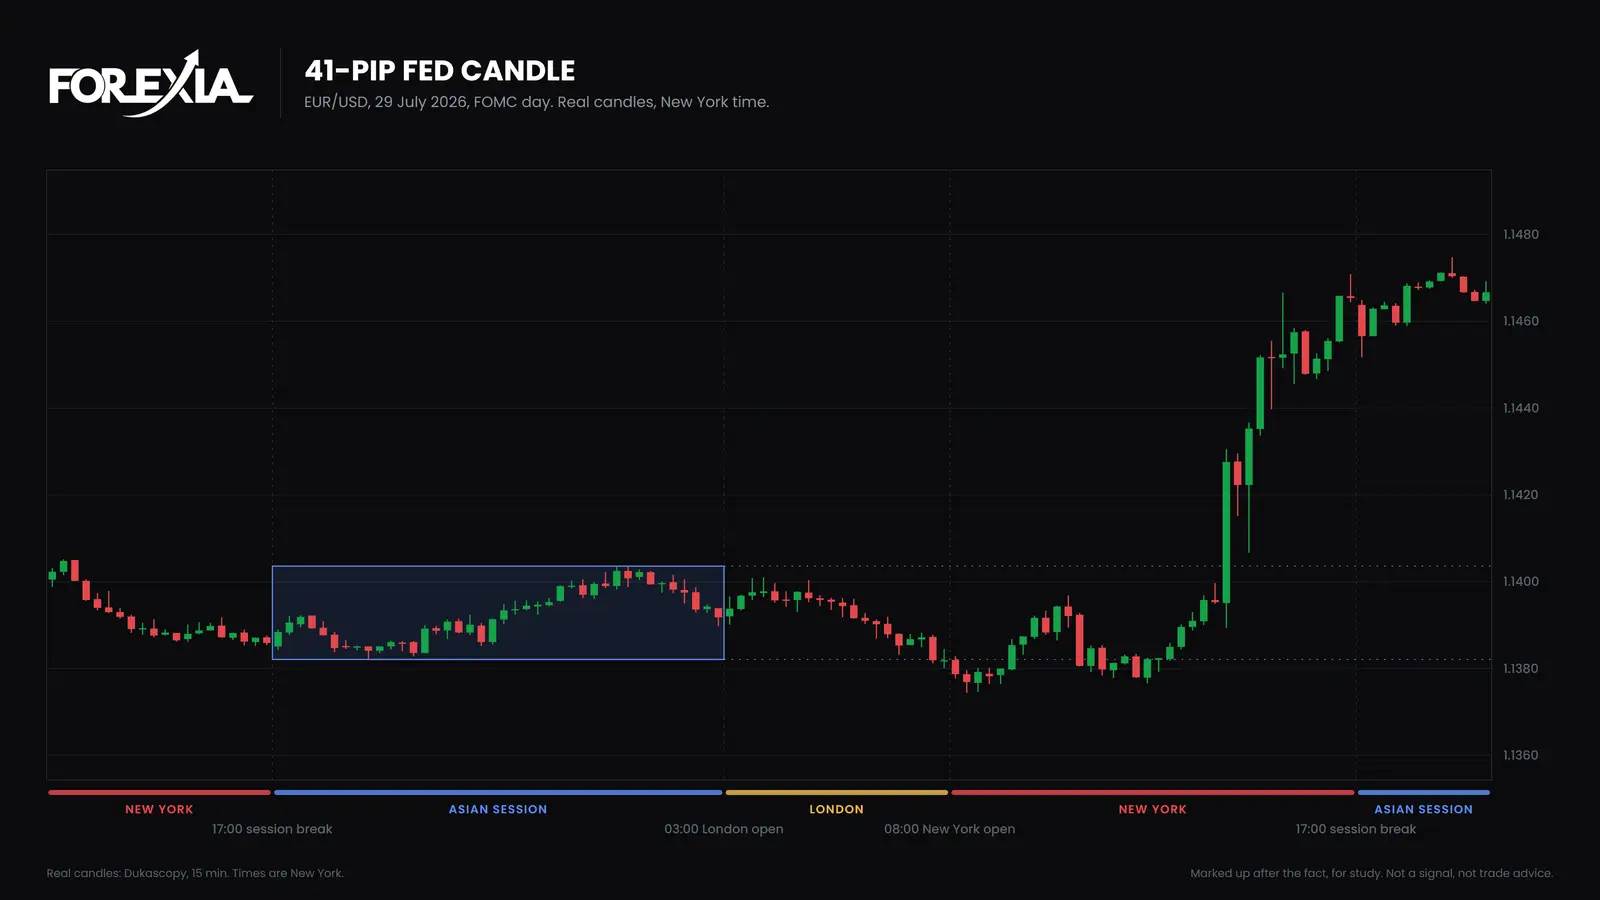
What is FOMC in forex? The Fed's rate decision at 14:00 and press conference at 14:30 New York, shown on EUR/USD on 29 July 2026, candle by candle.
6 min read
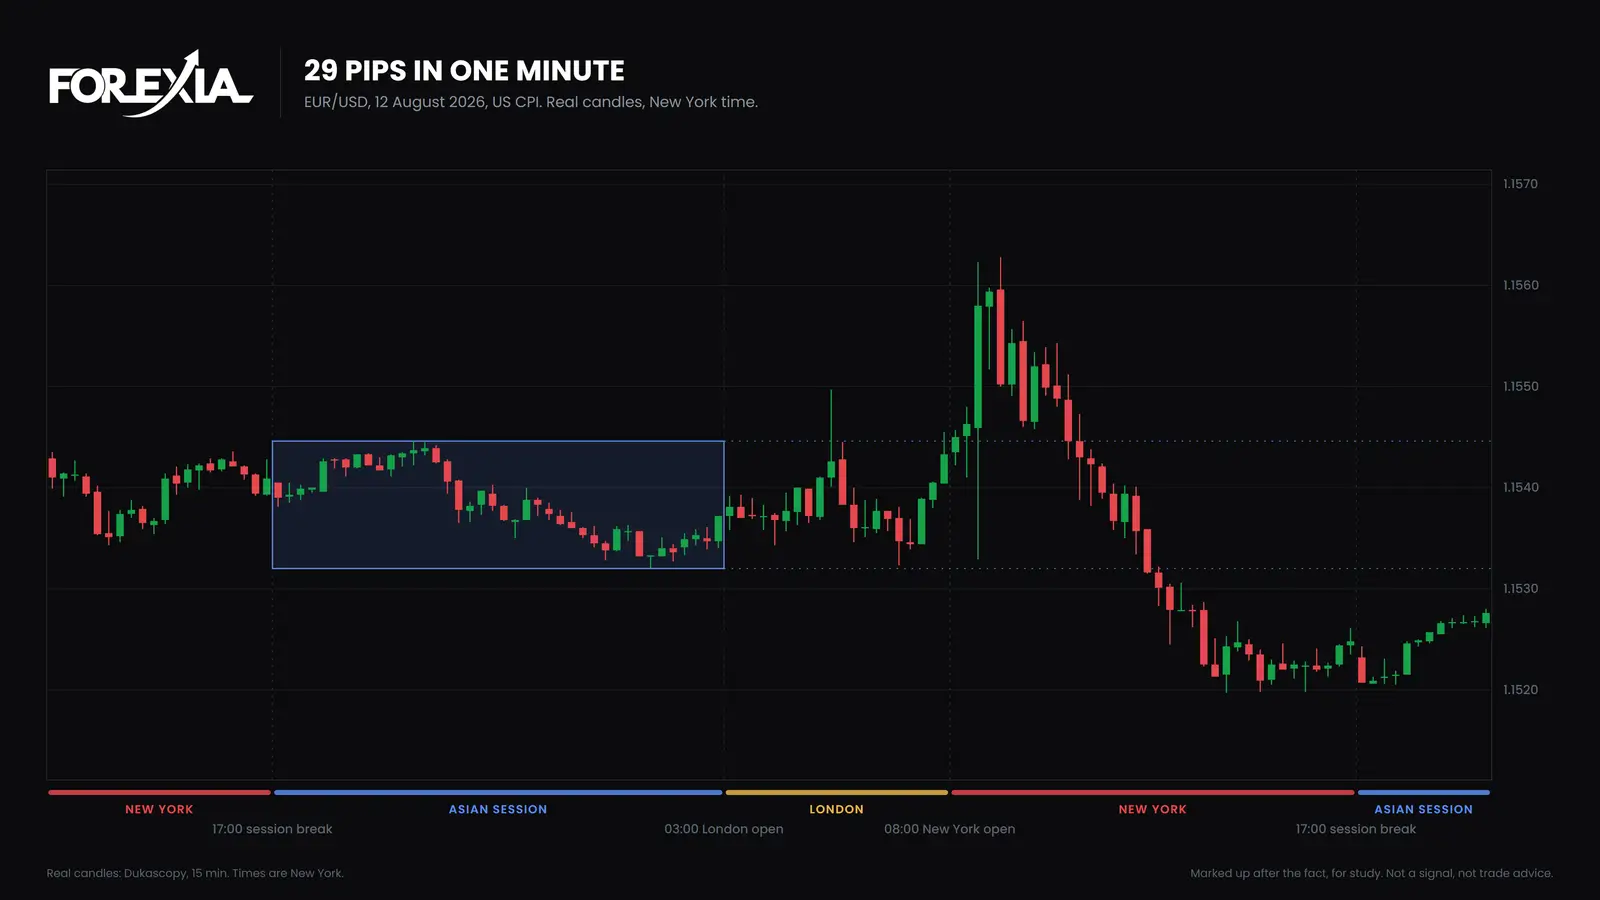
What is CPI in forex? The US consumer price report, out at 08:30 New York, and what it did to EUR/USD on a real day: 16 pips up and 13 down in one minute.
6 min read
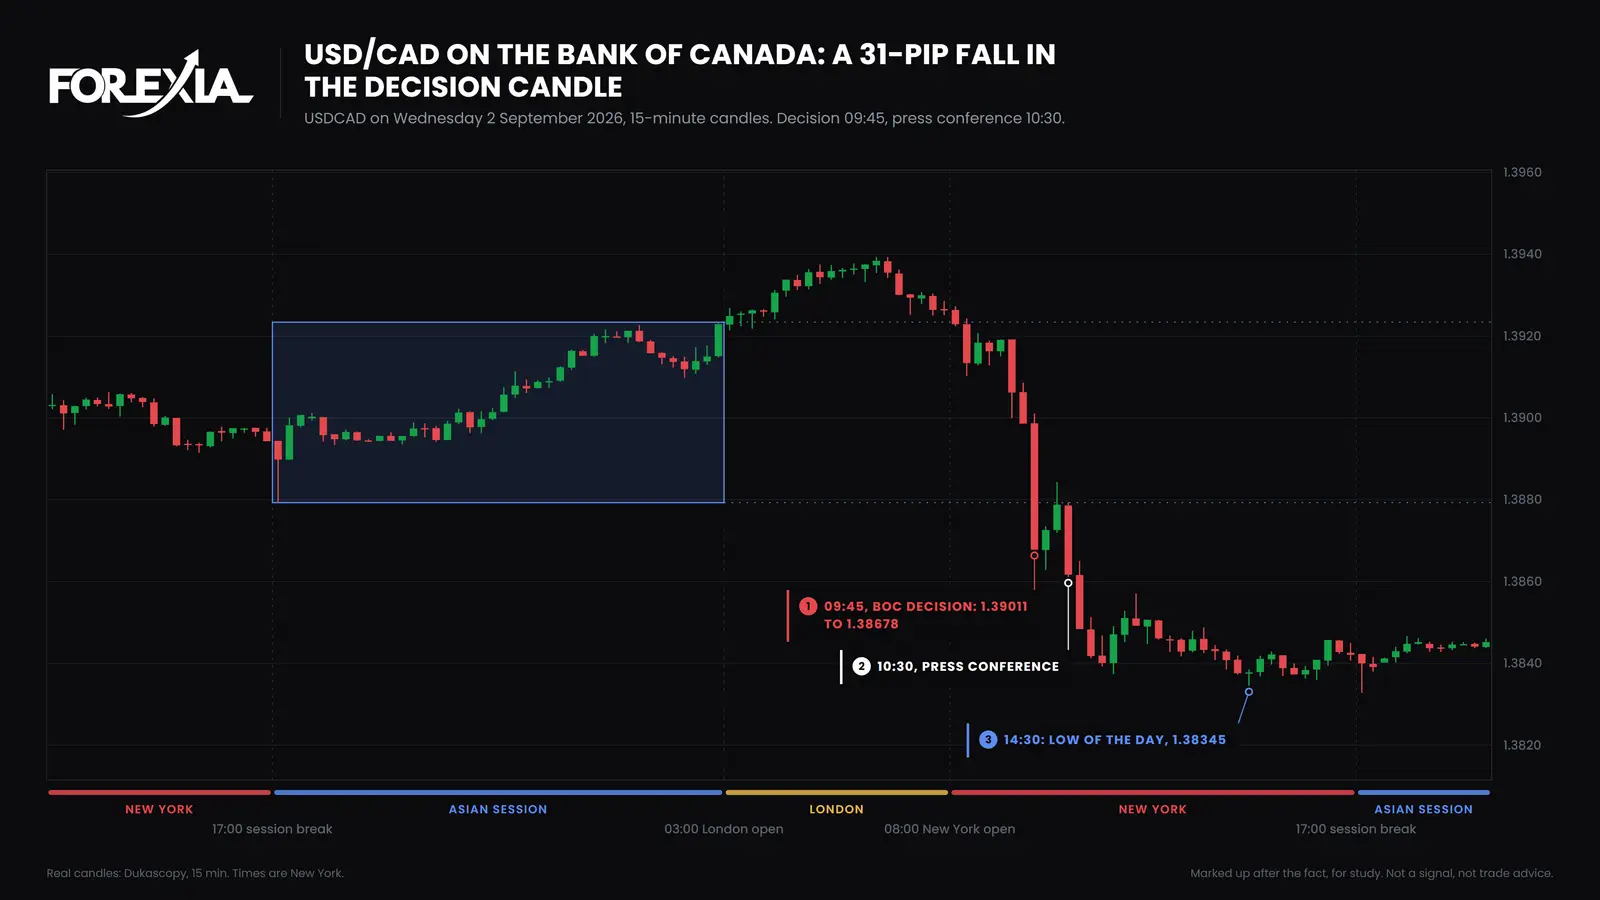
BoC rate decision forex on four real days: a 11 to 33 pip USD/CAD candle at 09:45, and on 2 September 2026 a fall that ran into a 105-pip day.
6 min read
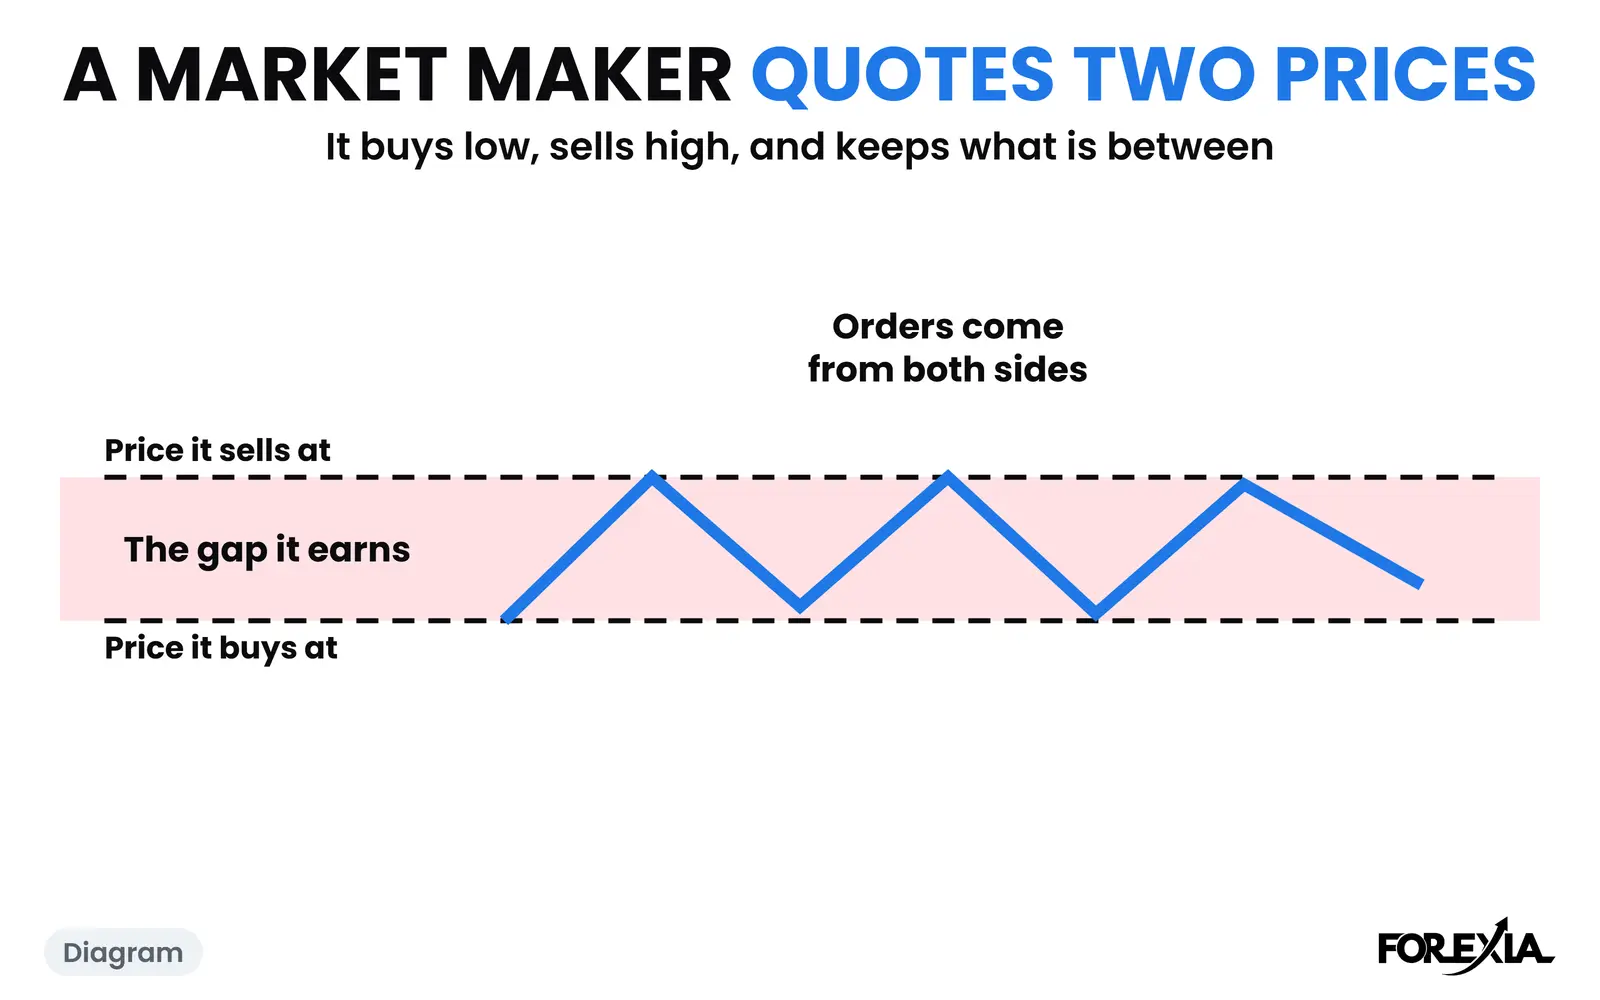
What market makers do in forex: quote two prices, take the other side, pass the risk on. The role in plain English, then one real dated day on our chart.
6 min read
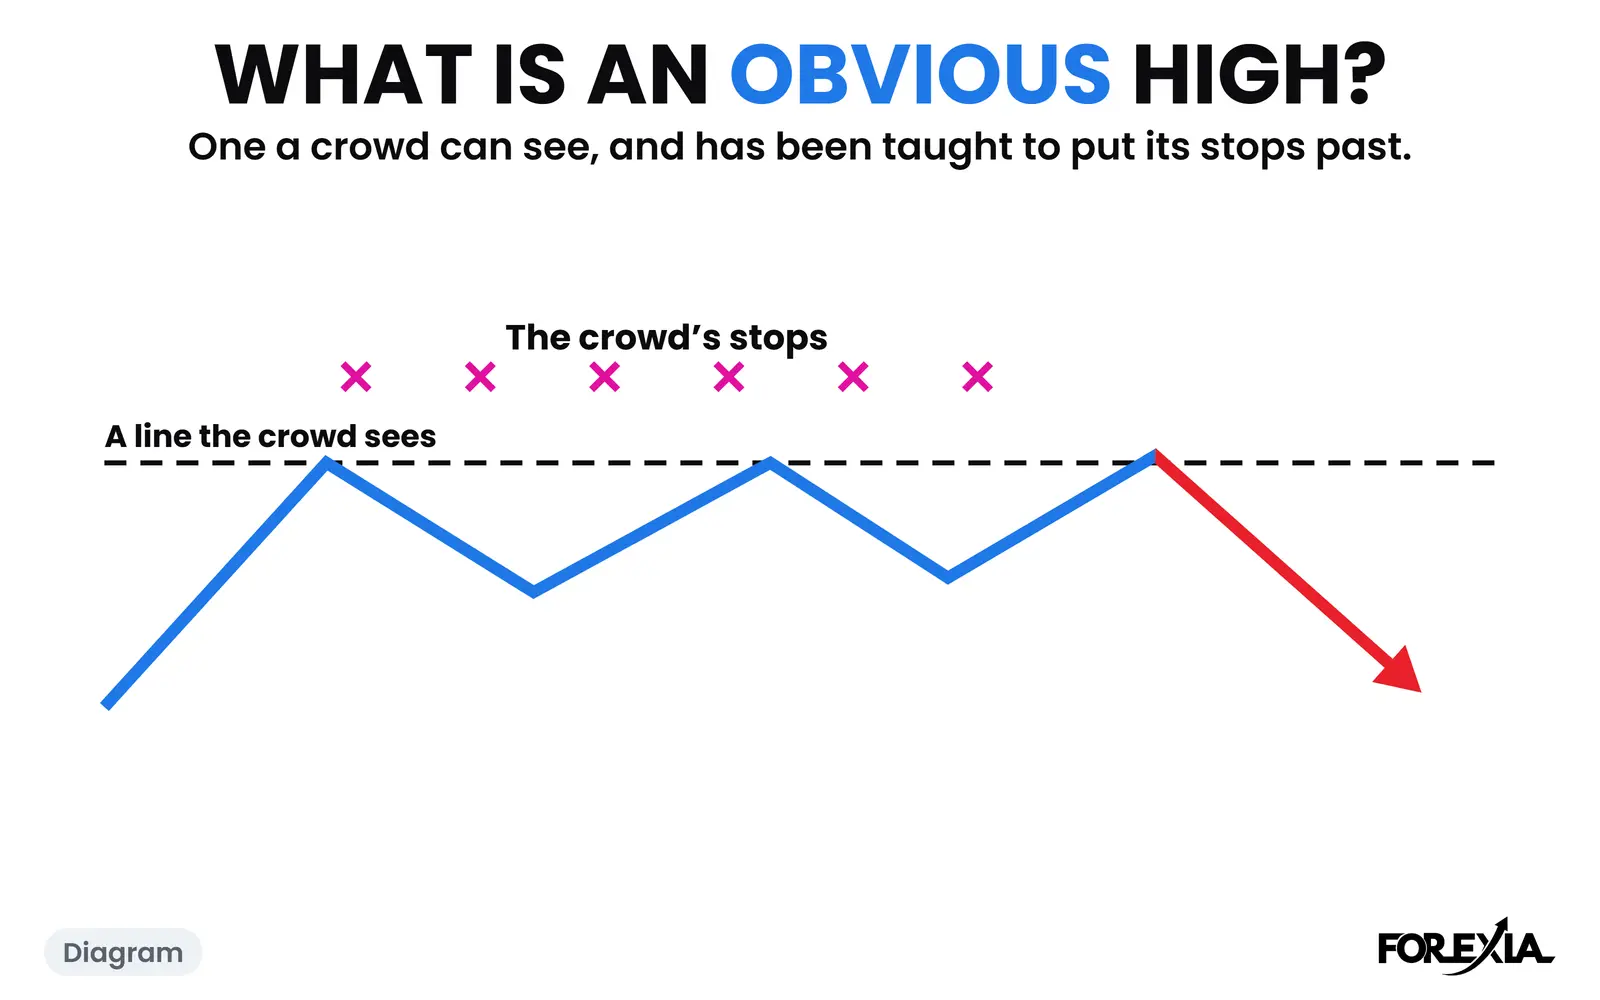
What is an obvious high or low in forex? Four kinds of level, counted on 1,601 taken, plus equal highs and lows on a real dated EUR/USD day.
8 min read
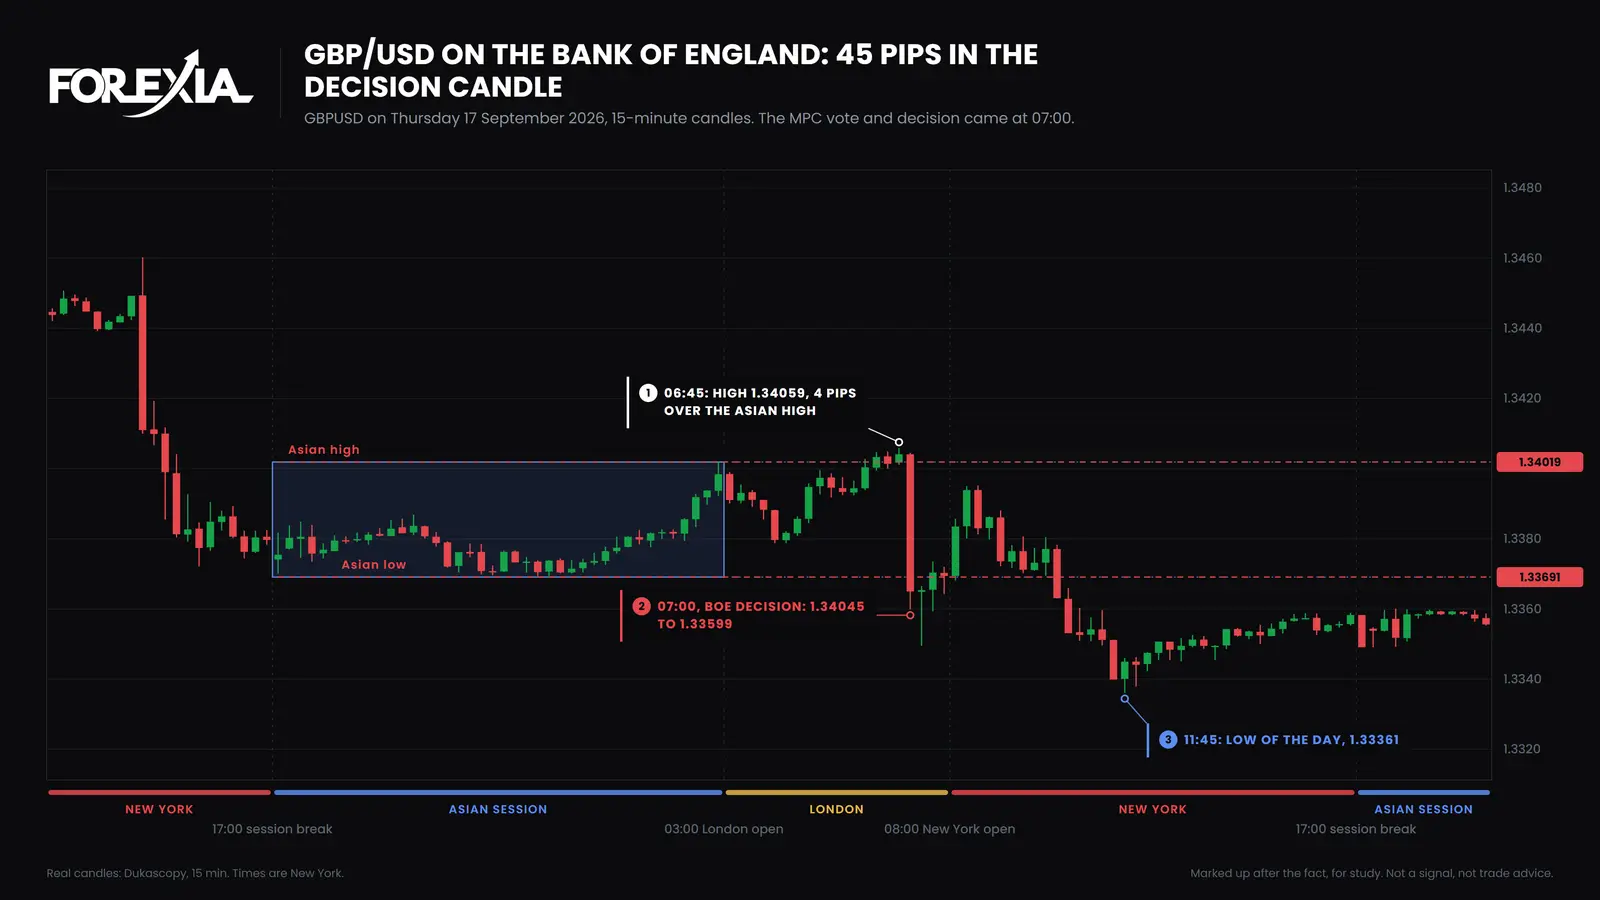
BoE rate decision forex on four real days: a 17 to 22 pip GBP/USD candle at 07:00, 45 pips on 17 September 2026, and a close back that did not hold.
6 min read
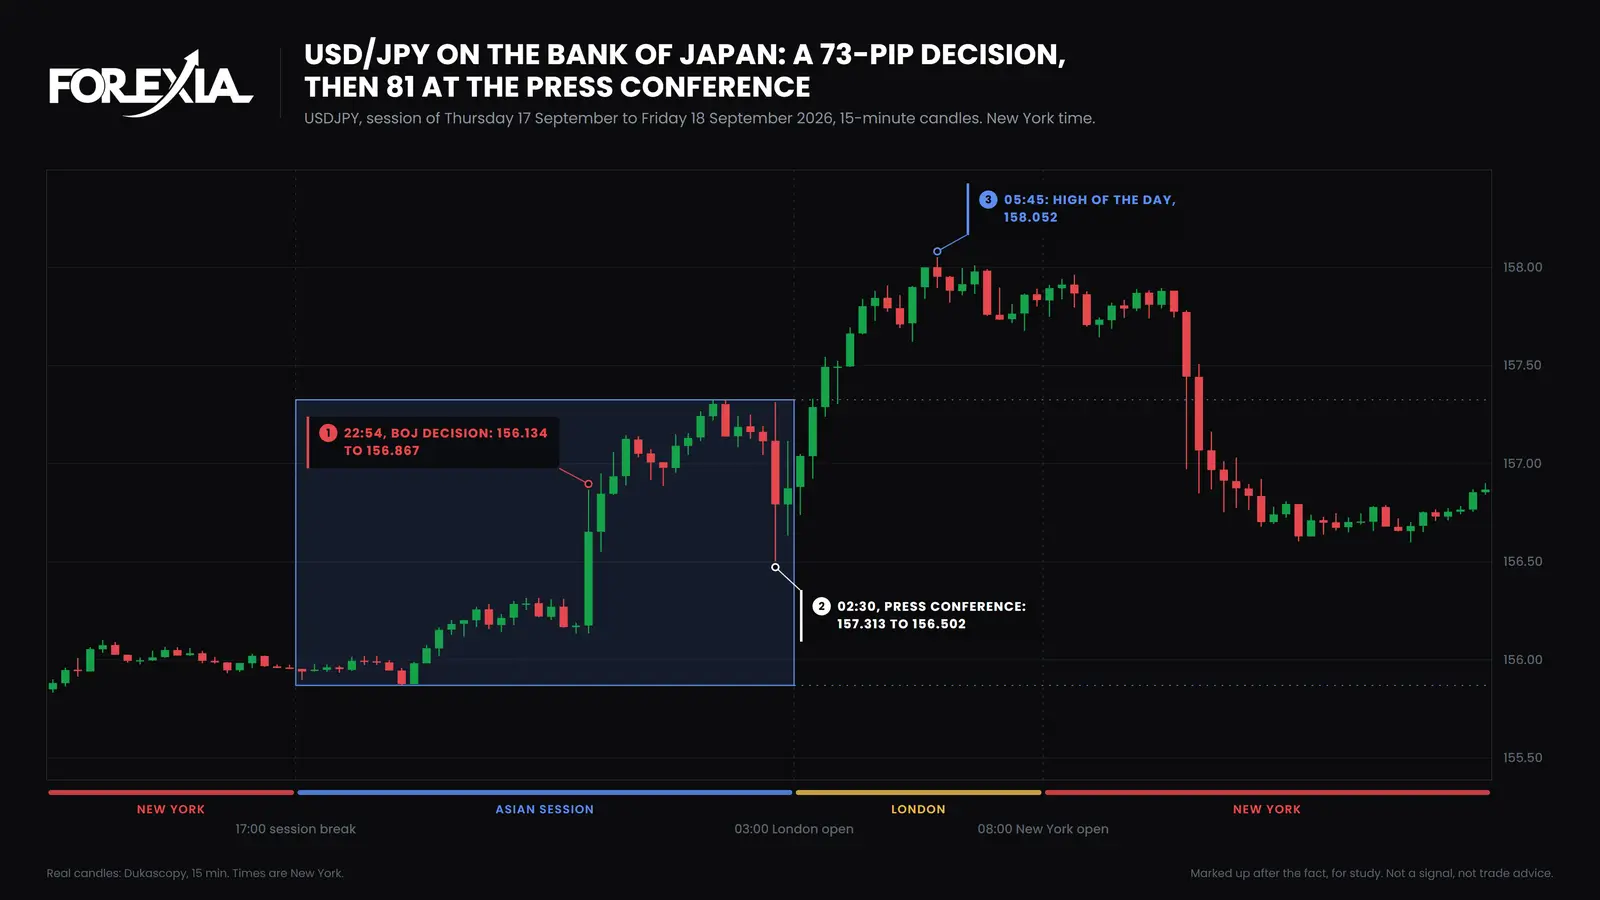
BoJ rate decision forex on four real days: a 17 to 73 pip USD/JPY candle with no fixed minute, and 81 pips at the press conference on 17 September 2026.
6 min read
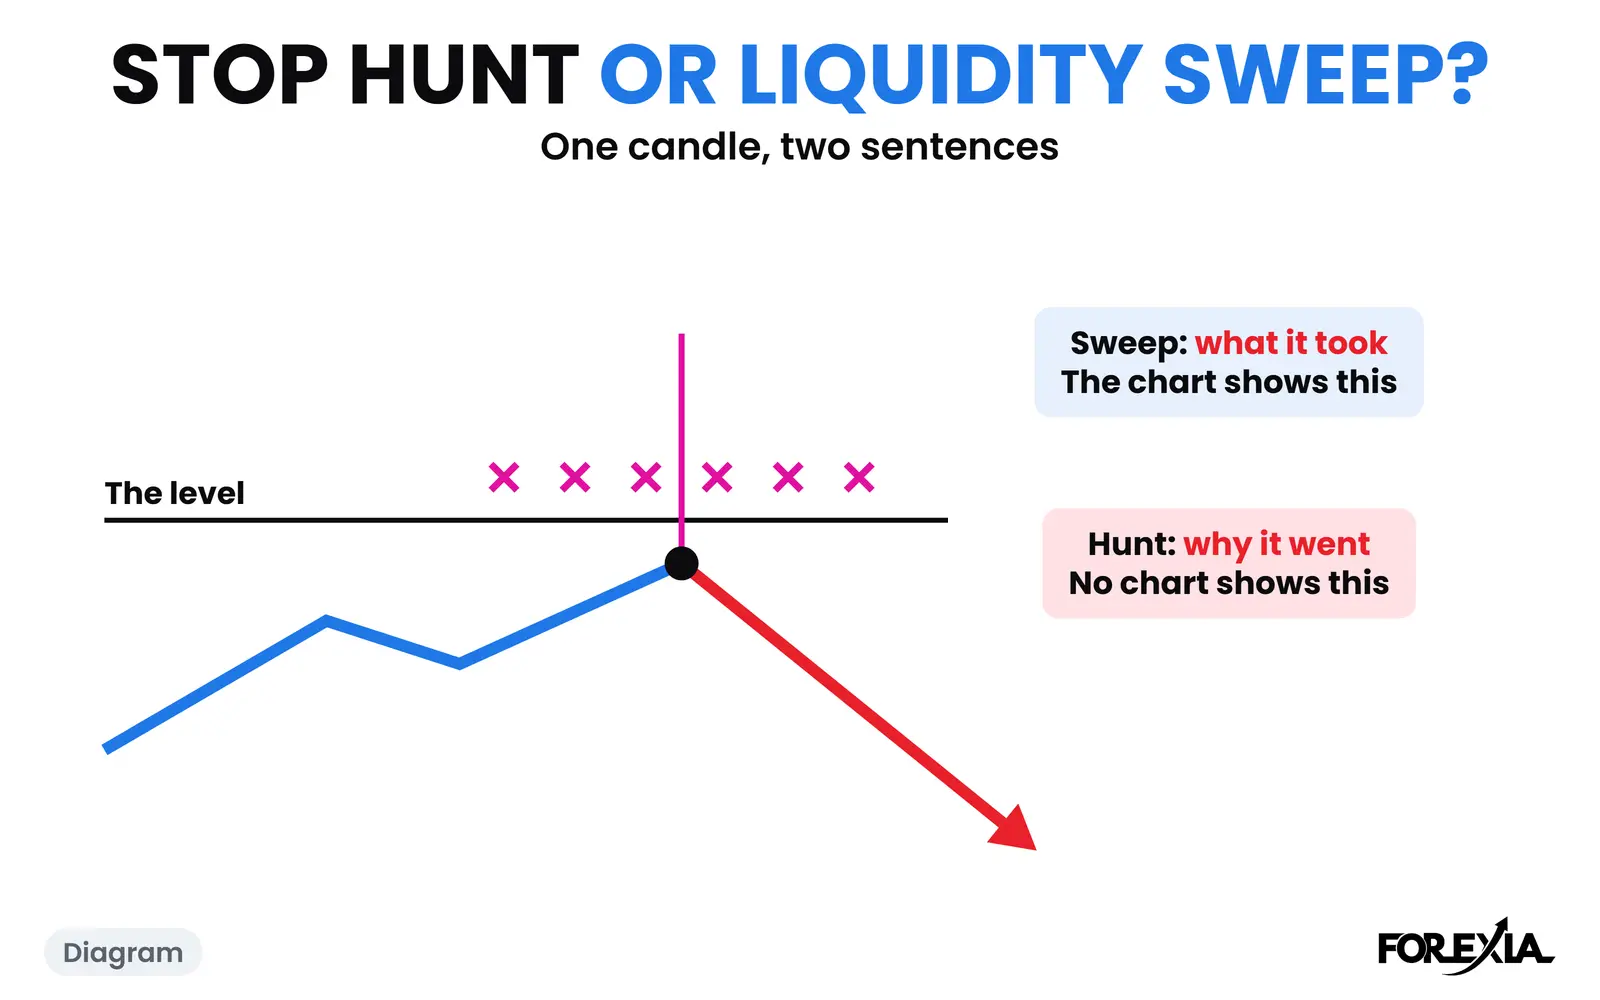
Stop hunt vs liquidity sweep: the same candle, two different claims. A test of both words on two real days, and what the FX code of conduct says about it.
8 min read
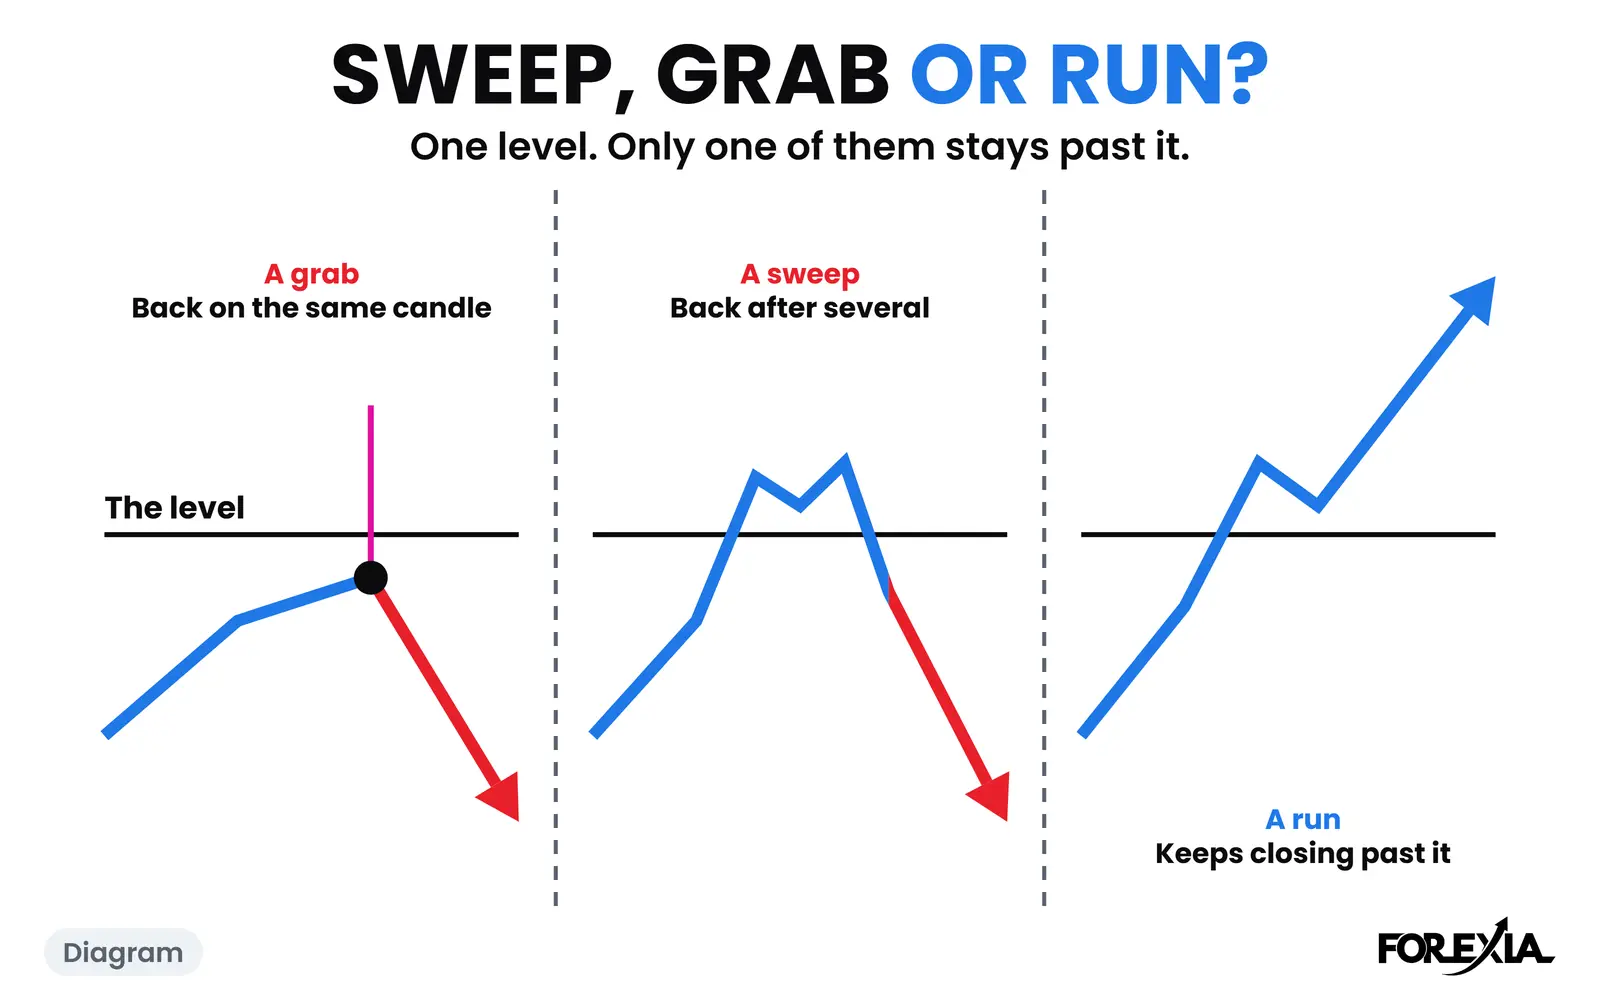
Liquidity sweep vs liquidity run: one closes back, one does not. A grab is mostly a sweep. Real dated days of each, and 1,601 levels that test the split.
8 min read
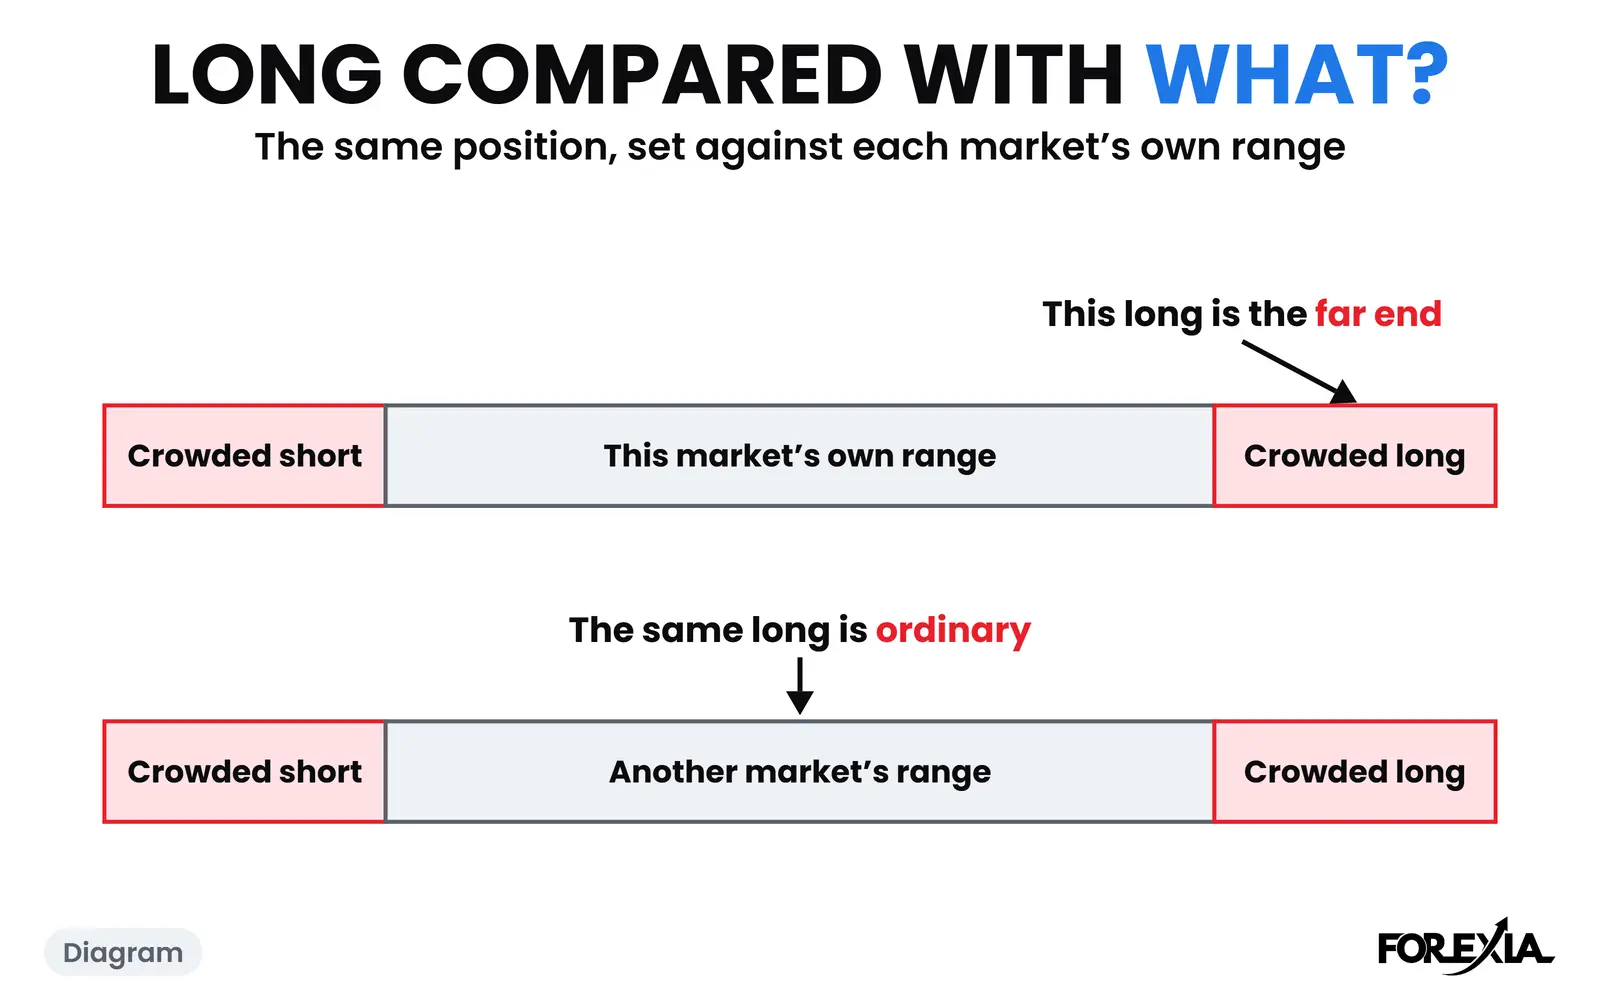
COT index meaning: where large speculators stand in their own range, 0 to 100. One week worked four ways, and gold at 80 on one formula, 42 on another.
8 min read
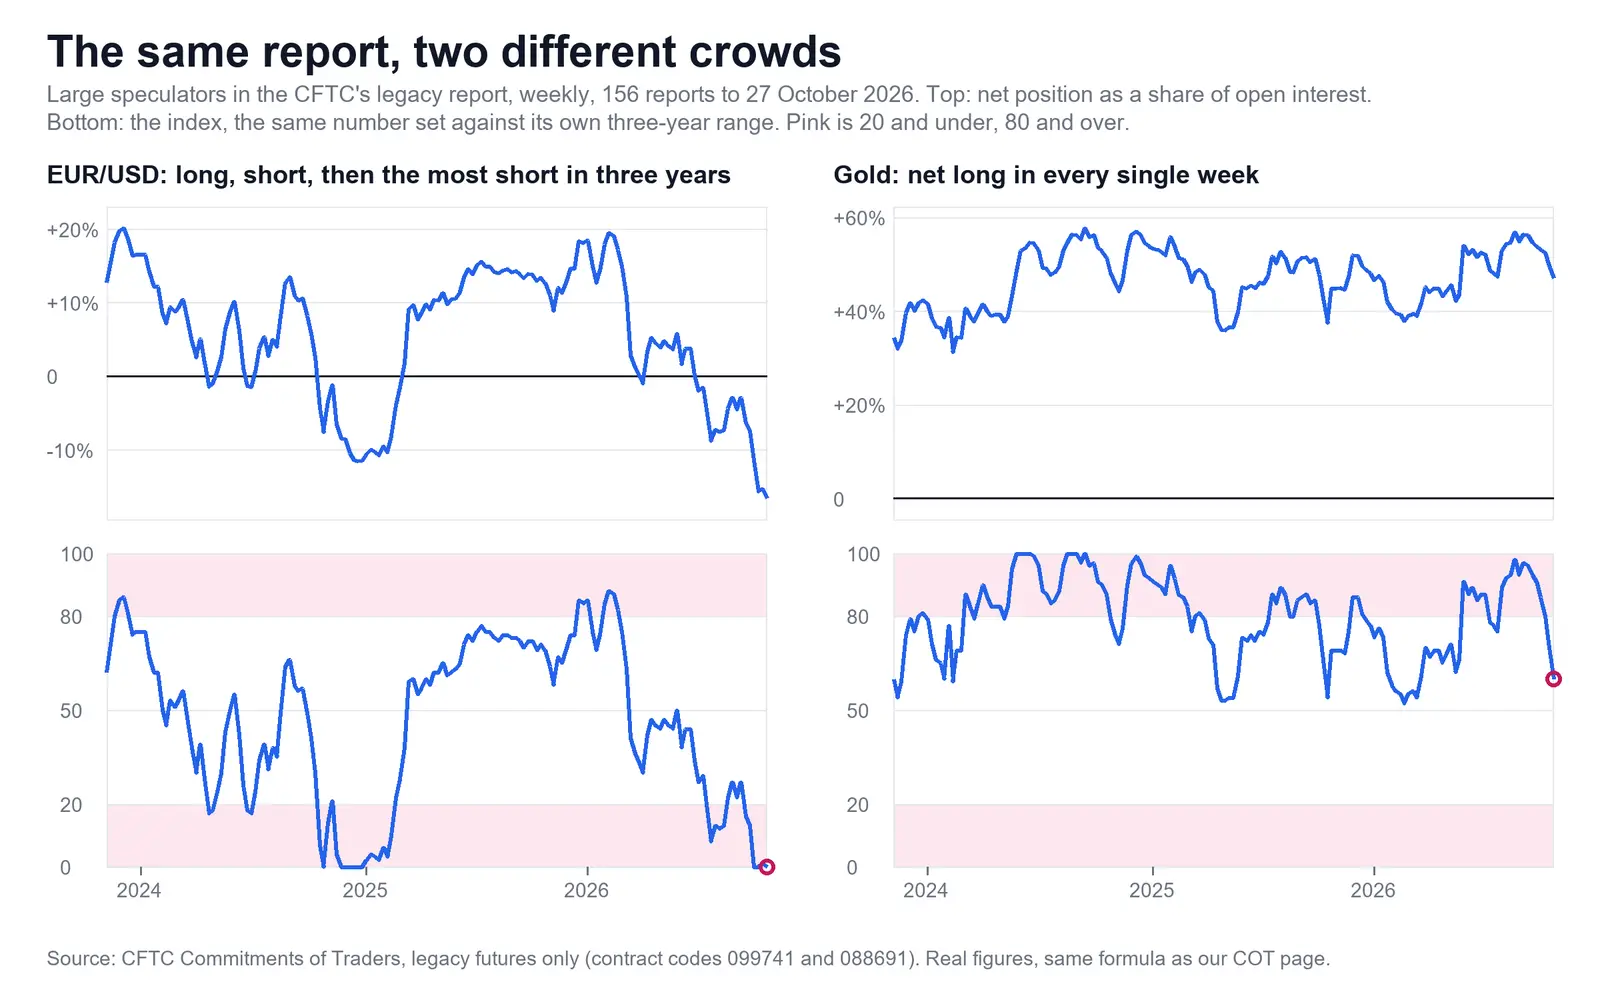
A COT index calculator: enter a net position and its range for the 0 to 100 index. The formula our report uses, worked on real weeks, and common errors.
6 min read
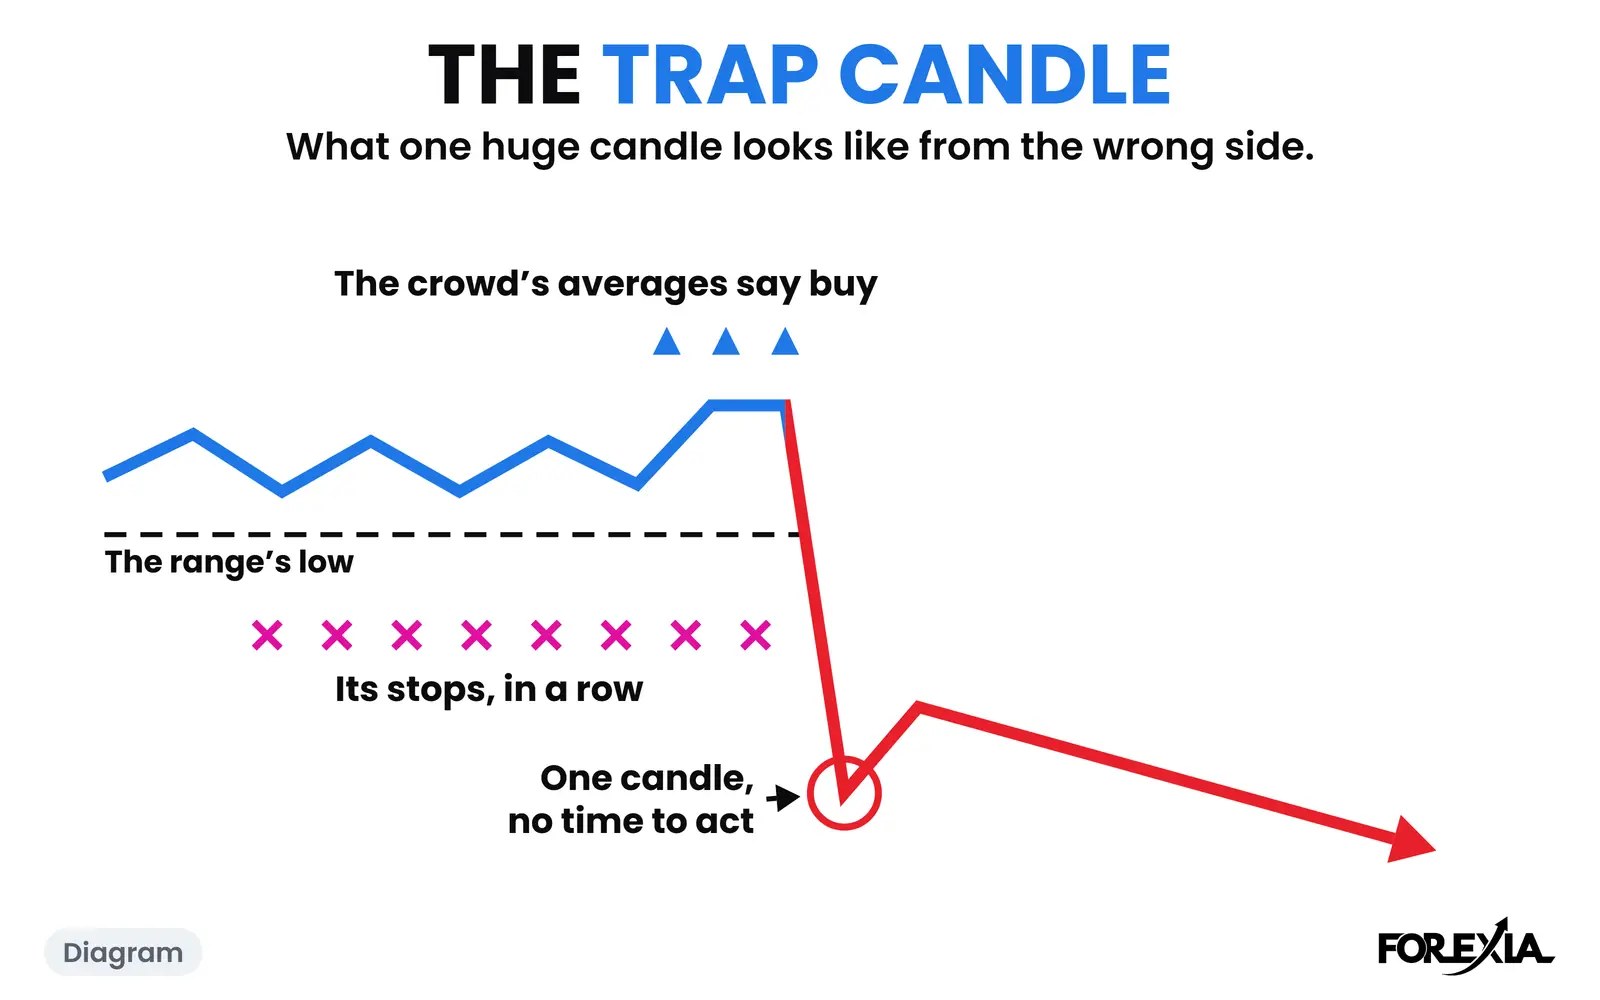
Trap candle forex: what it looks like from the wrong side, on AUD/USD jobs reports and gold on CPI in 2026, with the average that said the opposite.
9 min read
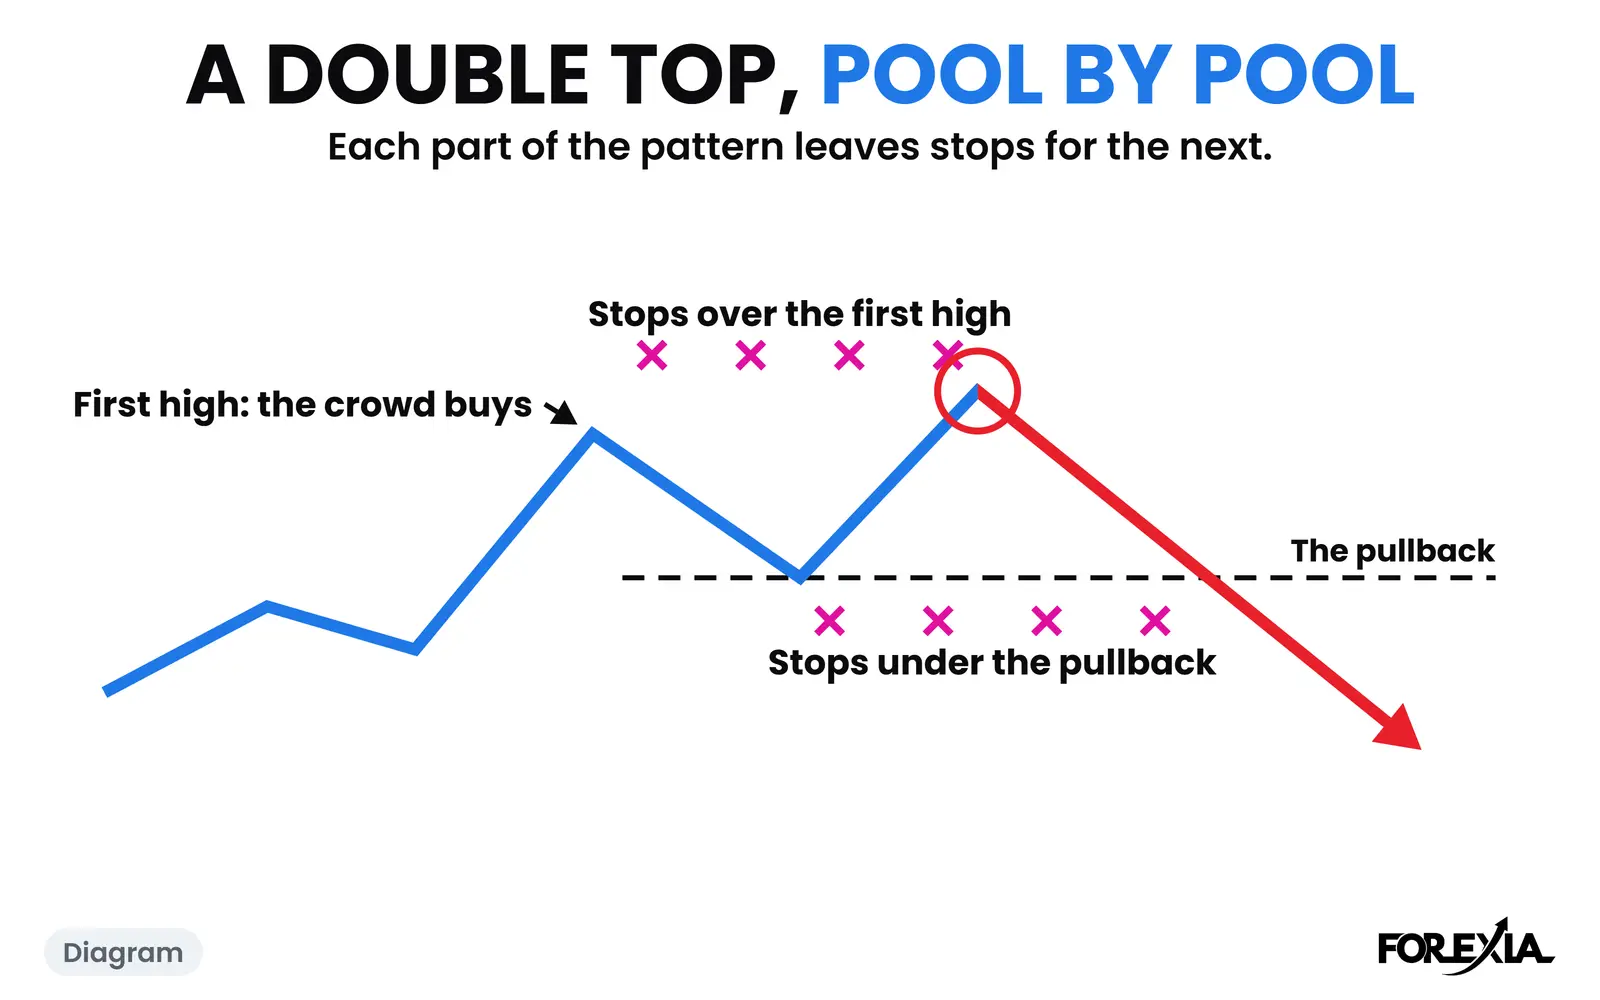
A USD/CAD double top on 1 October 2026, read backwards: who it trapped, the stop hunt 4 pips past the first high, and what price did that day and the next.
7 min read
A forex position size calculator with its working shown: risk amount divided by stop times pip value, worked for EUR/USD, yen pairs and gold. No sign-in.
9 min read
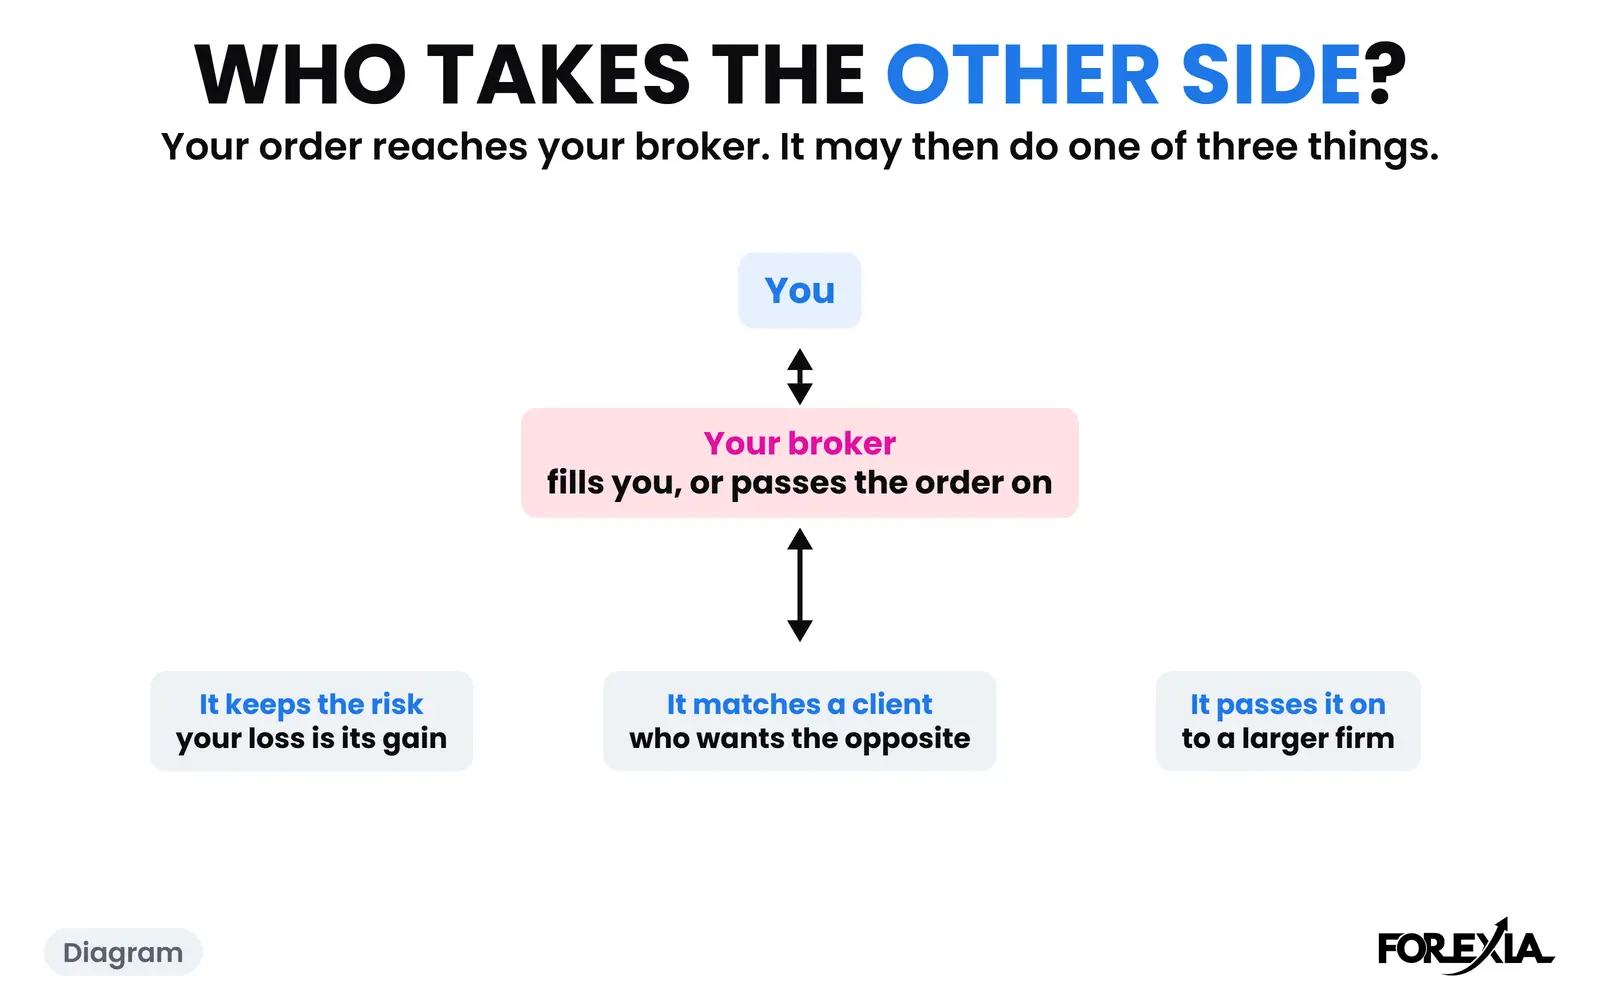
Who takes the other side of your forex trade? What US rules and broker models allow, and what stays unknown. BIS figures and two real days on our charts.
8 min read
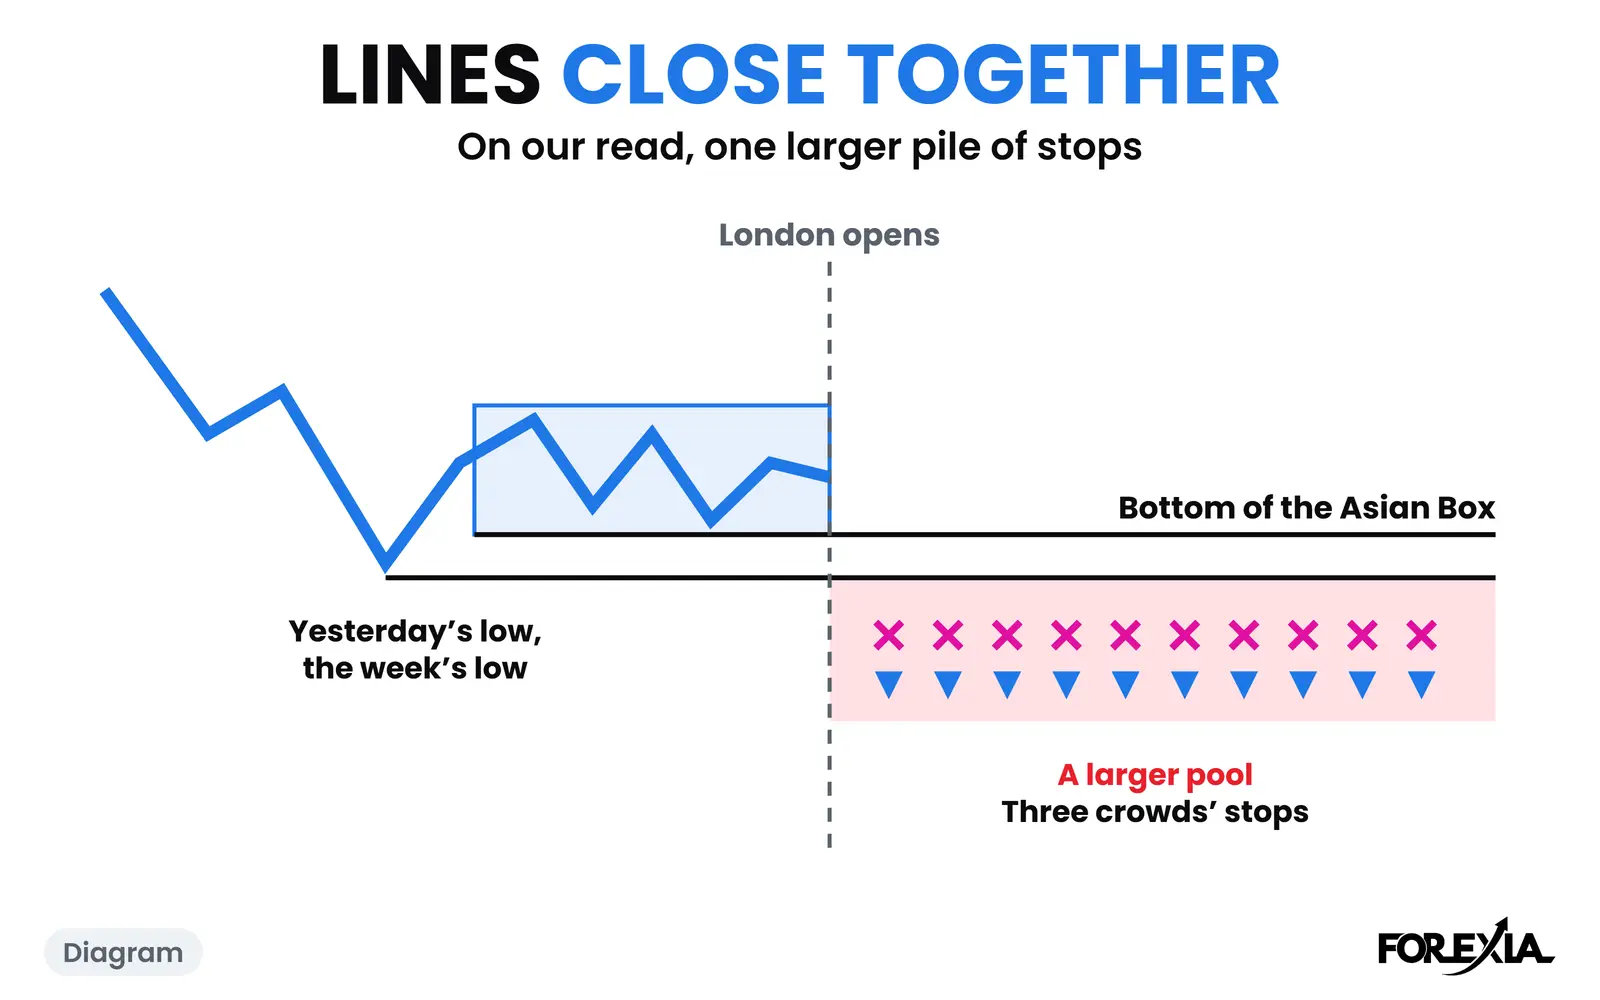
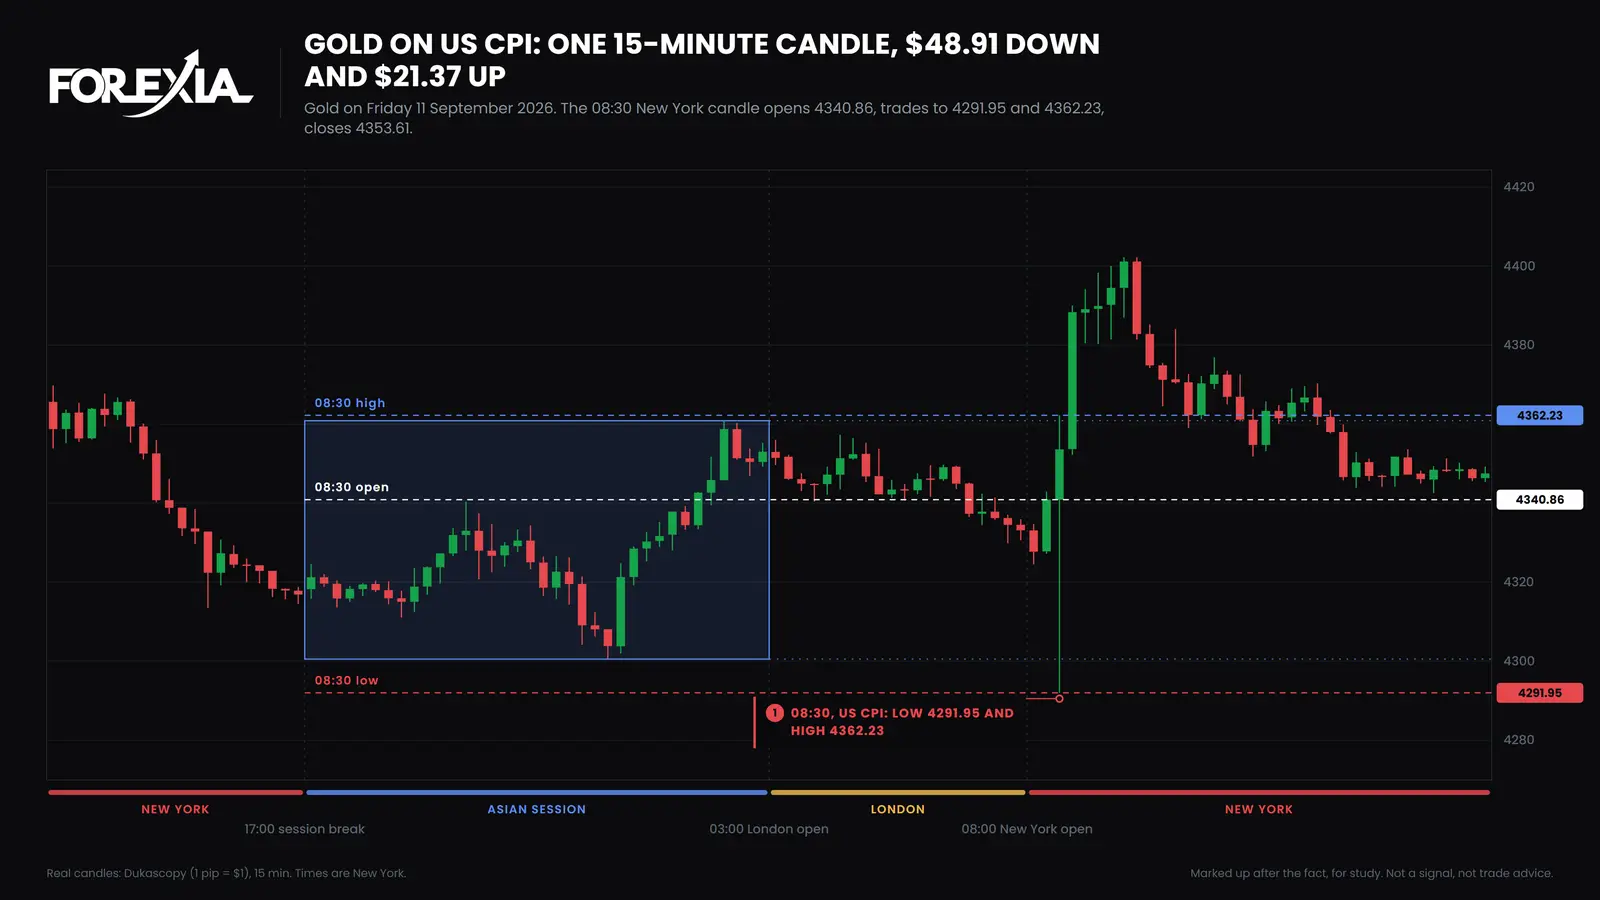
How to find liquidity pools in forex: what was on the chart before the 08:30 CPI candle on 11 September 2026, what price did, and a pool that never turned.
8 min read
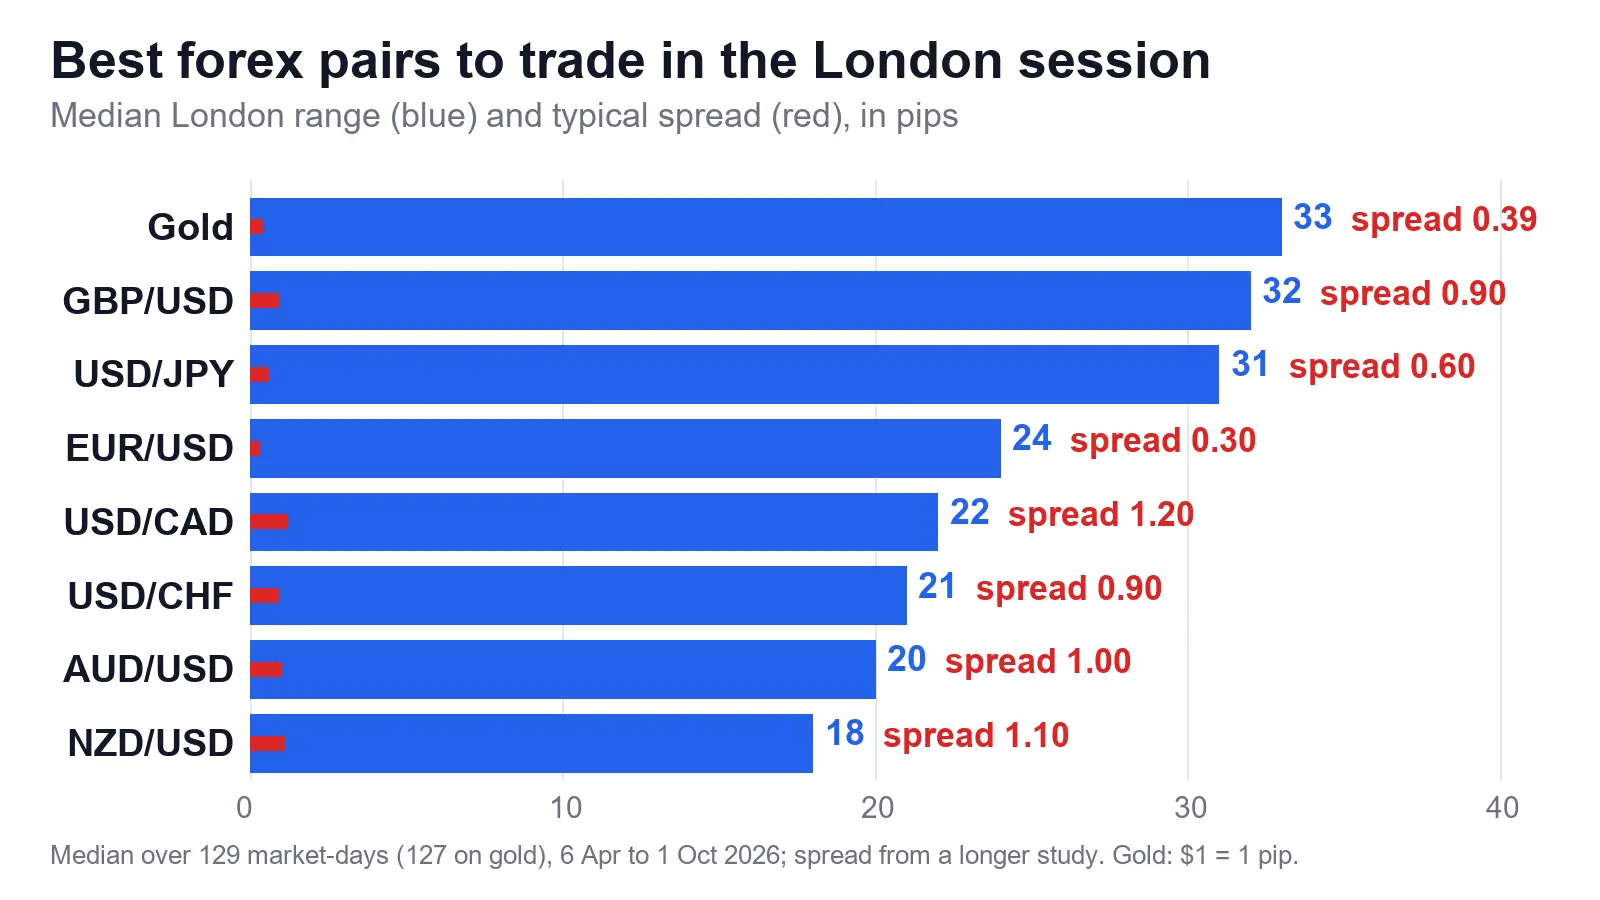
The best forex pairs to trade during London session, by what we counted: range, spread and hunts on eight markets, then three real mornings with limits.
8 min read
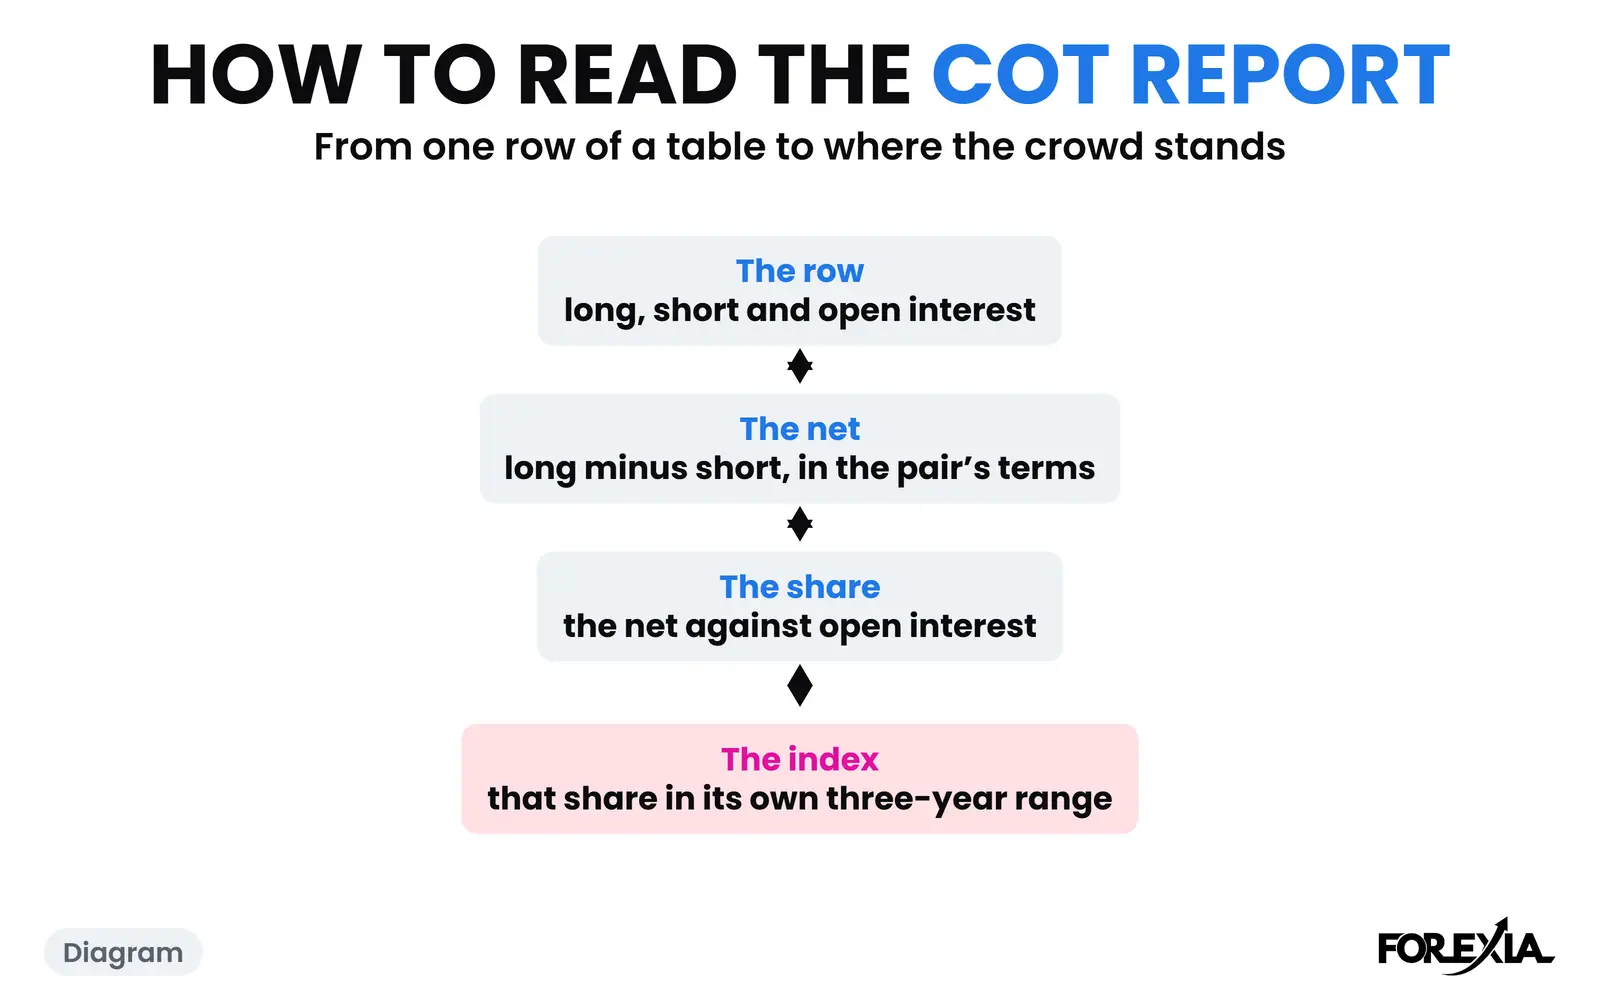
How to read the COT report on one real row: every column, the sums, the 0 to 100 index, how many traders the crowd really is, and what price did next.
10 min read
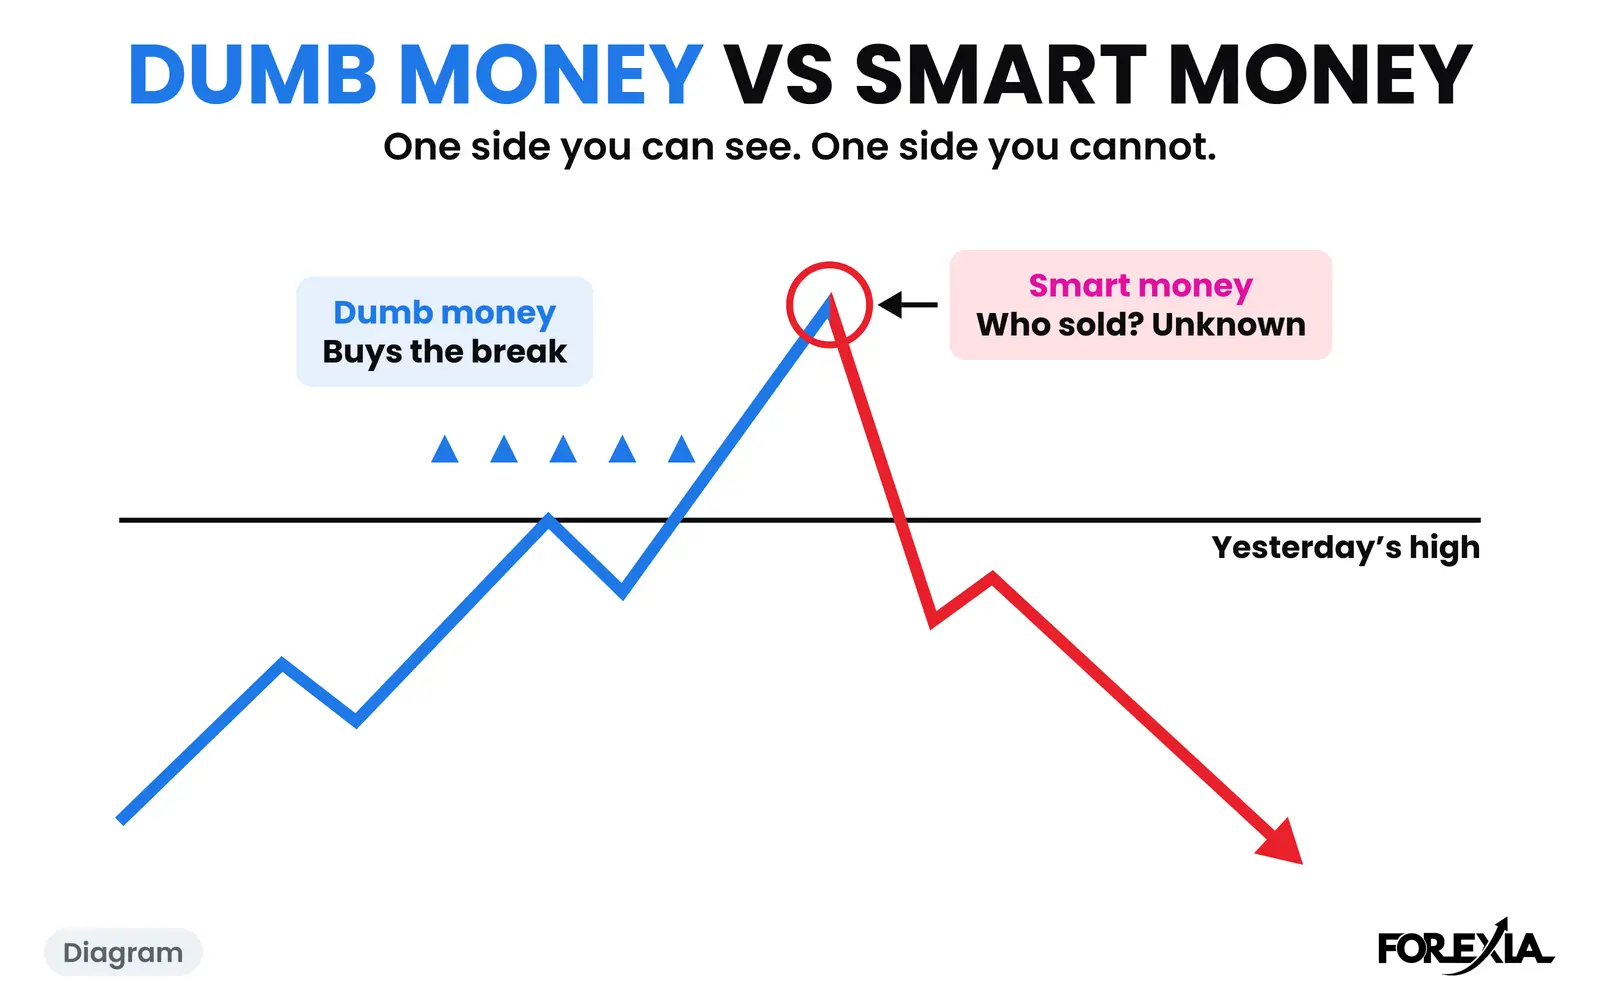
Dumb money vs smart money in forex: one side you can read and one you cannot. A real EUR/USD day where the crowd was caught, and another when it was right.
7 min read
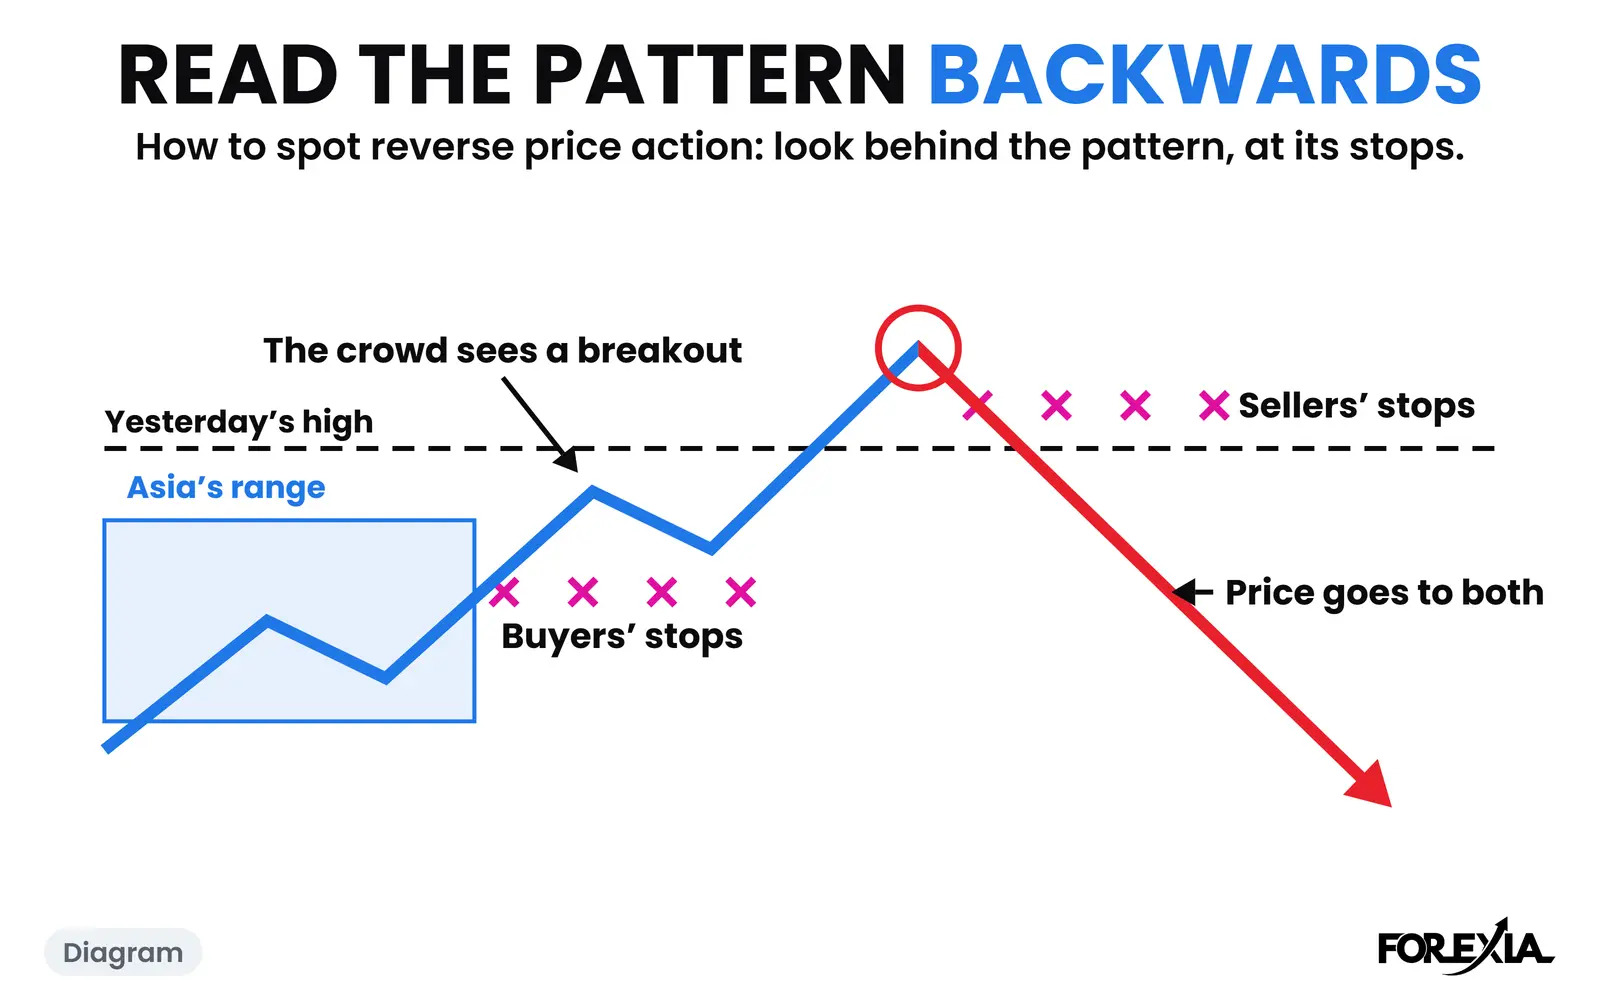
How to spot reverse price action: what to look at behind a pattern, who it traps and where their stops rest, on gold, 25 September 2026, and USD/CHF.
7 min read
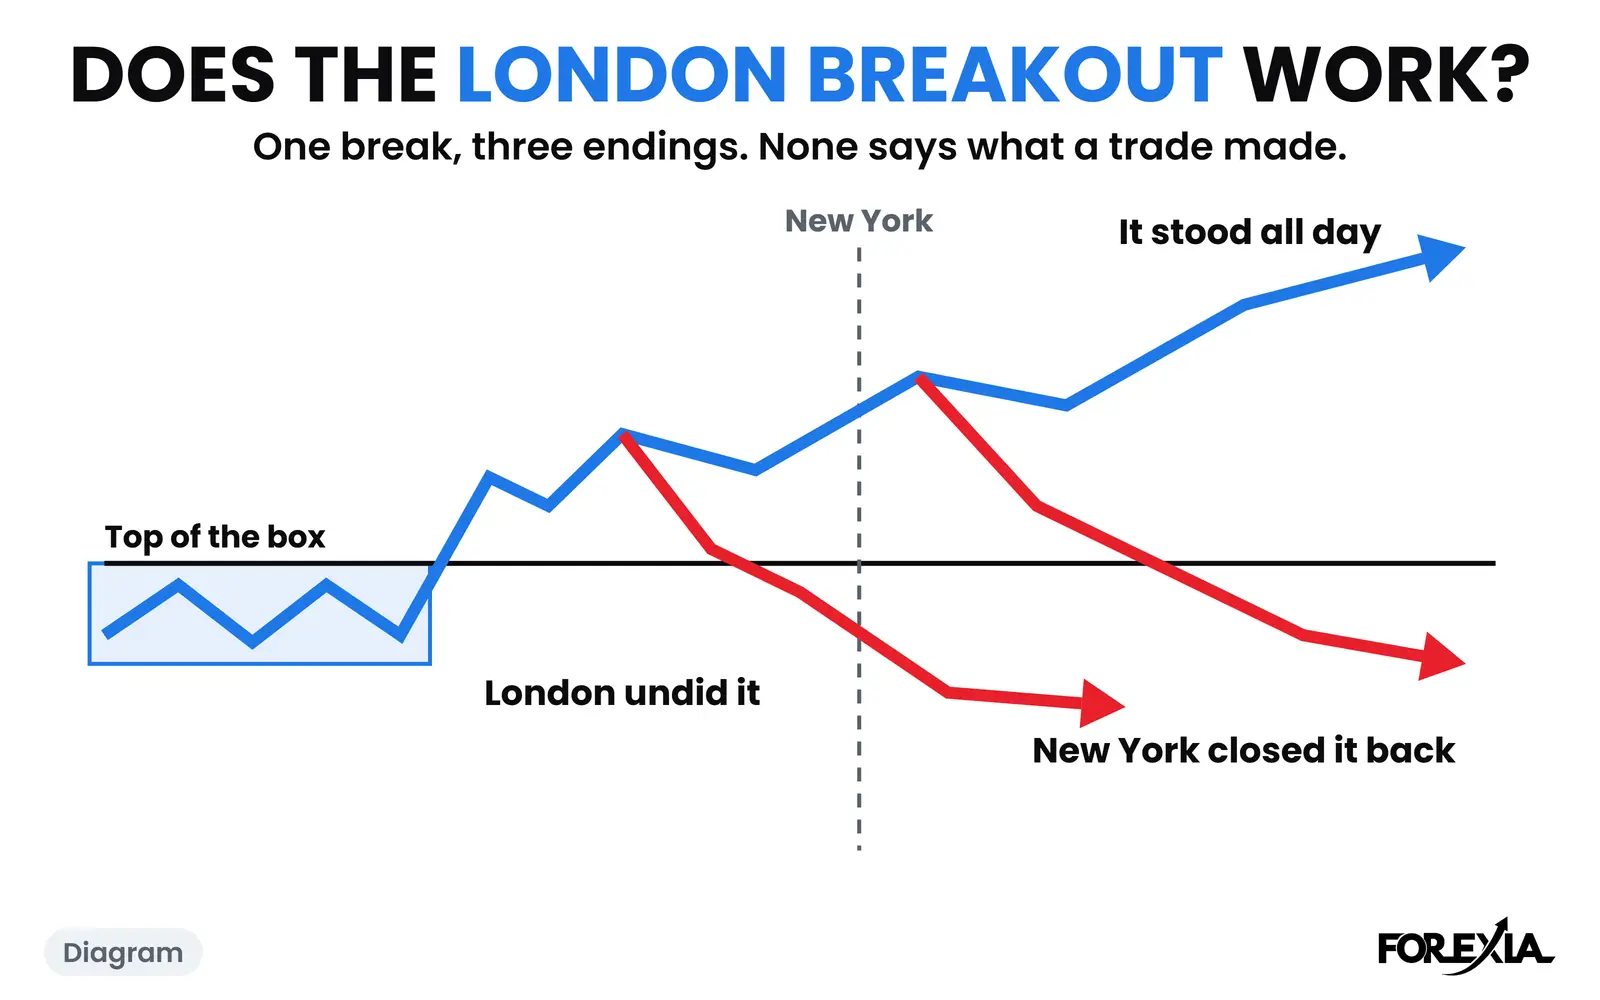
Does the London breakout strategy work? Real days on GBP/USD and AUD/USD, a count of 745 breaks, and exactly what that count cannot tell you about a trade.
10 min read
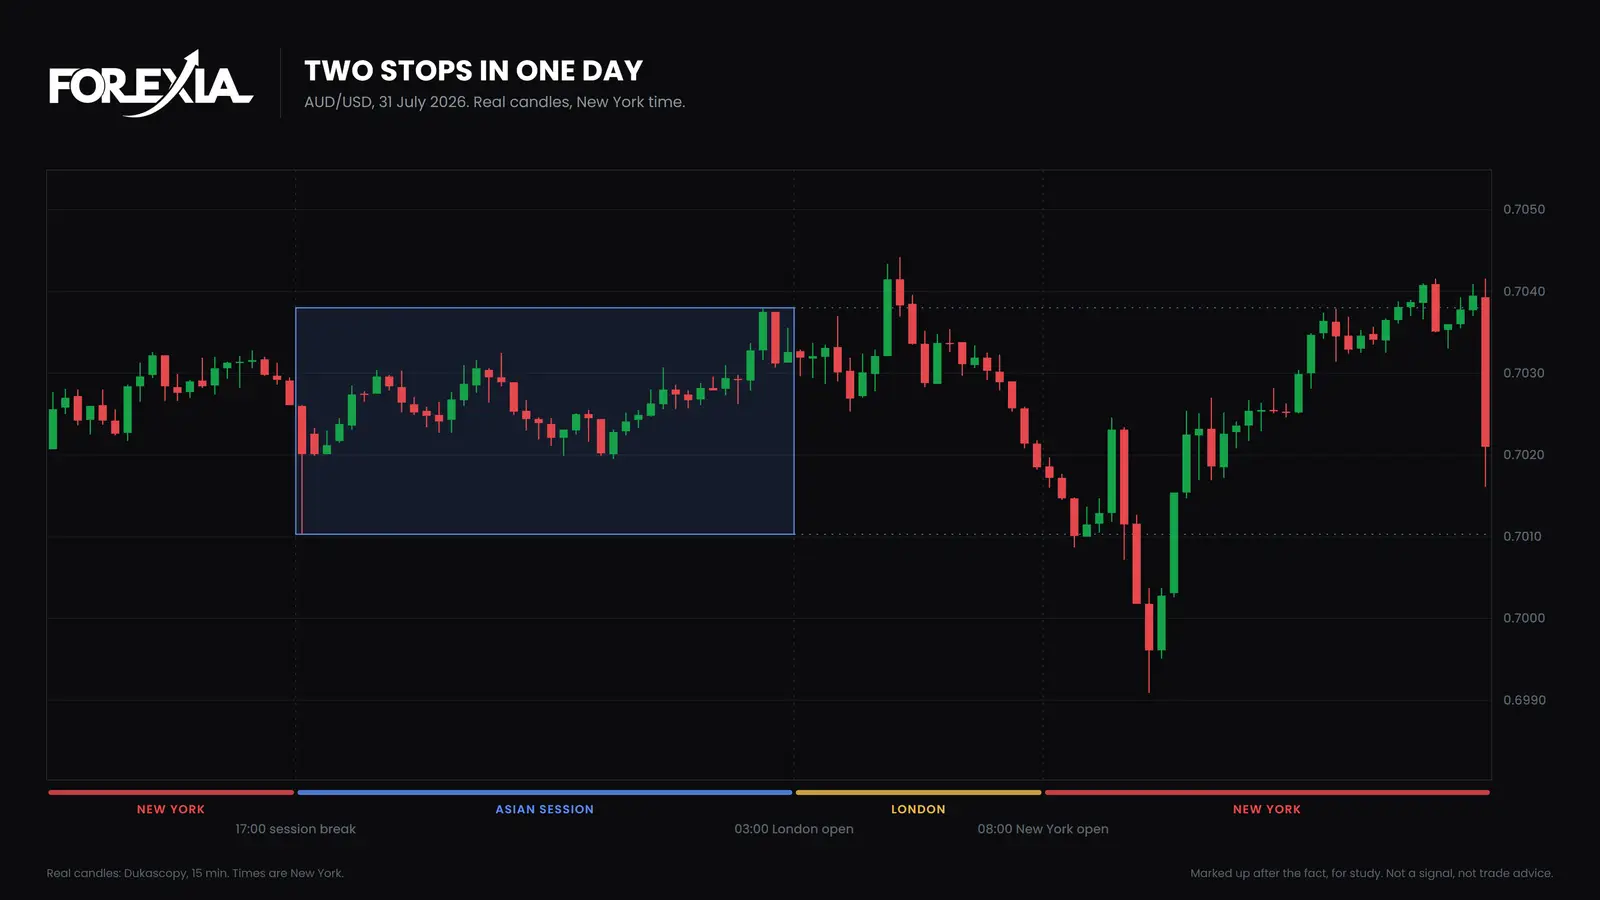
How to stop revenge trading: our untested routine for the 15 minutes after a loss, a check on your history, two real days, and what research does not show.
9 min read
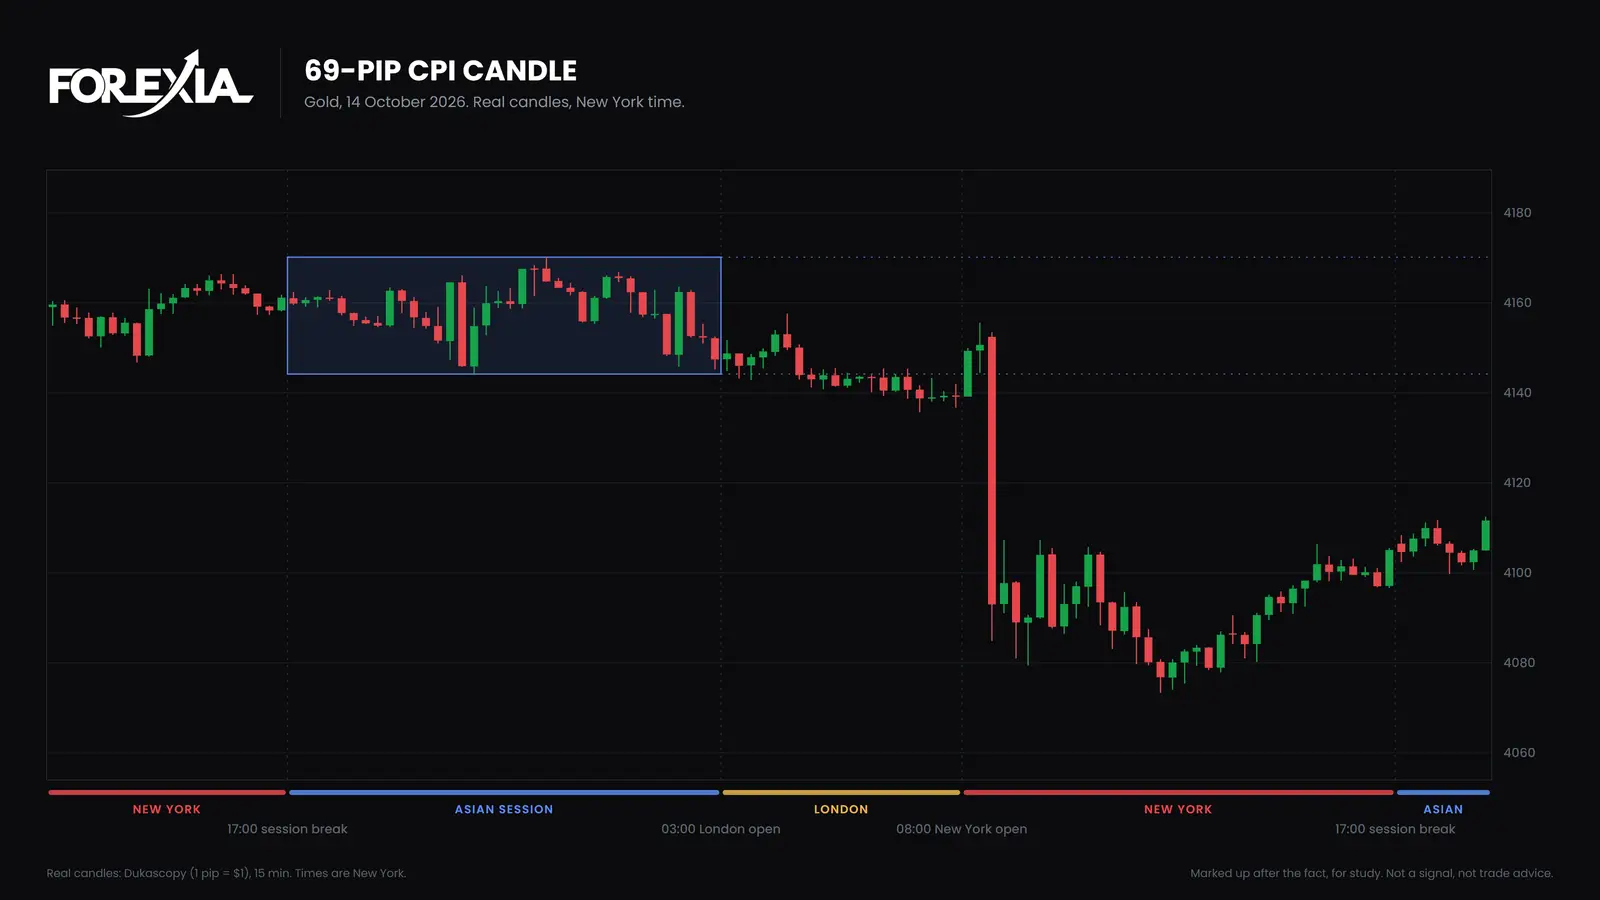
How to trade CPI: EUR/USD and gold in the first minutes of seven real releases, on our own candles, and what our numbers do and do not support.
12 min read
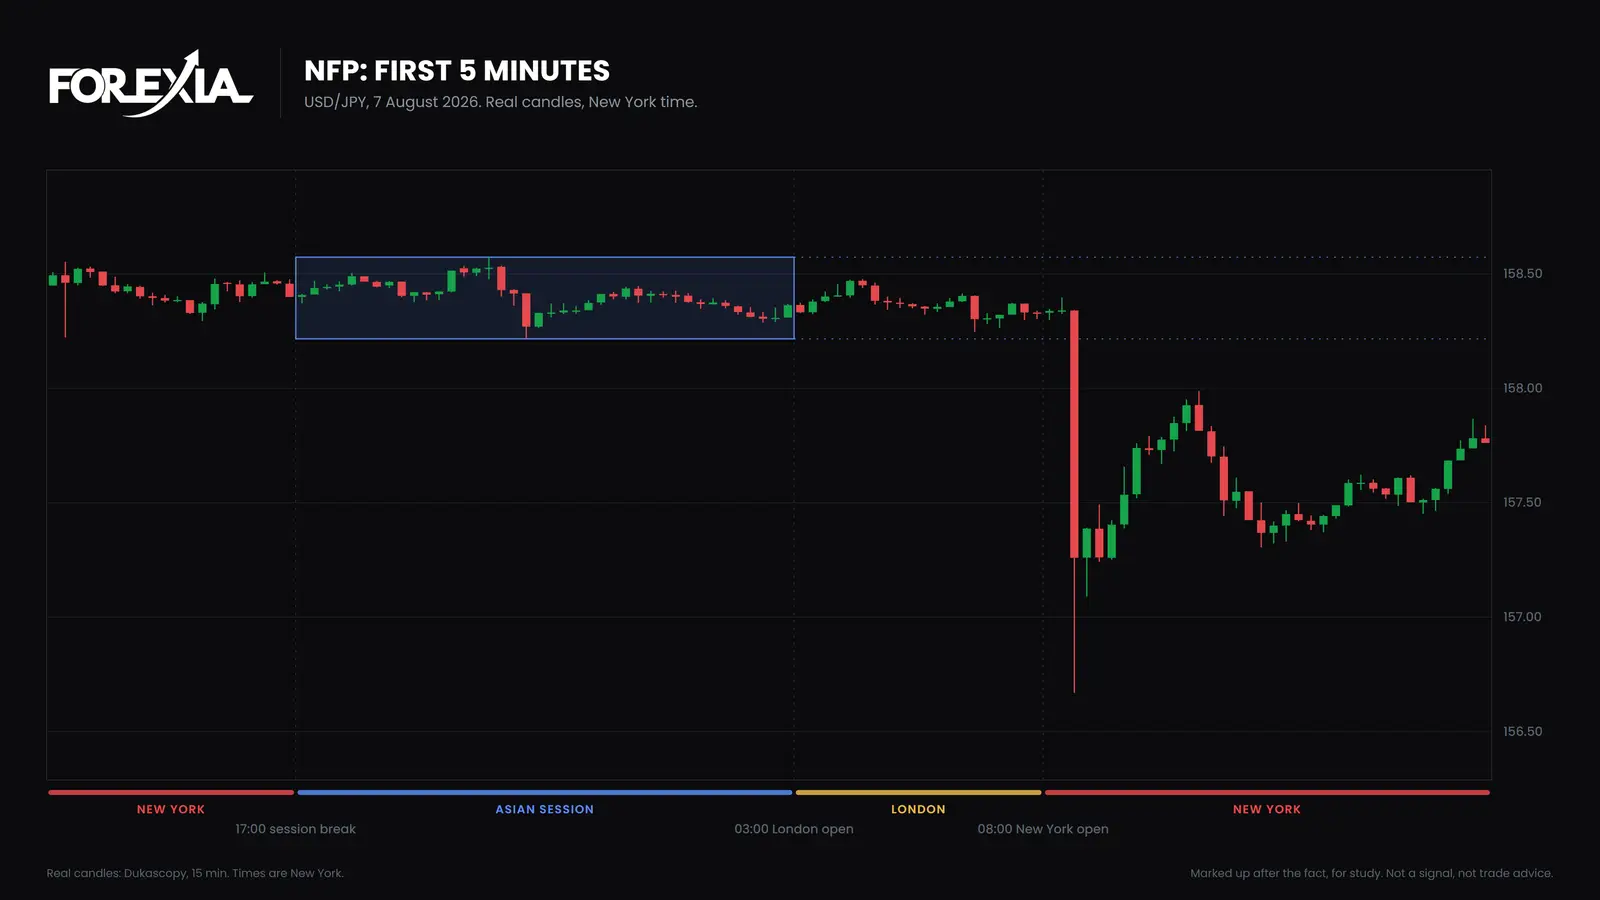
How to trade NFP: the first five minutes of six real reports on our own candles, what the textbook's plans met, and what our numbers support.
12 min read
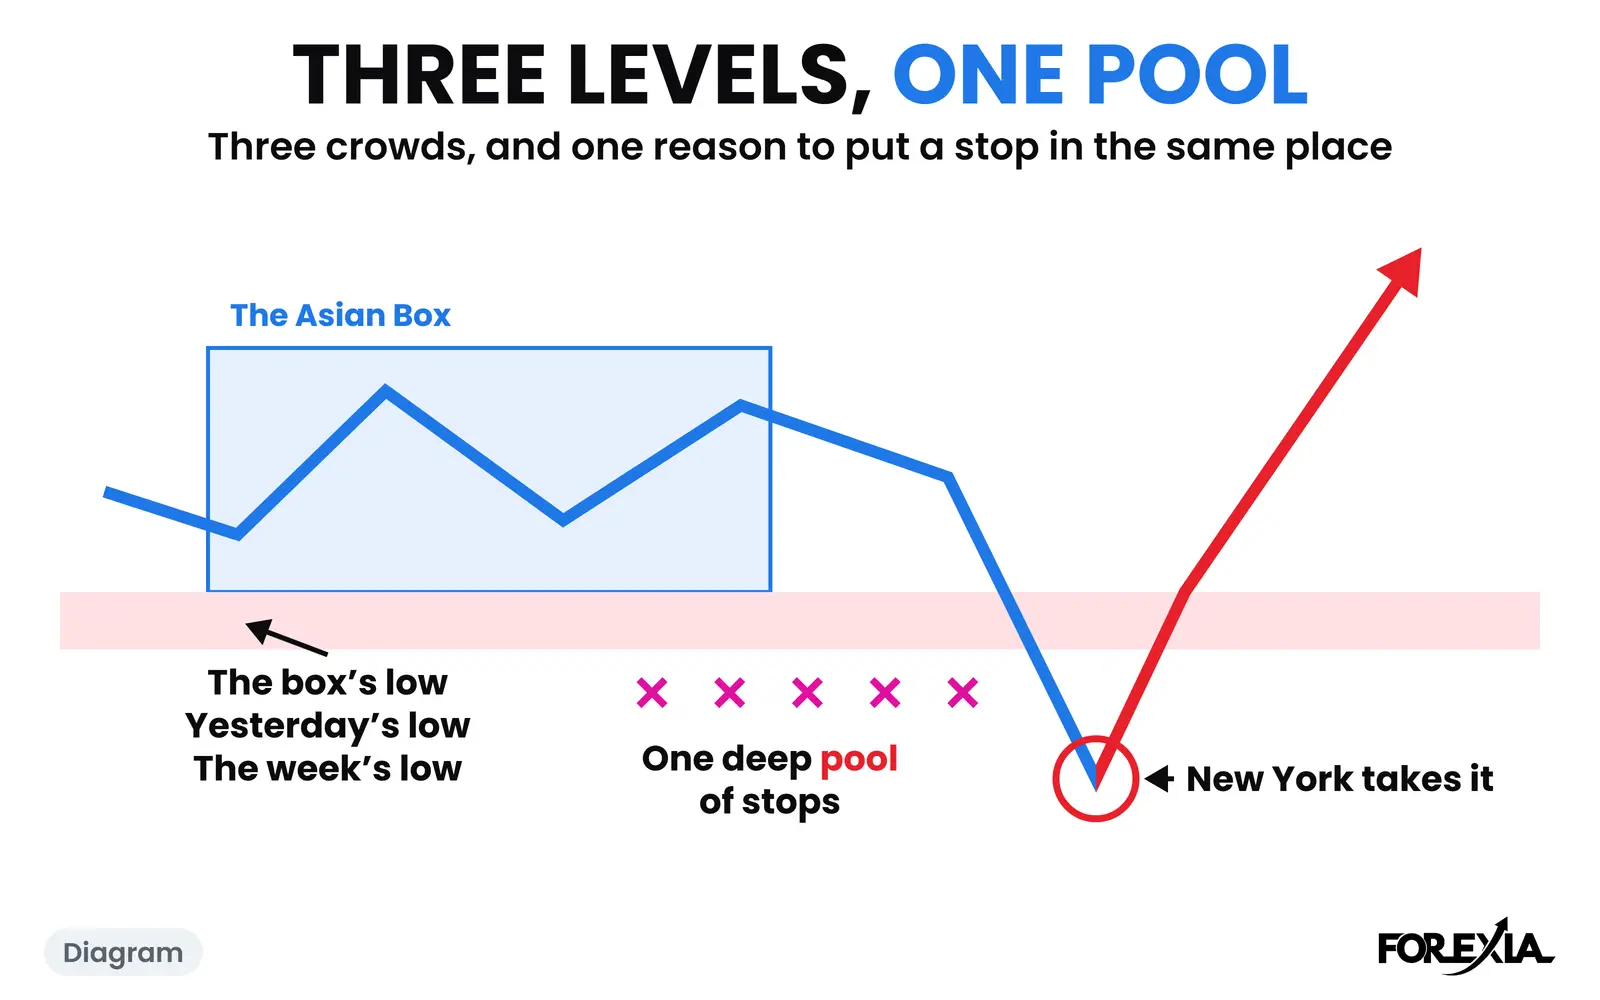
An institutional level trading strategy tested on one real day: three lines on gold within $1.36 made one pool, and New York took it on 17 July 2026.
6 min read
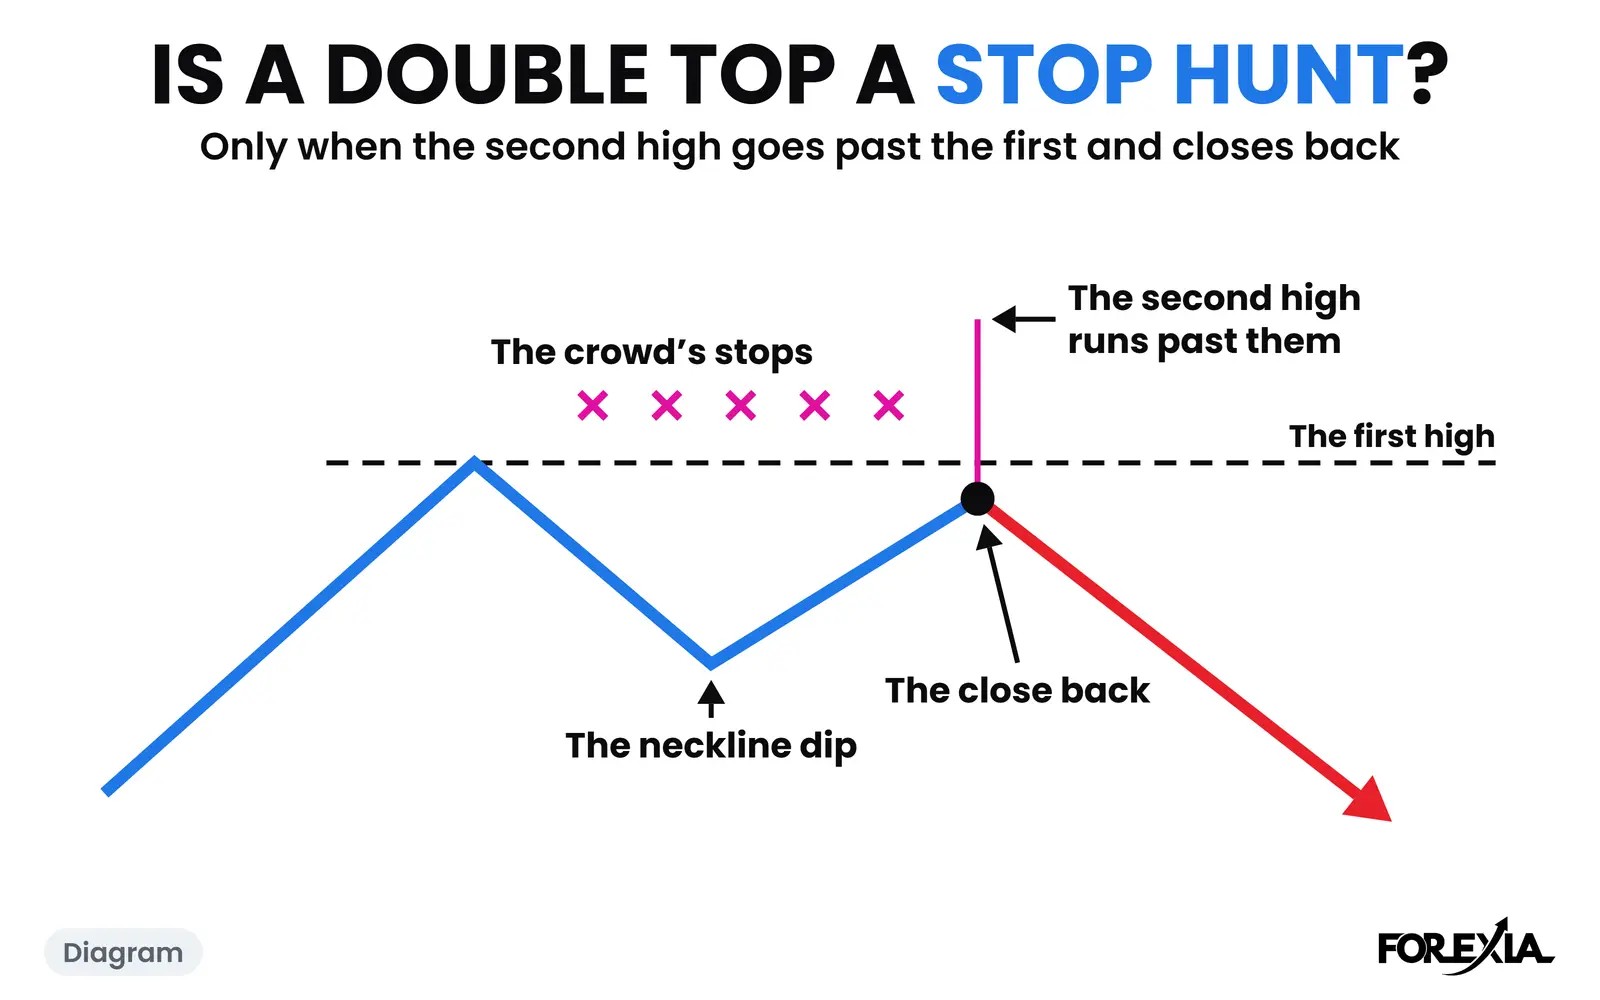
Is a double top a stop hunt? Only when the second high runs past the first and closes back. A count of 303 shapes and three real days, one that kept going.
8 min read
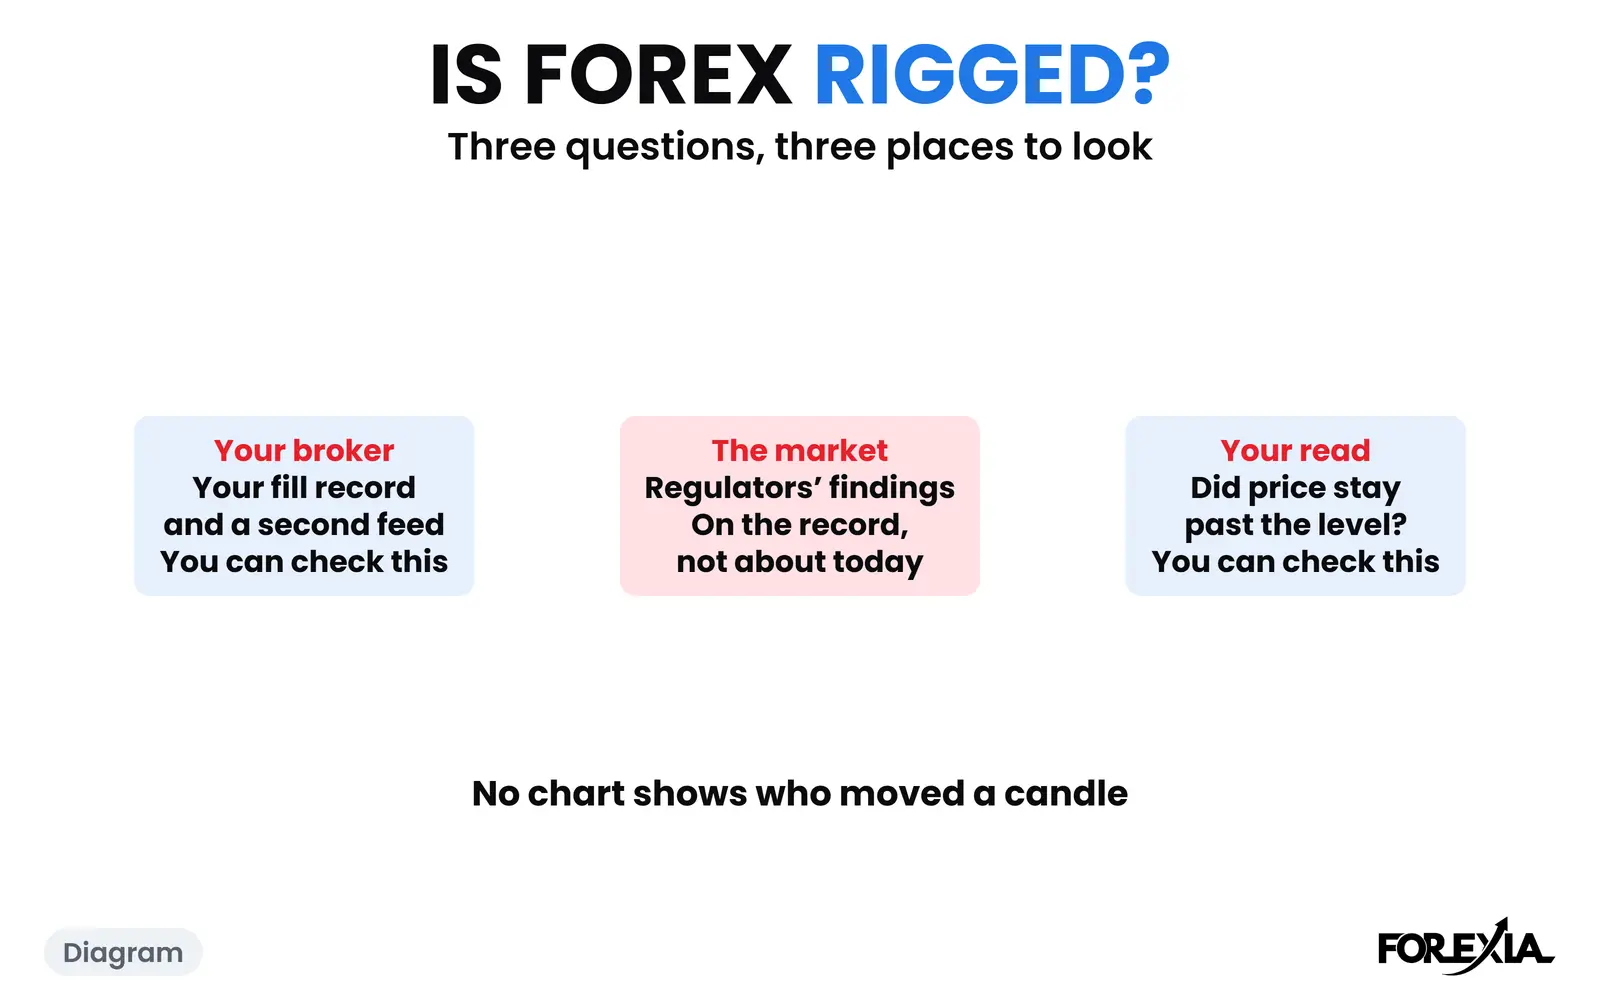
Is forex rigged? Regulators' findings at source, what a broker can do against what the market does, a check on your own fills, and three real dated days.
10 min read
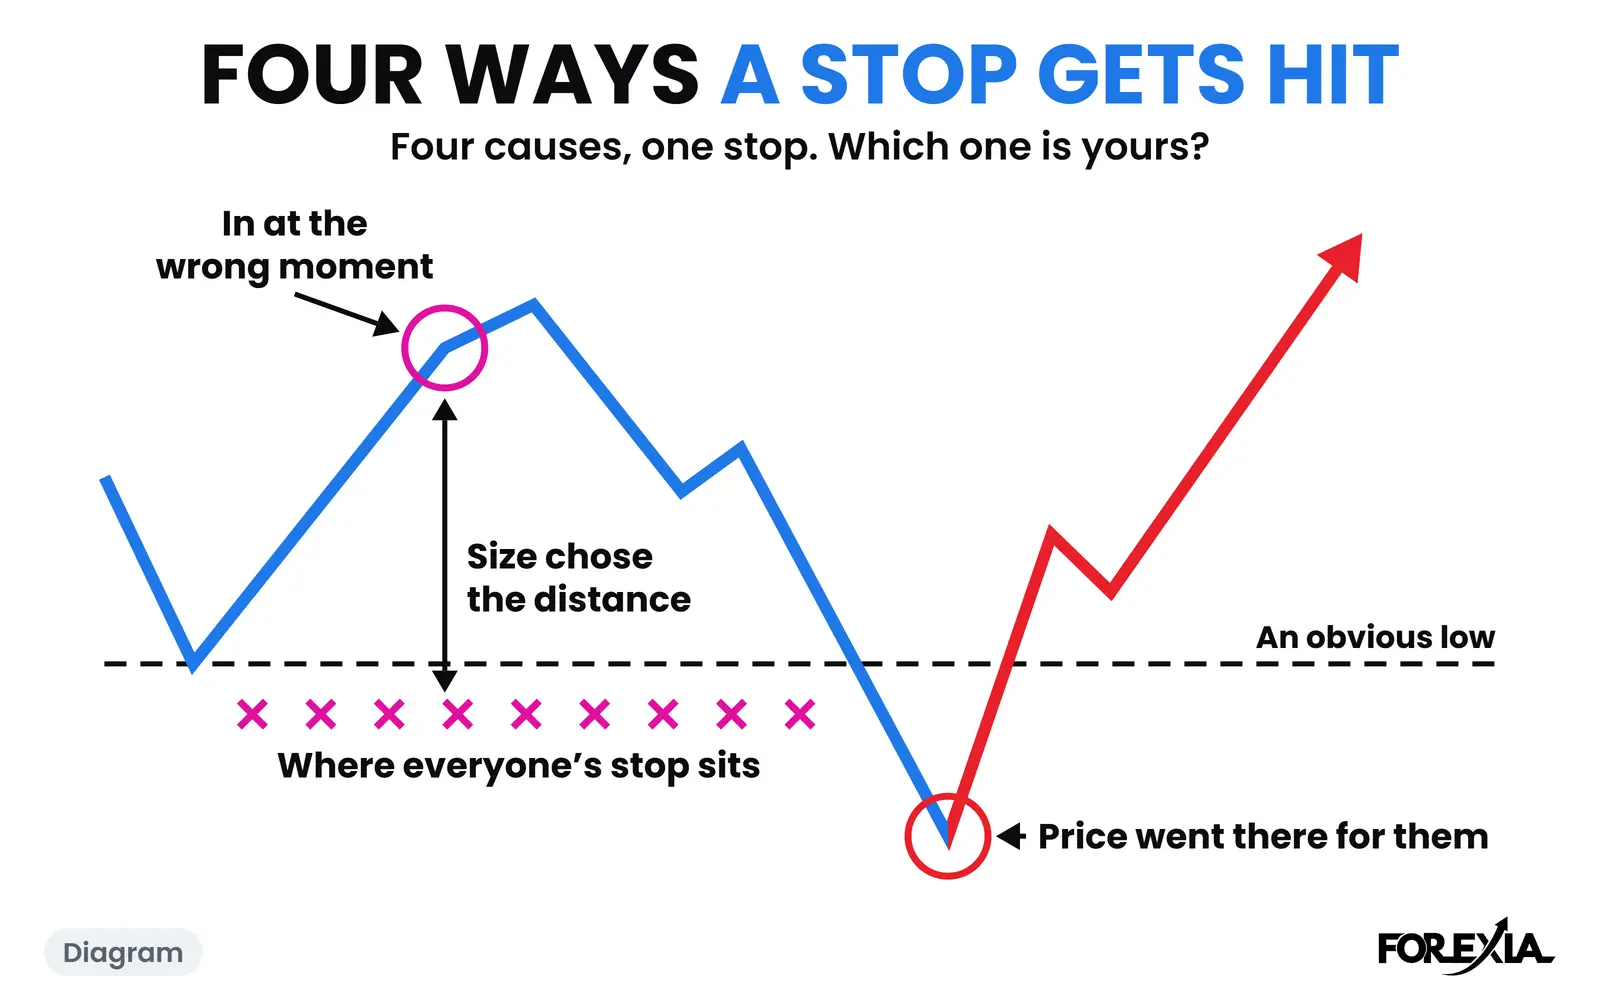
Why does your stop loss always get hit? Check your last five losses for placement, timing, size or a hunt, with three real days on our own charts.
9 min read
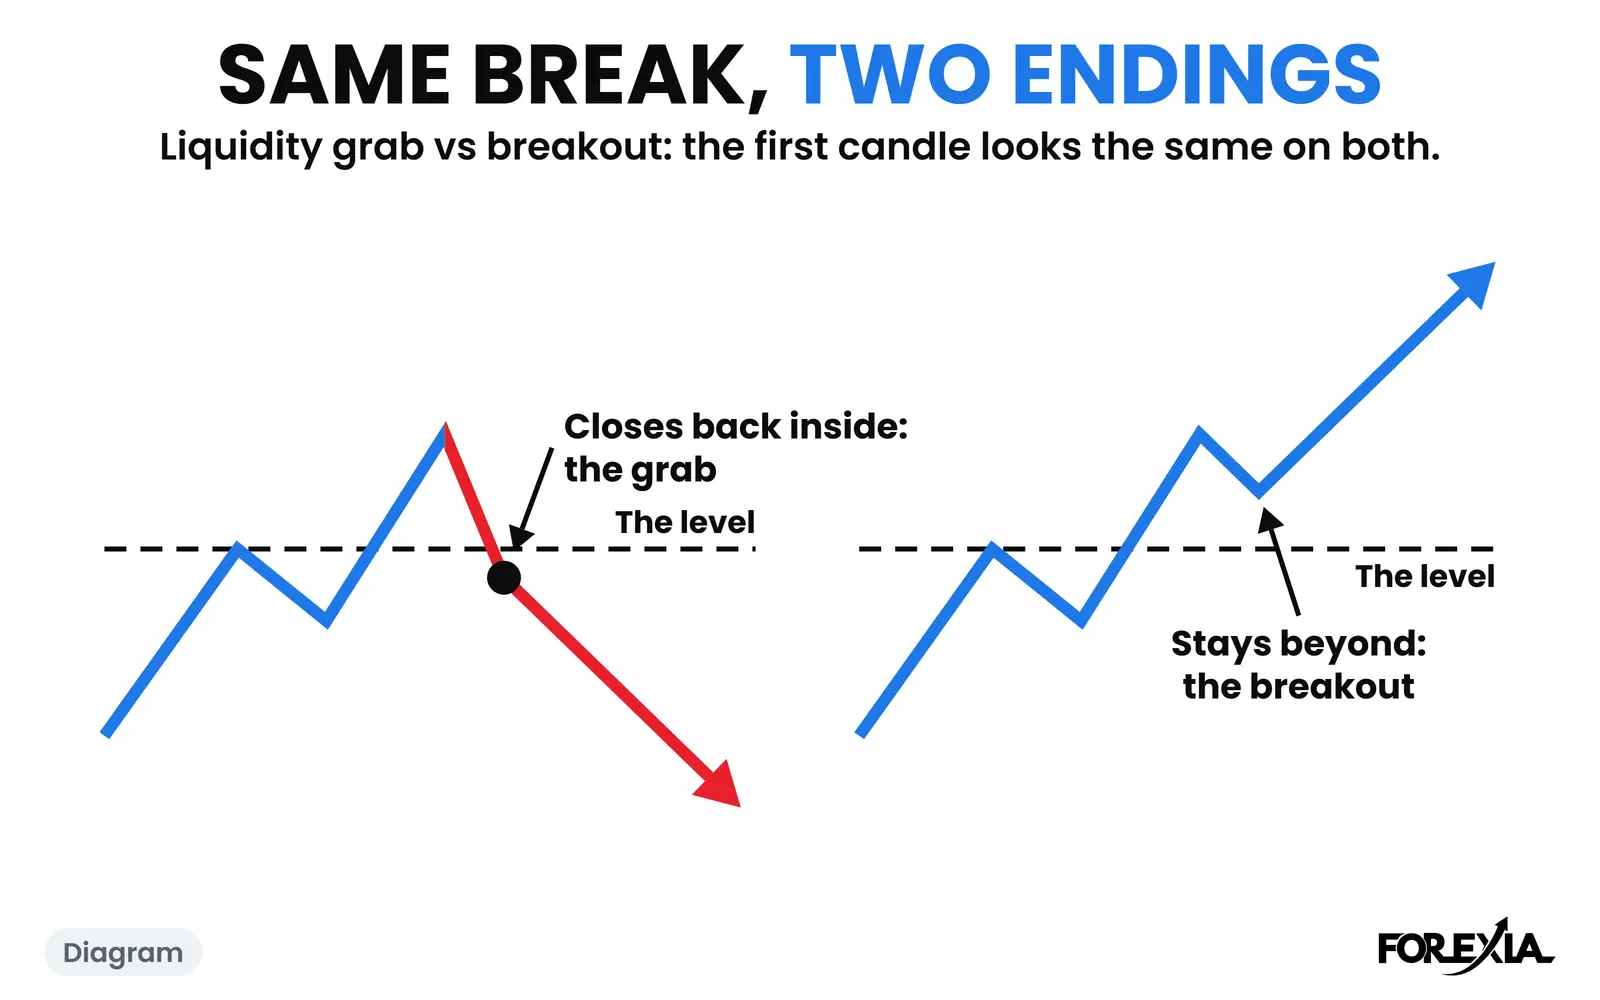
Liquidity grab vs breakout: the close back tells them apart, and even that can change. USD/CHF twice and USD/CAD in 2026, plus a count of 1,601 levels.
8 min read
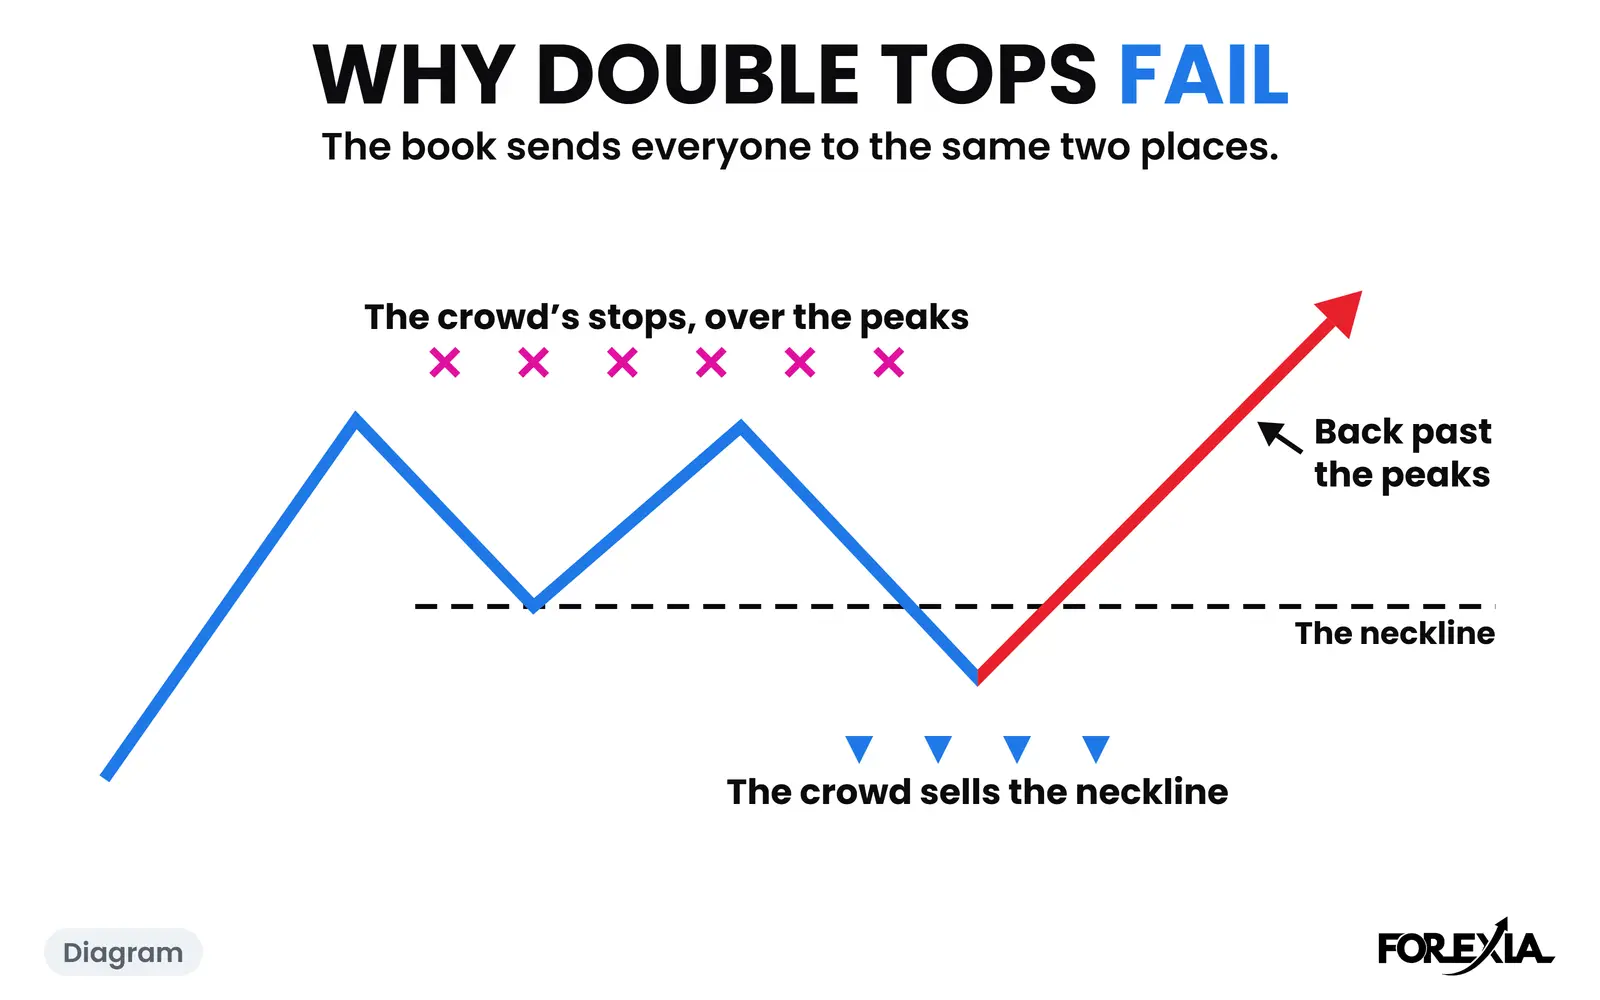
Why double tops and double bottoms fail: the book sends everyone to the same places. A count of 983 shapes and two real days from August 2026, with prices.
8 min read
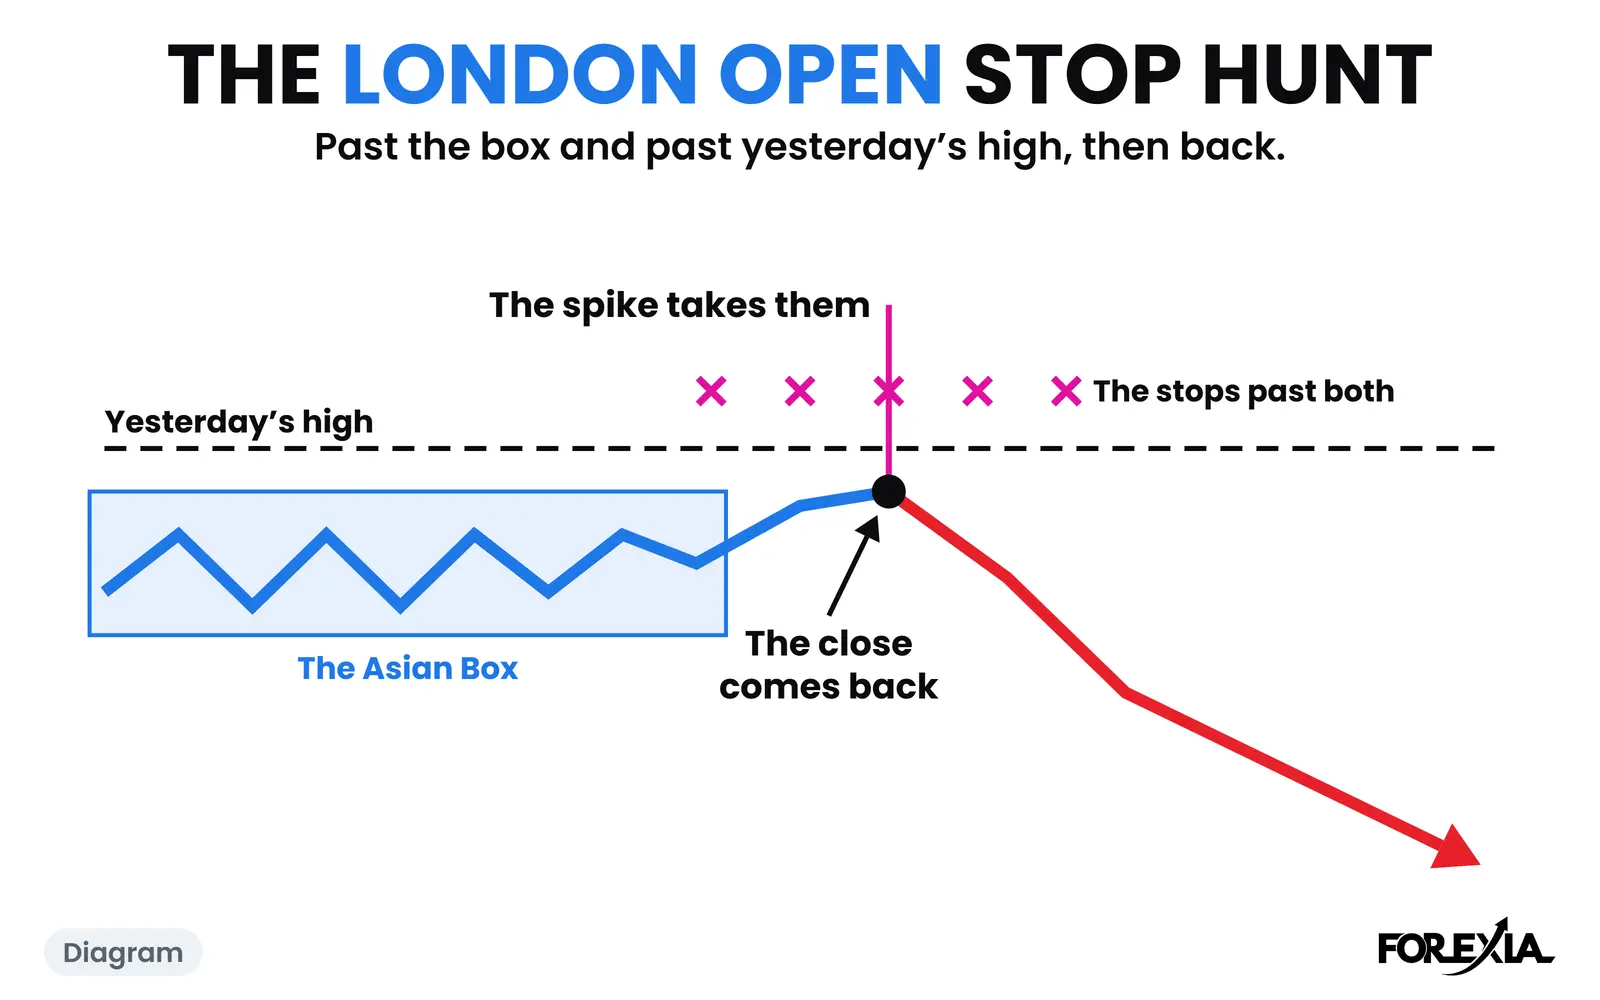
A London open stop hunt past yesterday's extreme on EUR/USD and gold, a day the break stayed, and a count of how often that level closed back the same day.
7 min read
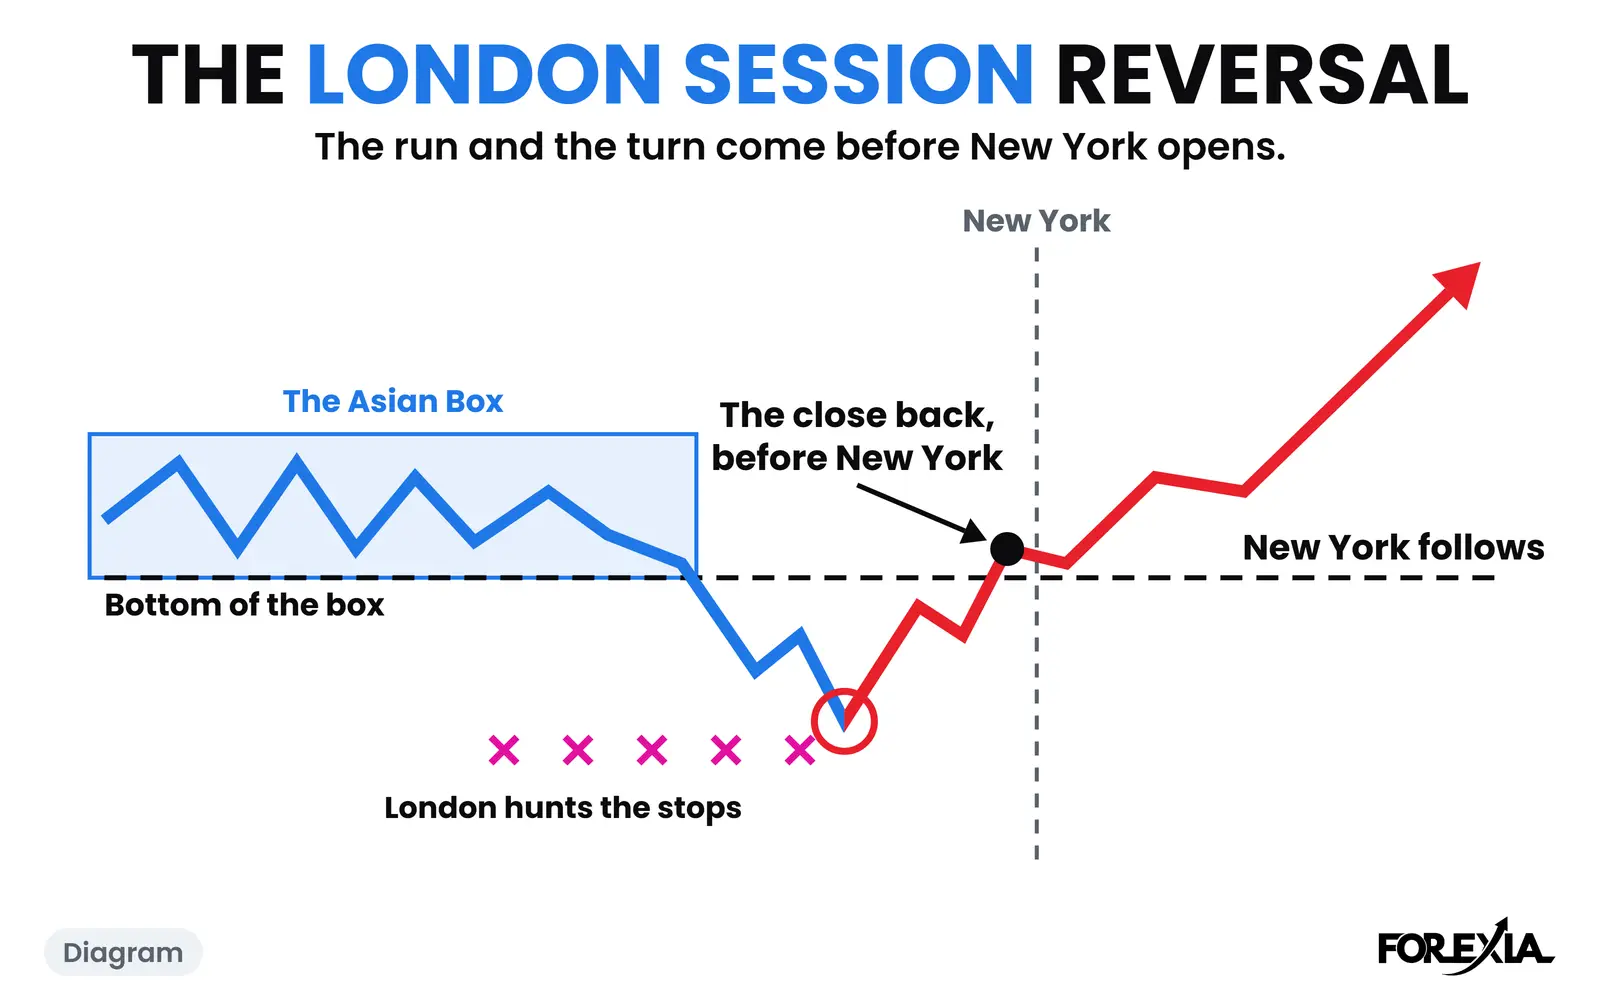
A London session reversal on three real days, EUR/USD and GBP/USD: the stops run and the turn come before New York opens. How often it happens.
8 min read
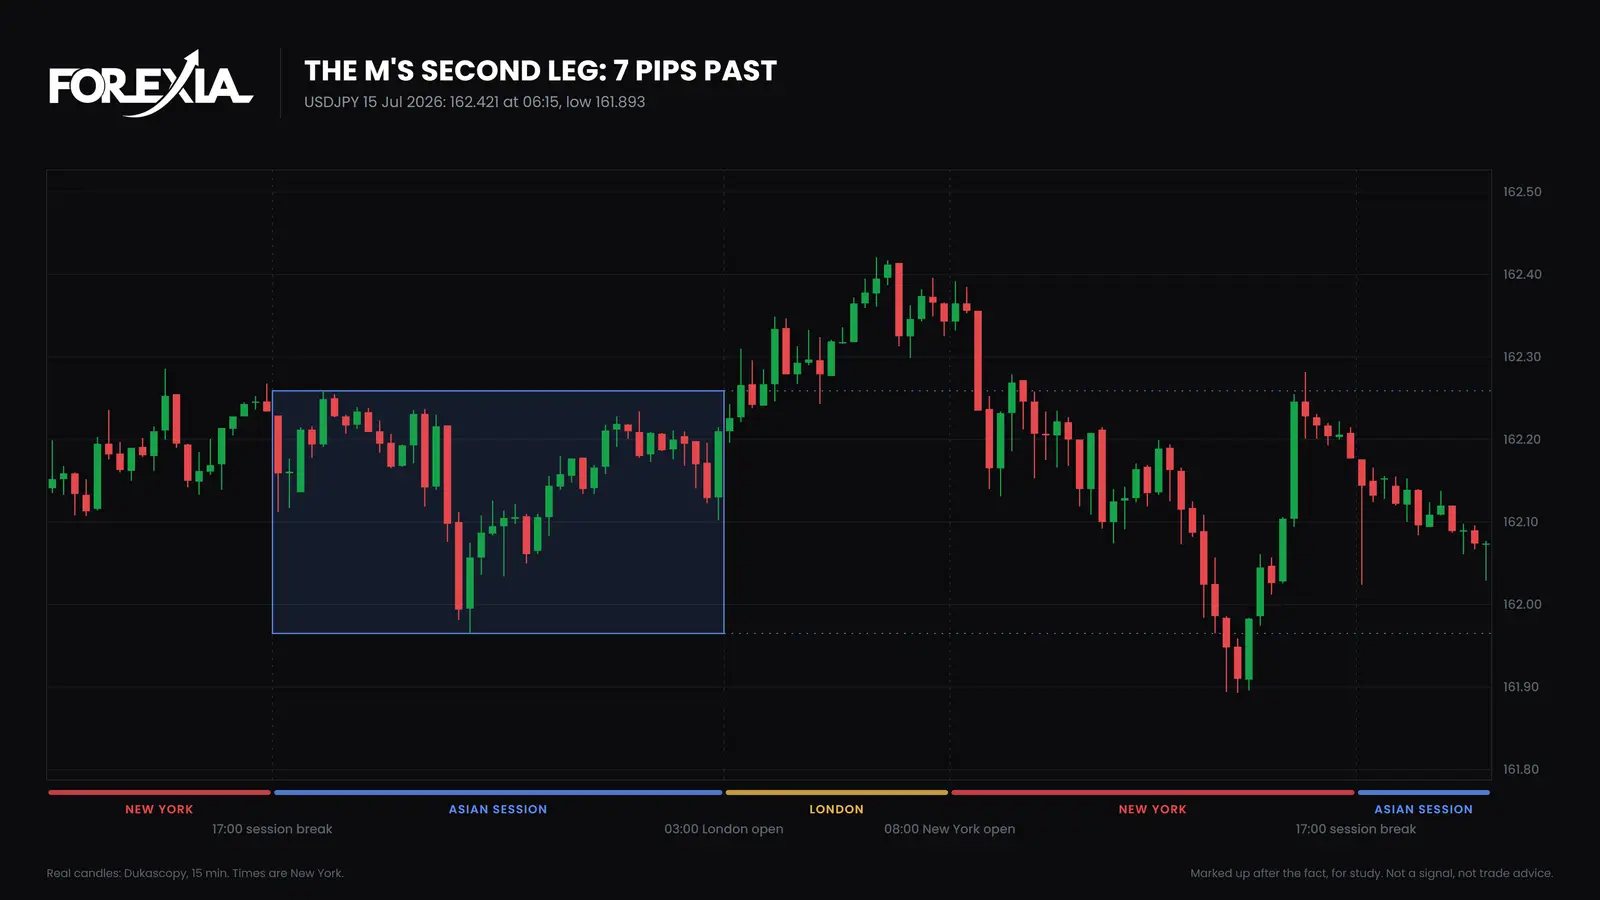
M pattern forex: what the M and its W twin trap, why a clear Asian range matters, and how each one played on USD/JPY and gold in 2026, with real prices.
8 min read
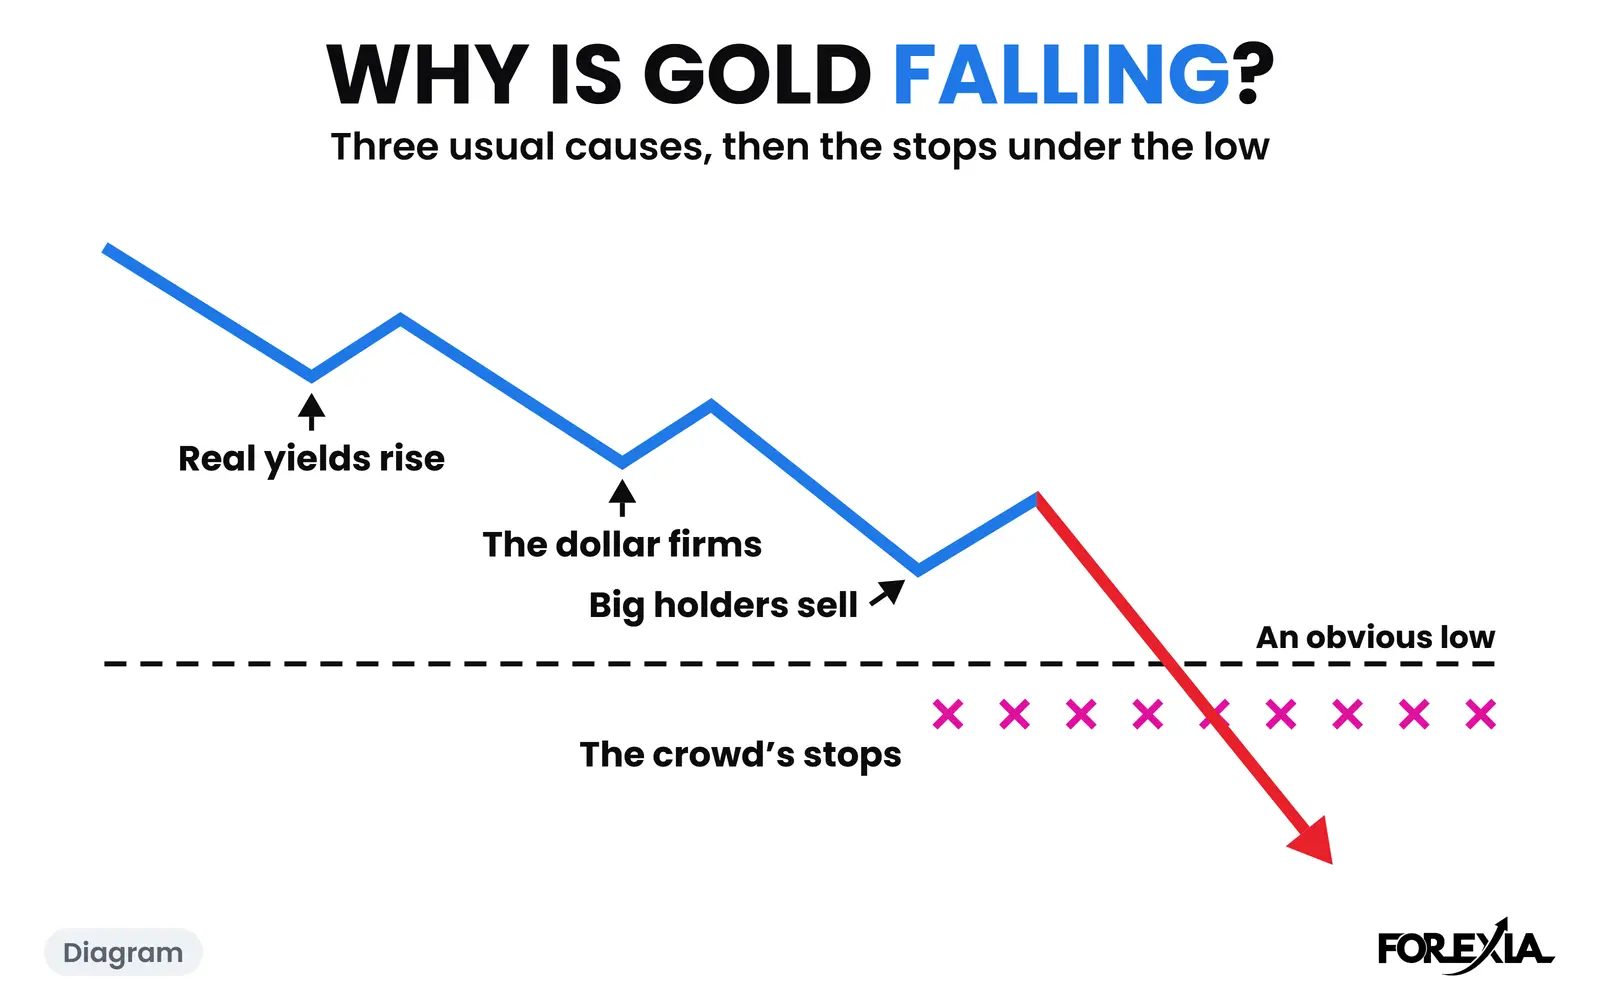
Why is gold falling? The latest fall, 147 pips on 30 October 2026, checked against yields and the dollar, plus the usual causes and how to check them.
12 min read
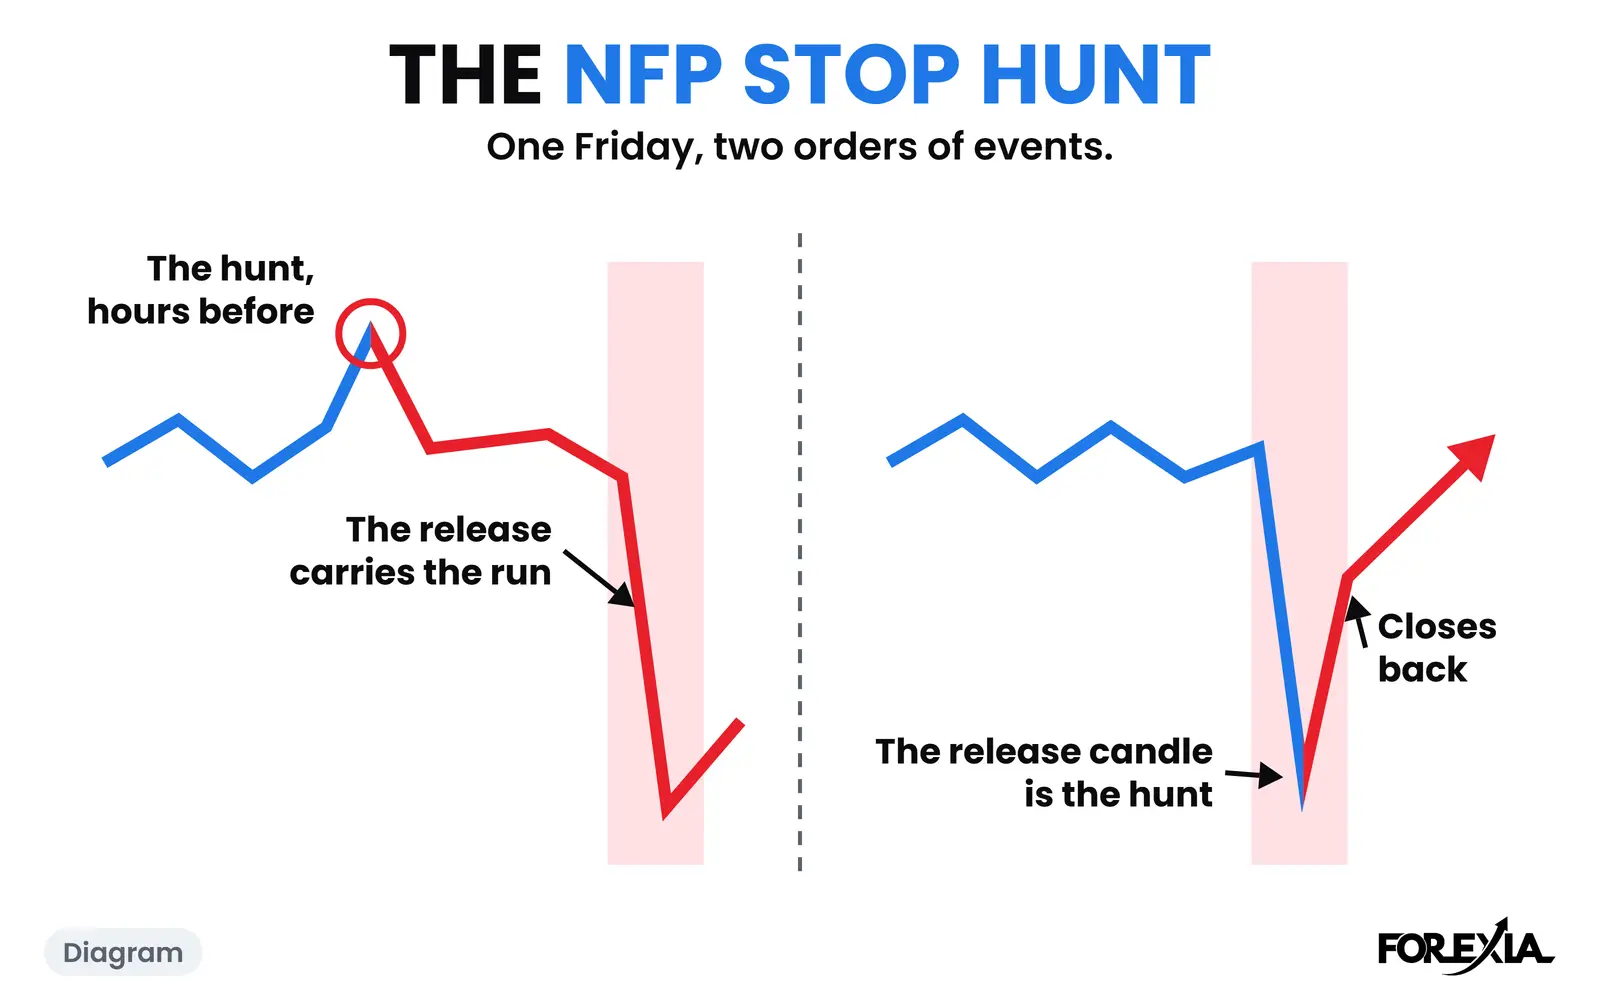
An NFP stop hunt on one real Friday: gold's came hours before the jobs report, the pound's on its first minute. Both, minute by minute, on our own candles.
8 min read
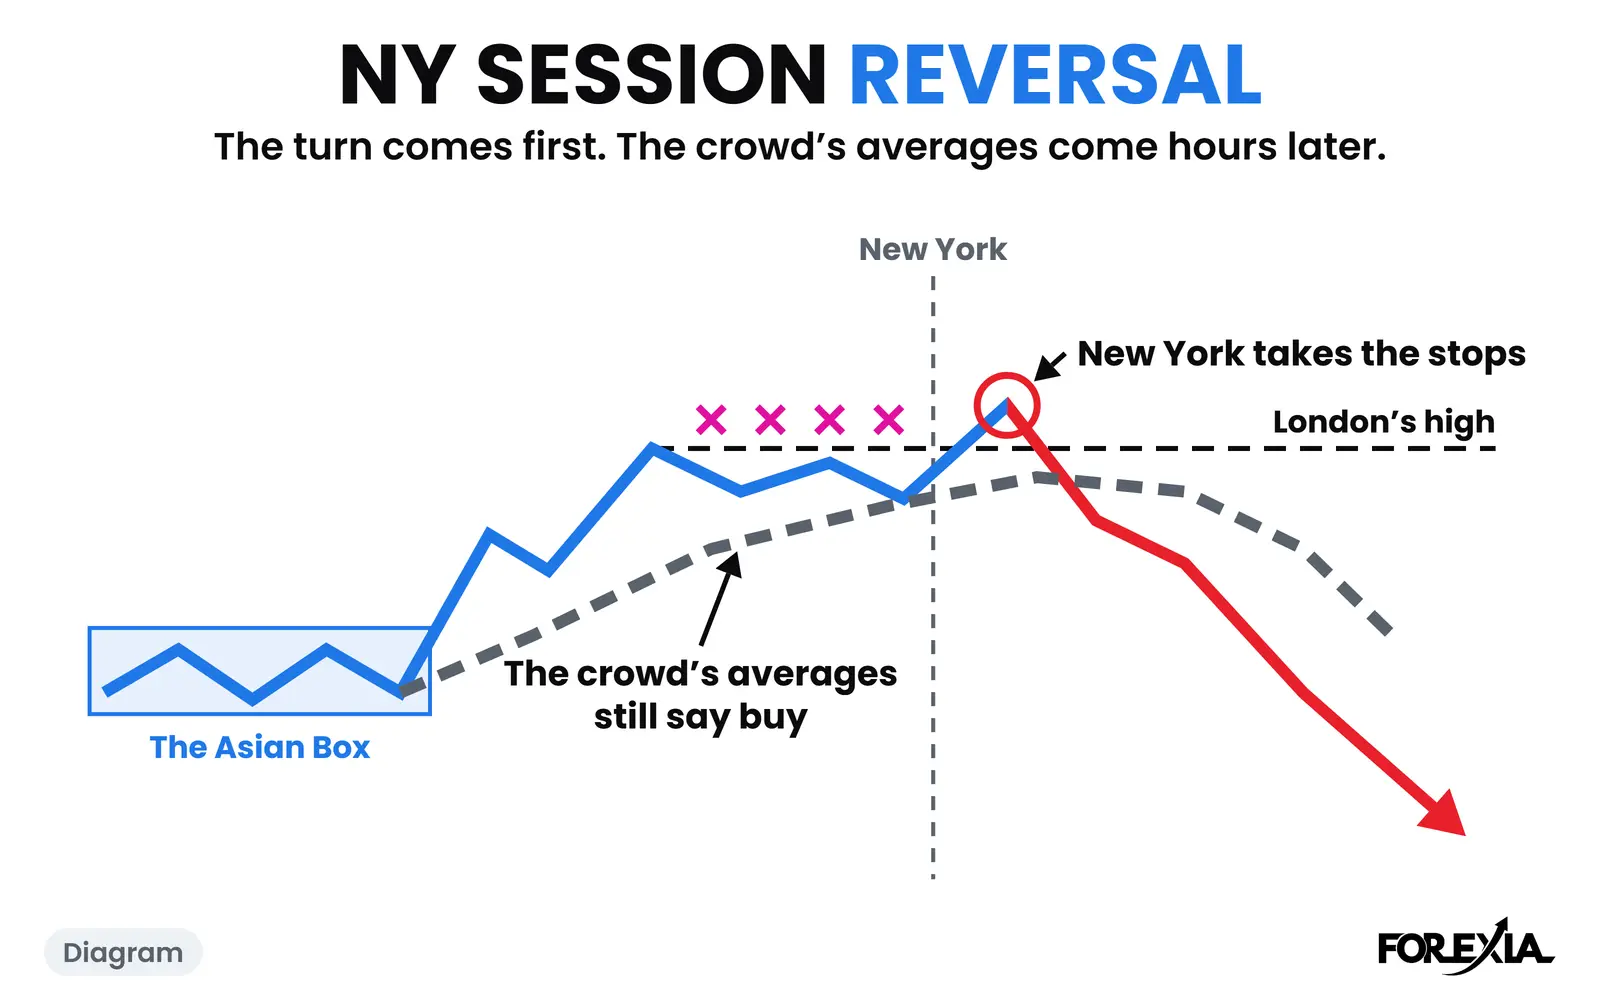
A NY session reversal on three real days, NZD/USD, EUR/USD and GBP/USD in 2026: when it comes, what the crowd's averages said, and one that stopped short.
9 min read
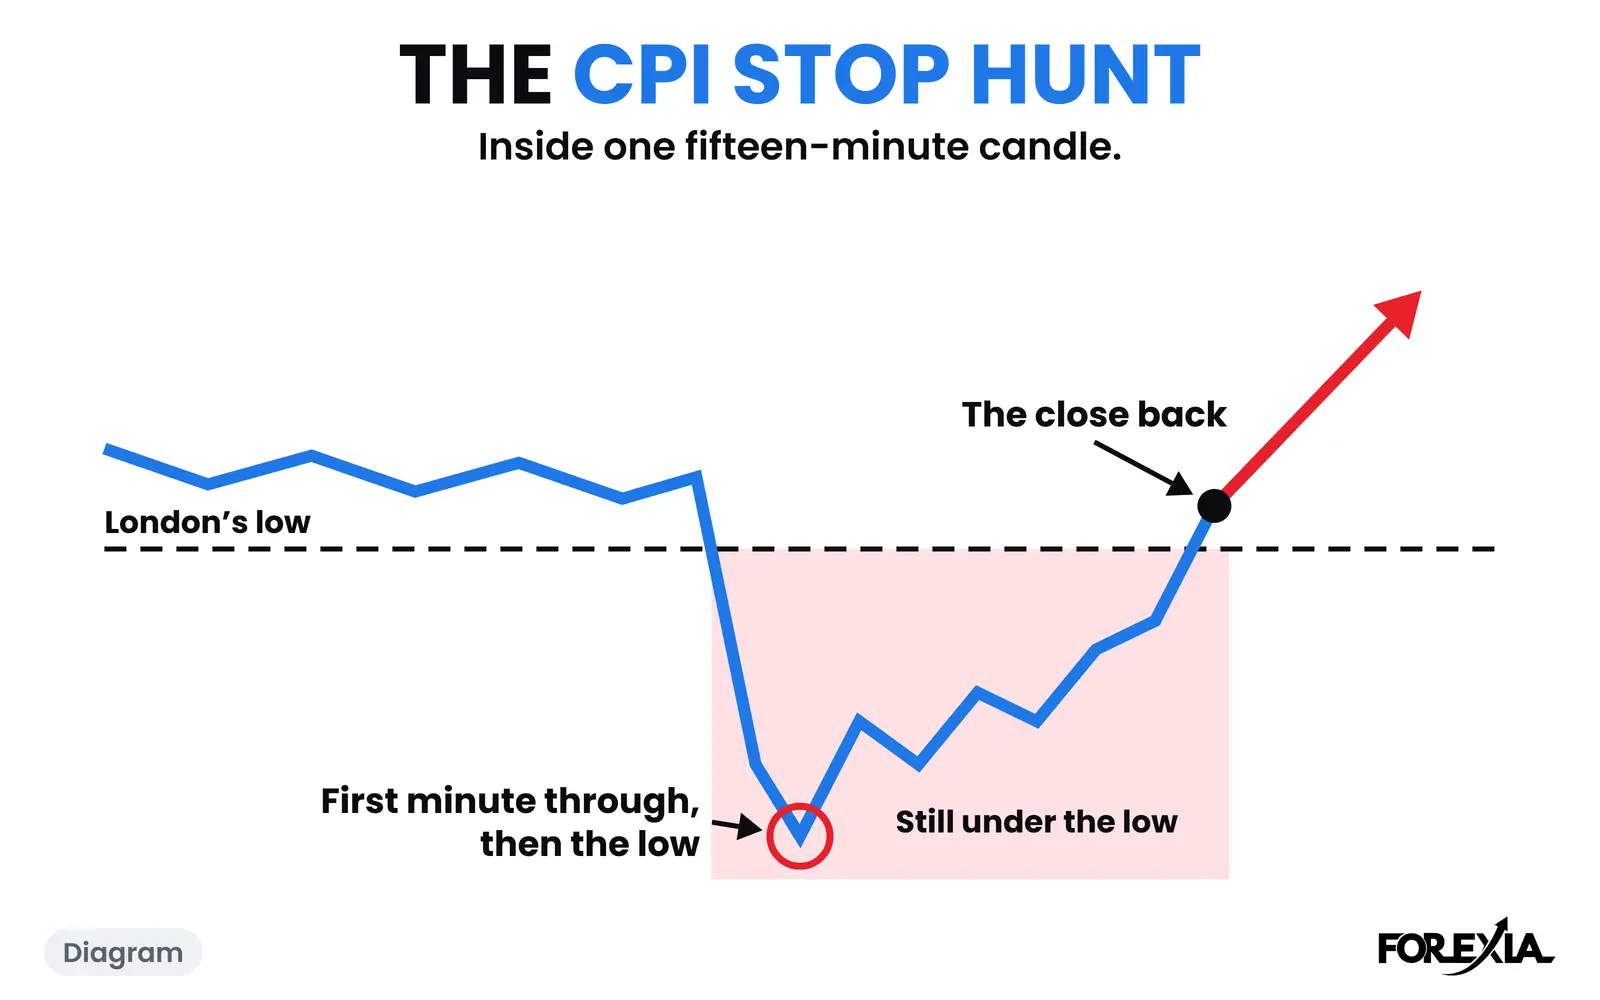
A CPI stop hunt on EUR/USD, 11 September 2026, by the minute: London's low, the 8:30 candle through it, the close back, and a morning that took nothing.
9 min read
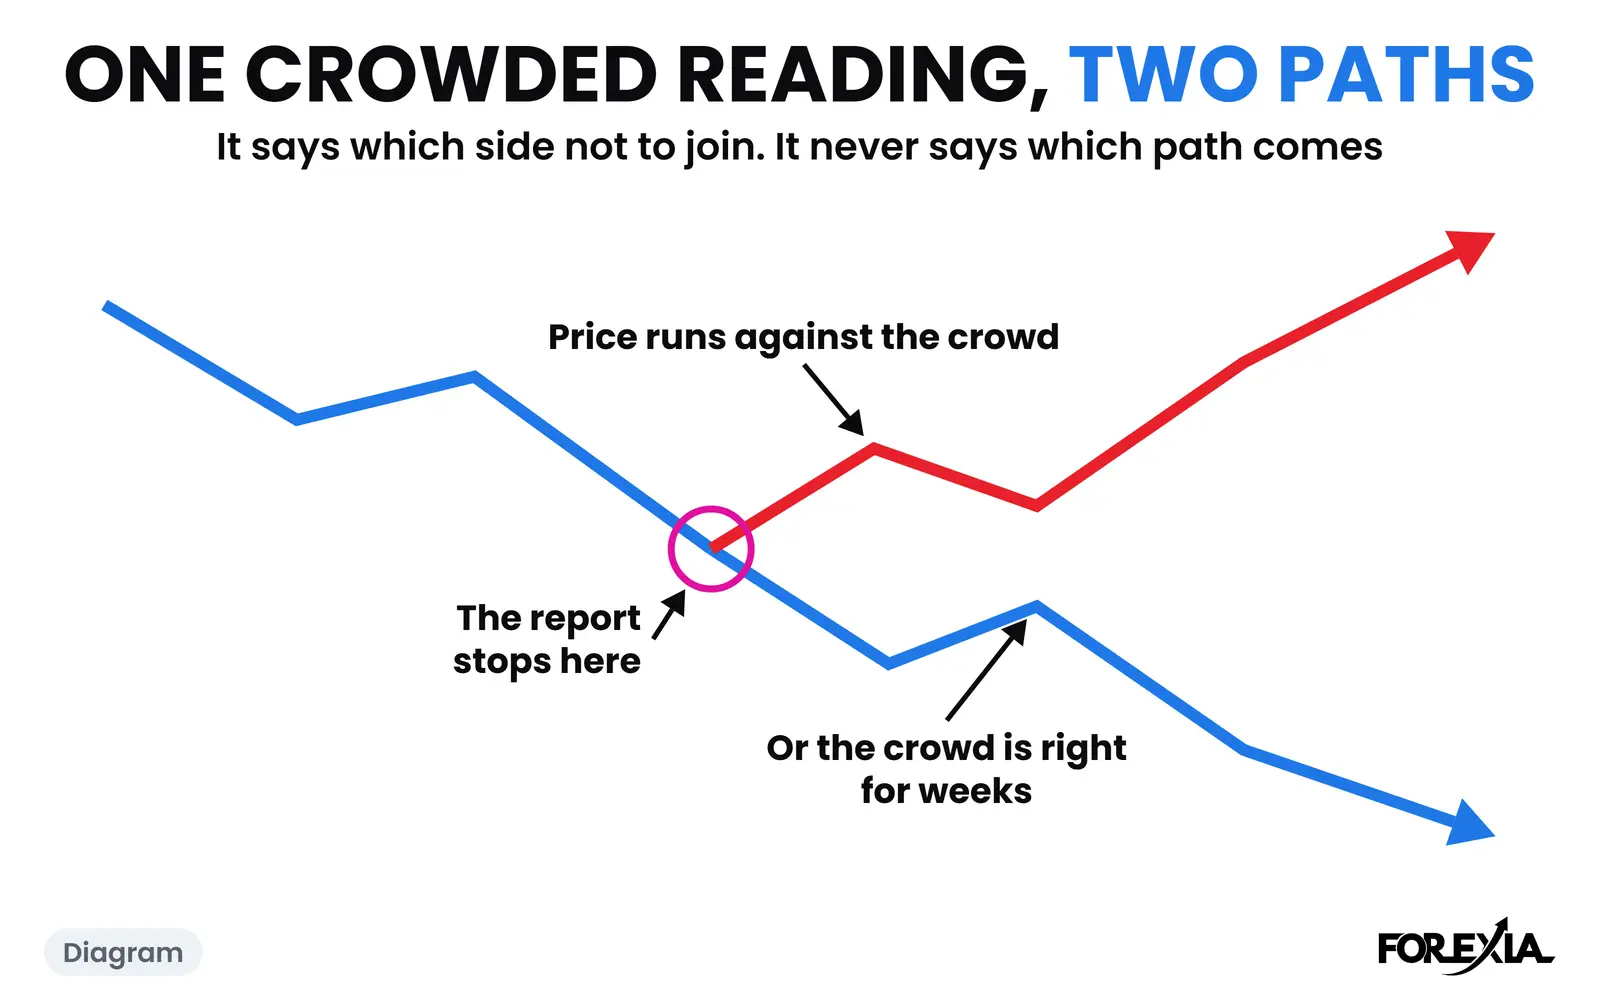
A COT report strategy starts by not joining a crowded side. What an extreme tells you and what it cannot, on two real reports: EUR/USD and gold in 2026.
8 min read
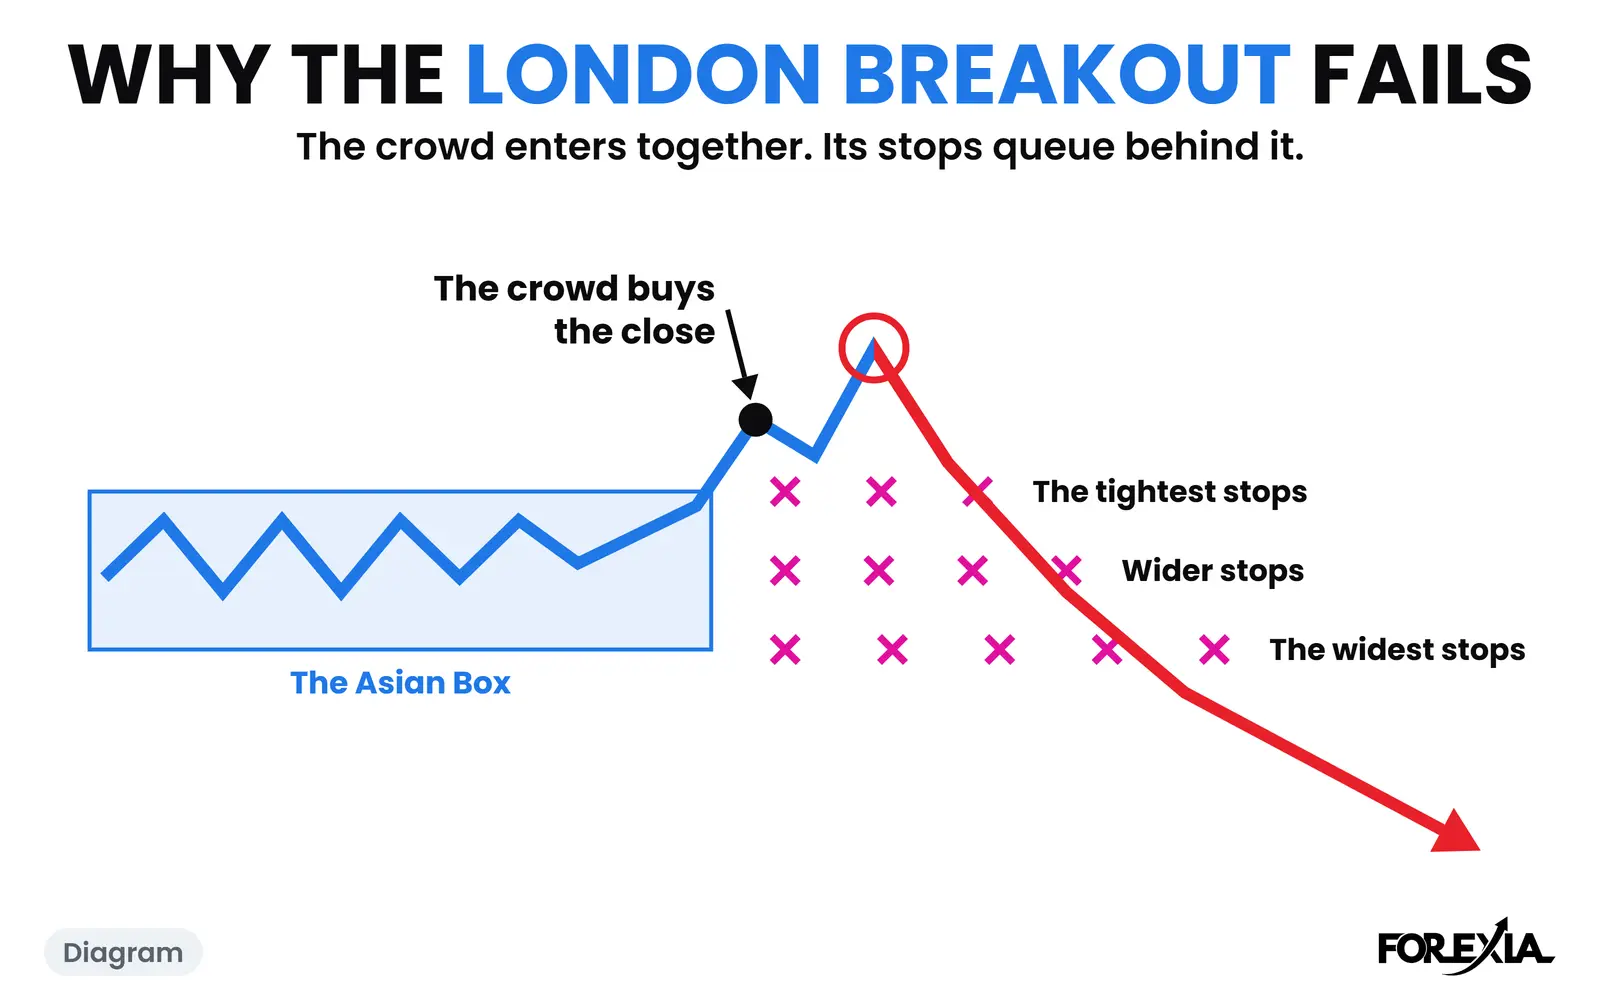
Why does the London breakout fail? The crowd enters together and its stops queue behind it. Real days on USD/CAD and EUR/USD, and how often the break held.
8 min read
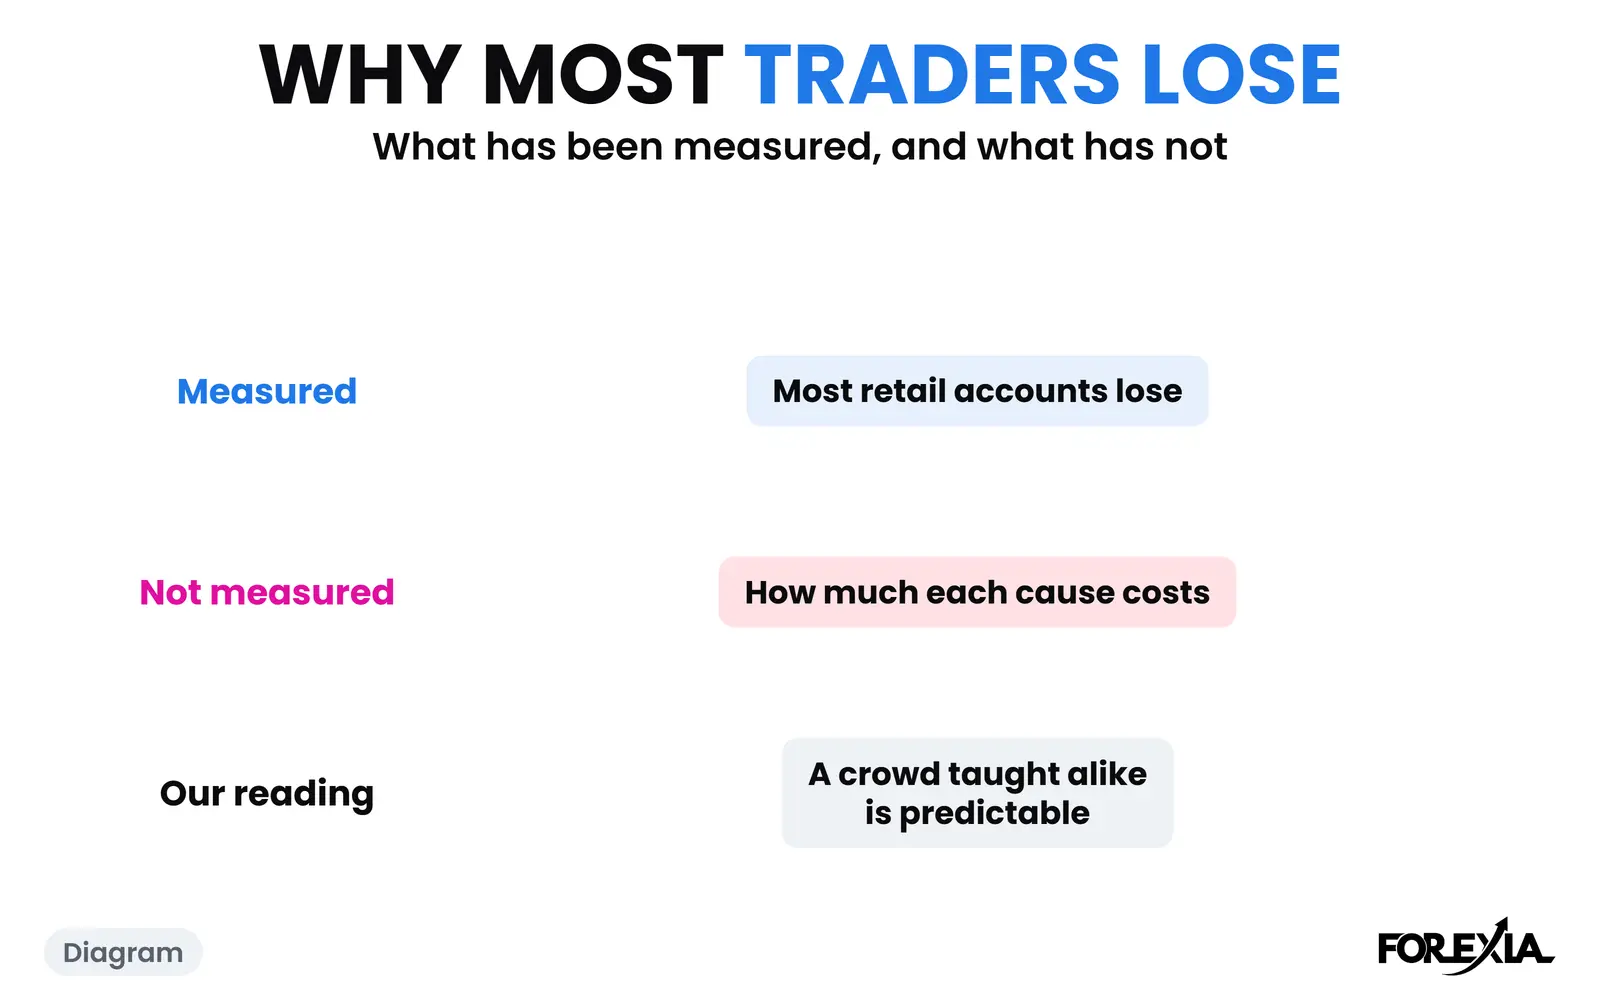
Why most traders lose: regulators' figures at source with dates and limits, what nobody has measured, and two real days where the trader did nothing wrong.
9 min read
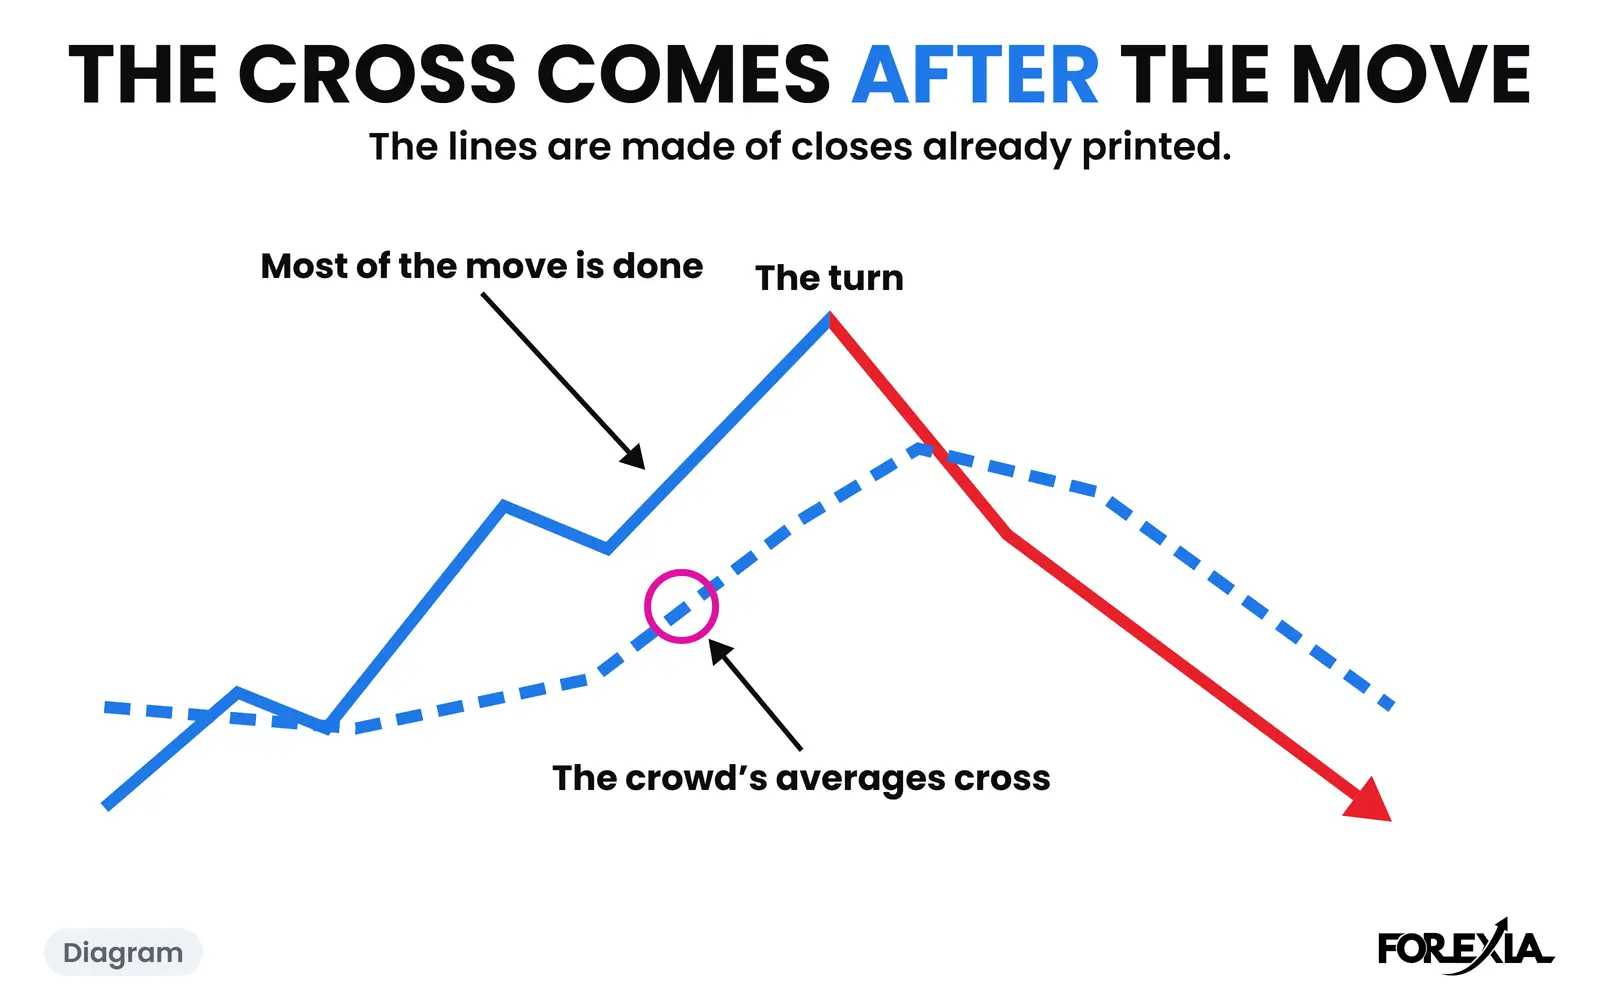
Why moving average crossovers fail: a count of 1,132 crosses on 15-minute forex candles, and two real days with the crowd's averages drawn and labelled.
7 min read
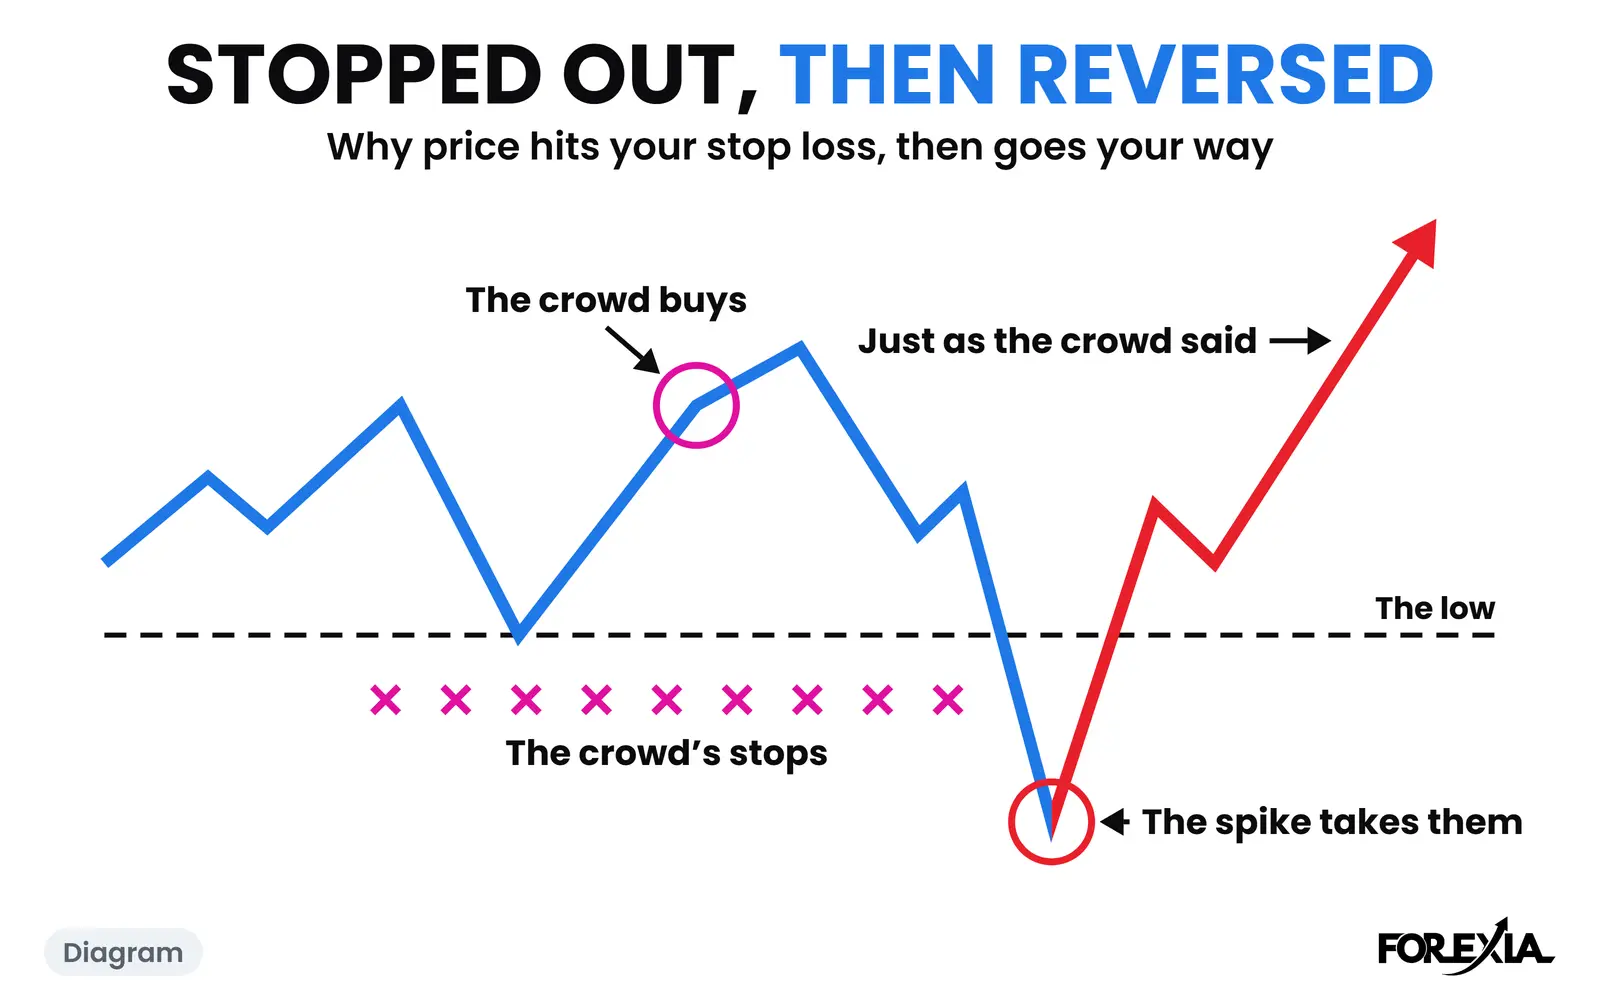
Why does price hit your stop loss and then reverse? The market maker's seat on two real days, USD/CAD and GBP/USD, and what the evidence cannot show.
8 min read
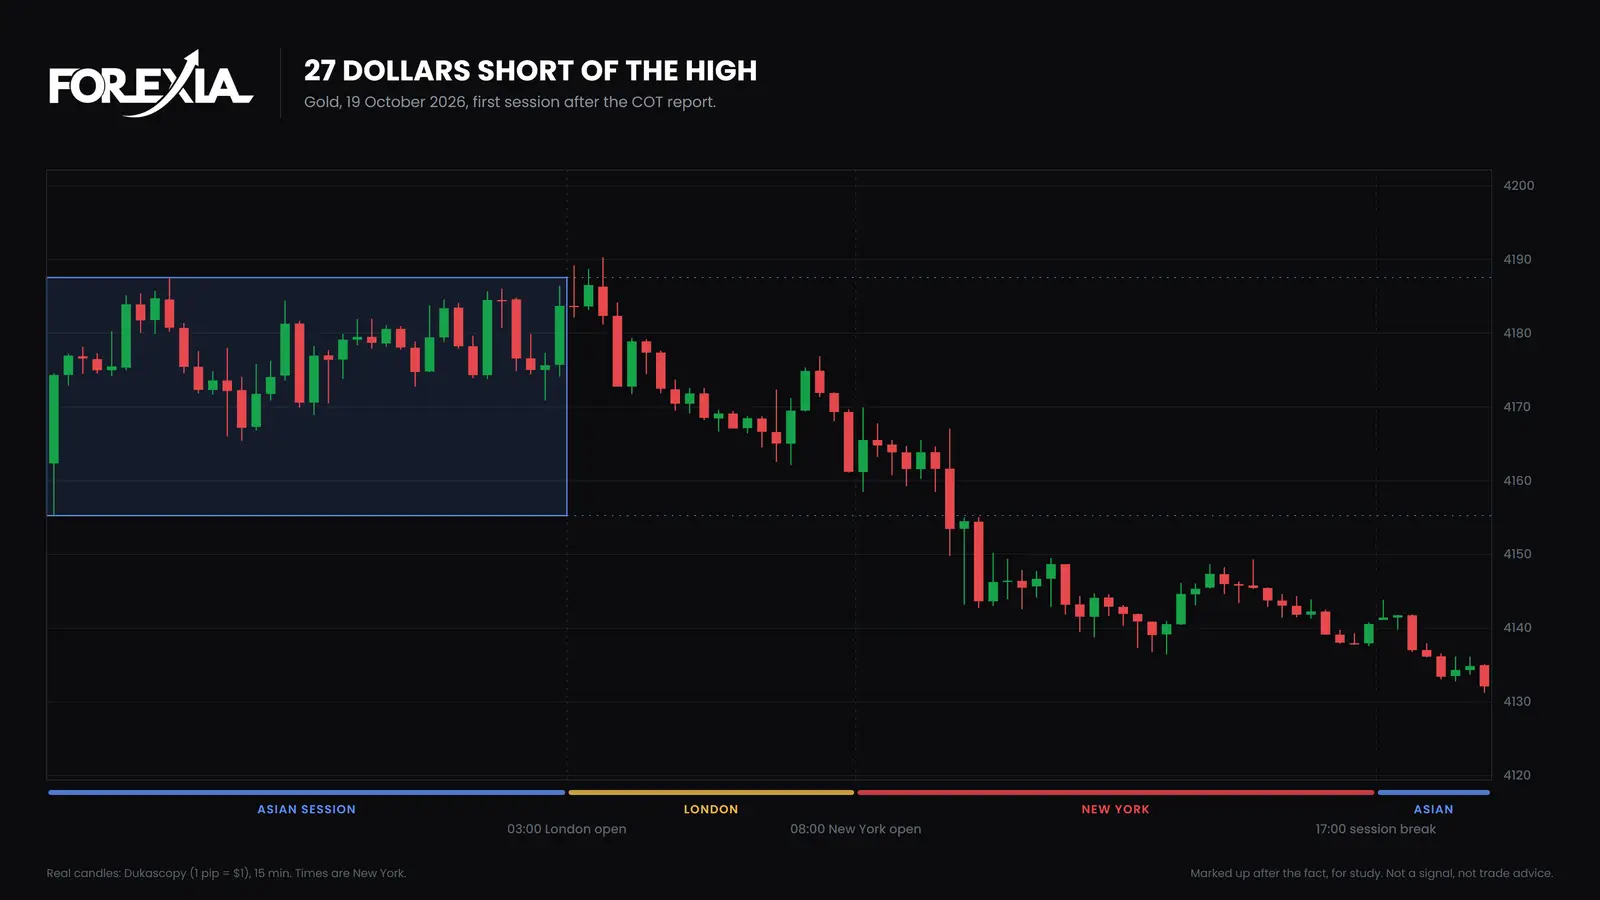
The COT report for gold, counted 13 October 2026: legacy against managed money, the crowd's stance, the levels, and what gold did in the next two weeks.
9 min read
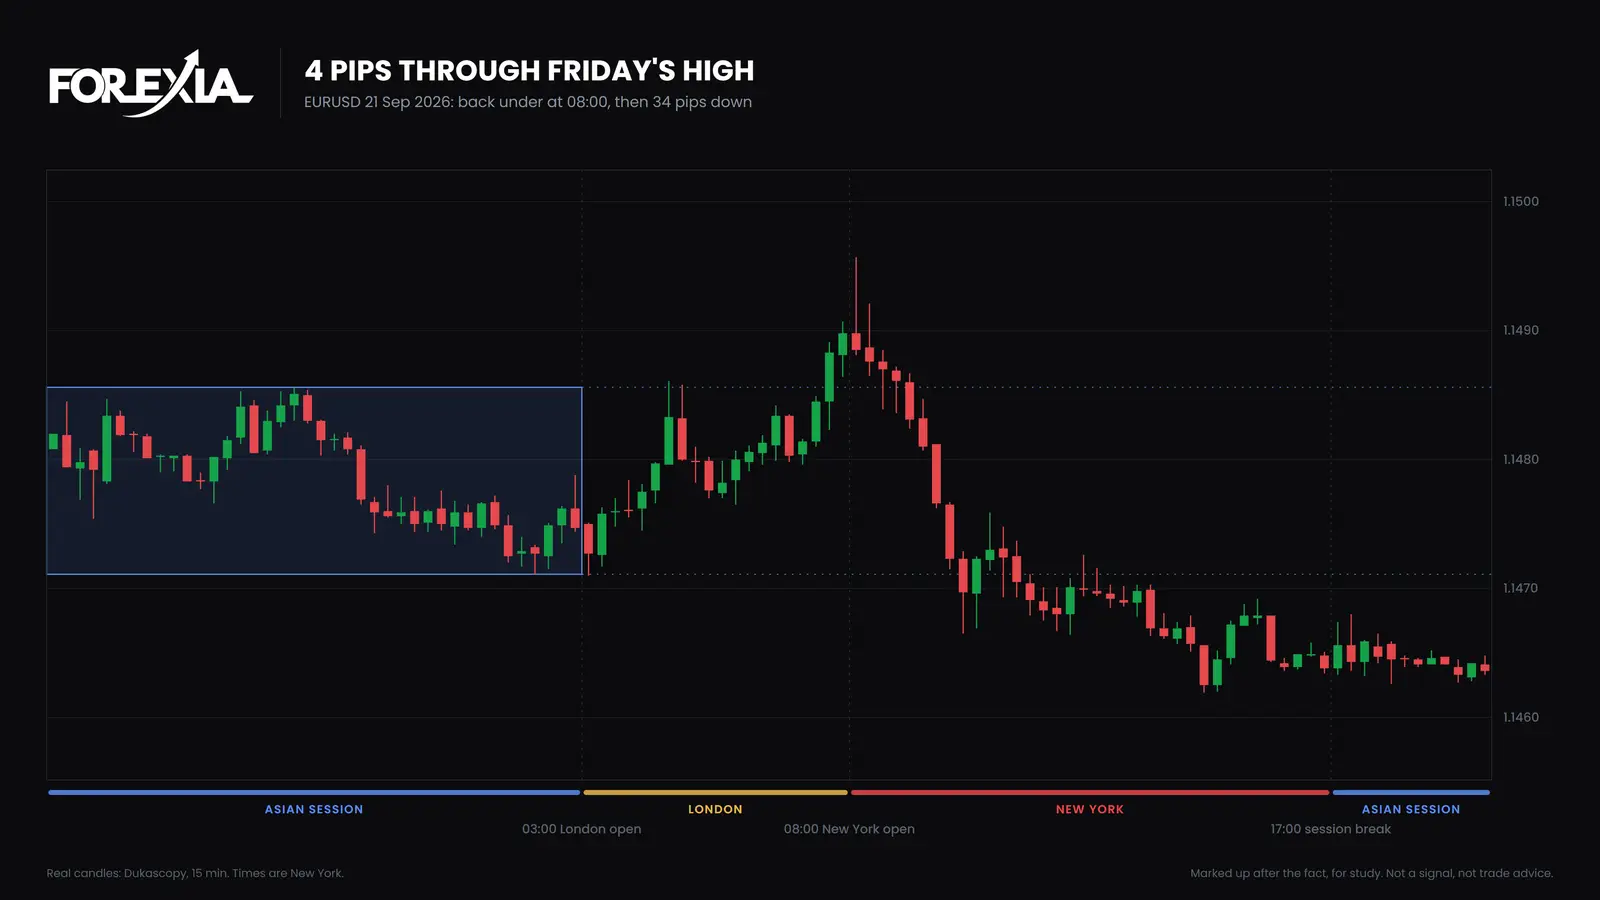
A previous day high and low trading strategy fades the level or trades the break. Three real 2026 days, and what the textbook versions leave out.
10 min read
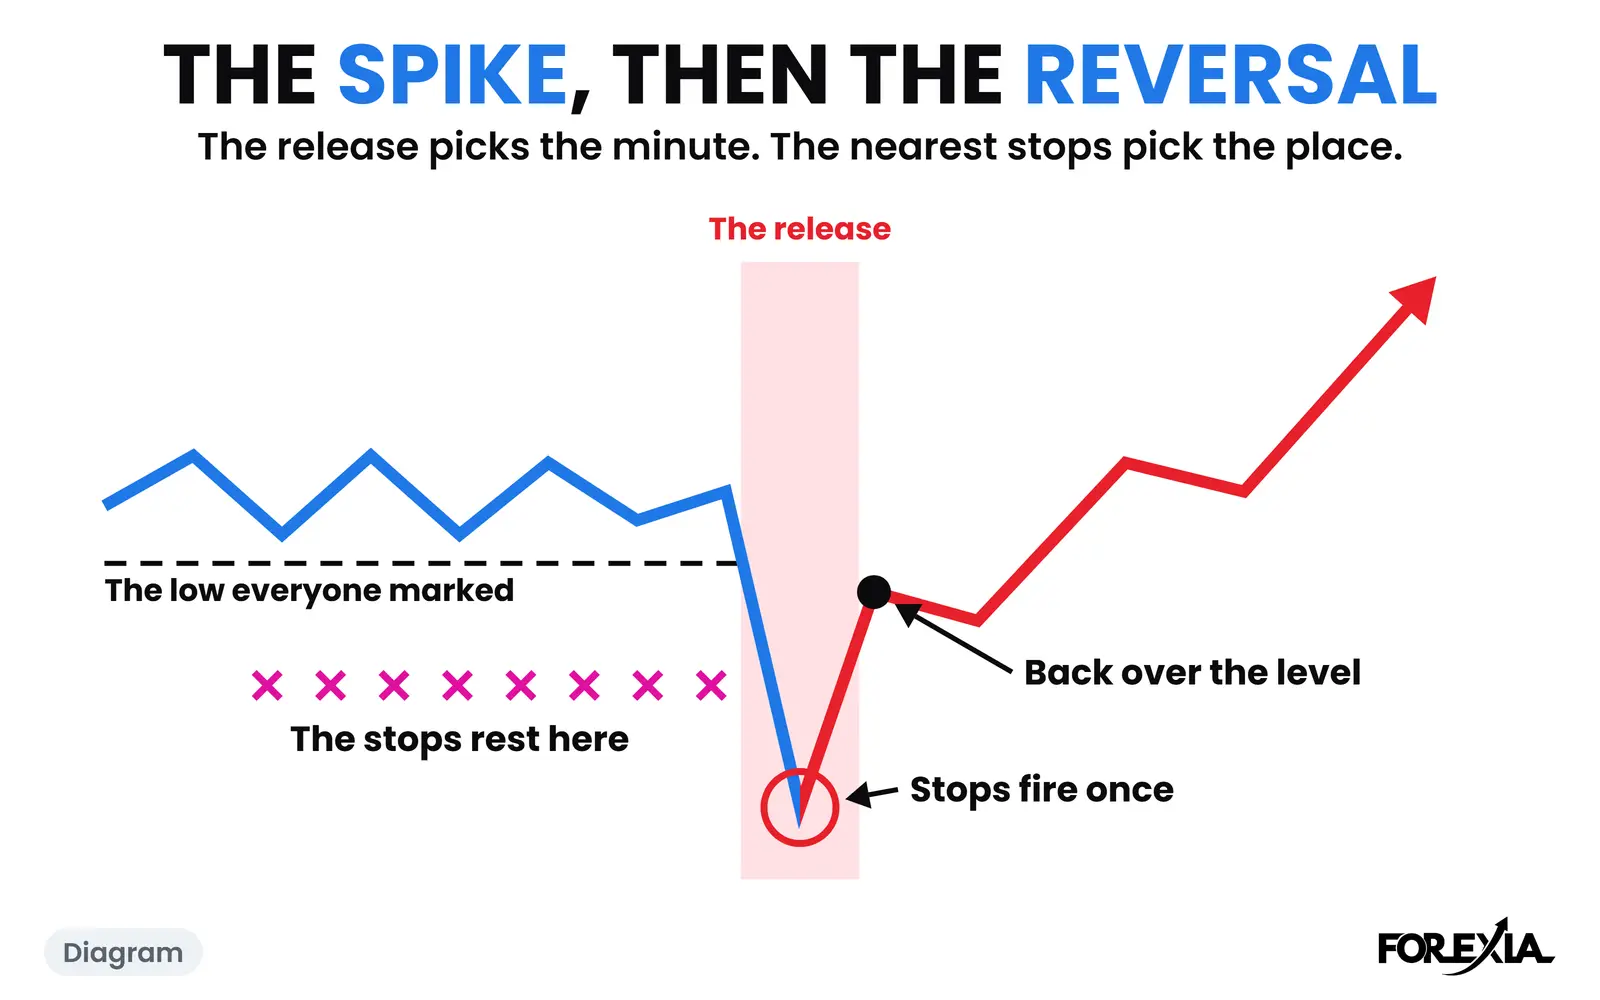
Why price spikes then reverses after news: the release sets the minute, not the direction. USD/CAD, GBP/USD and a spike that stayed, on real candles.
8 min read
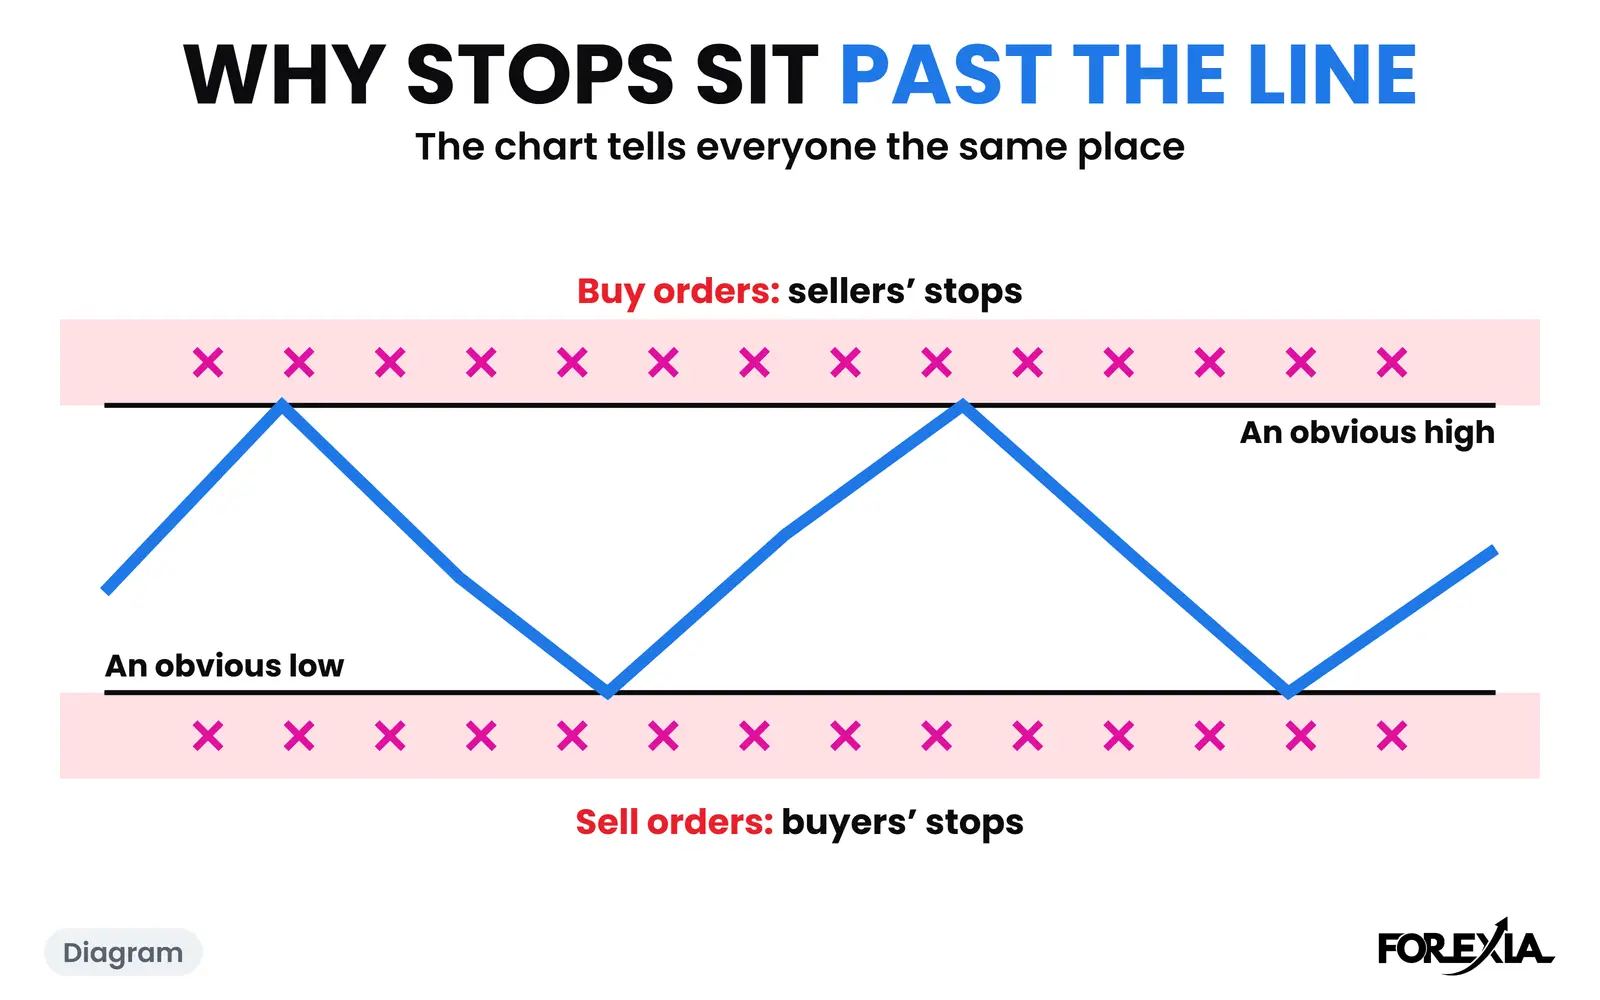
Why stop losses sit above highs and below lows: four pressures, one bank's order book with its limits, and one round number from both sides on real days.
9 min read
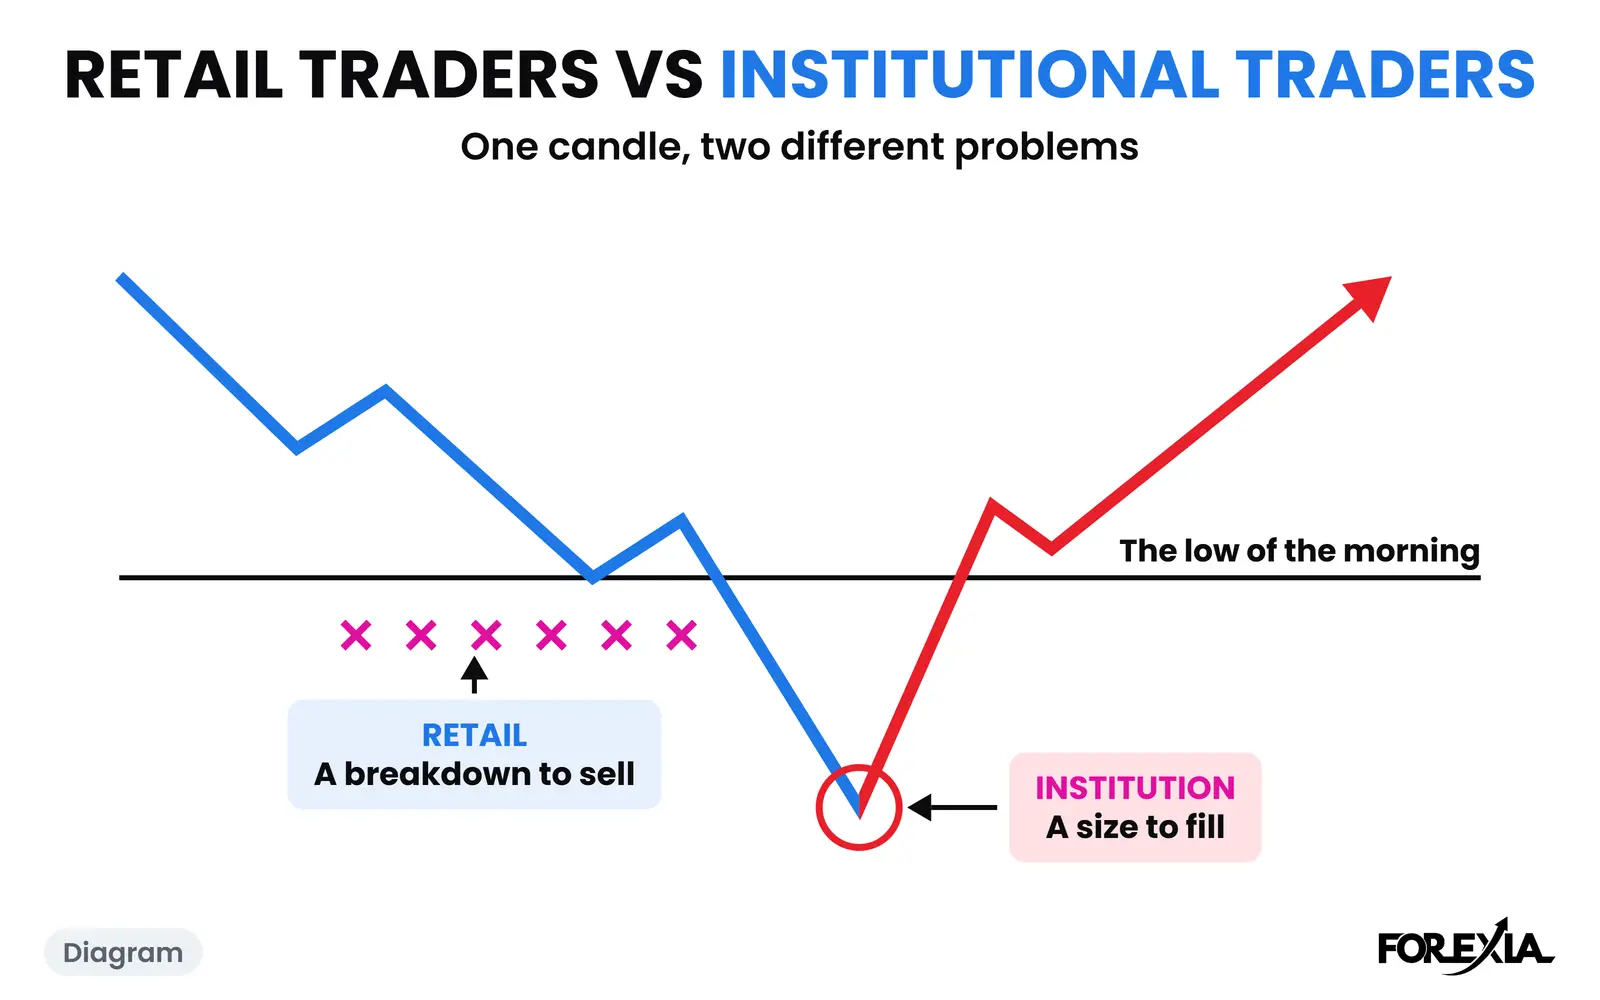
Retail traders vs institutional traders: who wants what, in one table, then one real EUR/USD candle and a GBP/USD day that cost both ways, on our chart.
7 min read
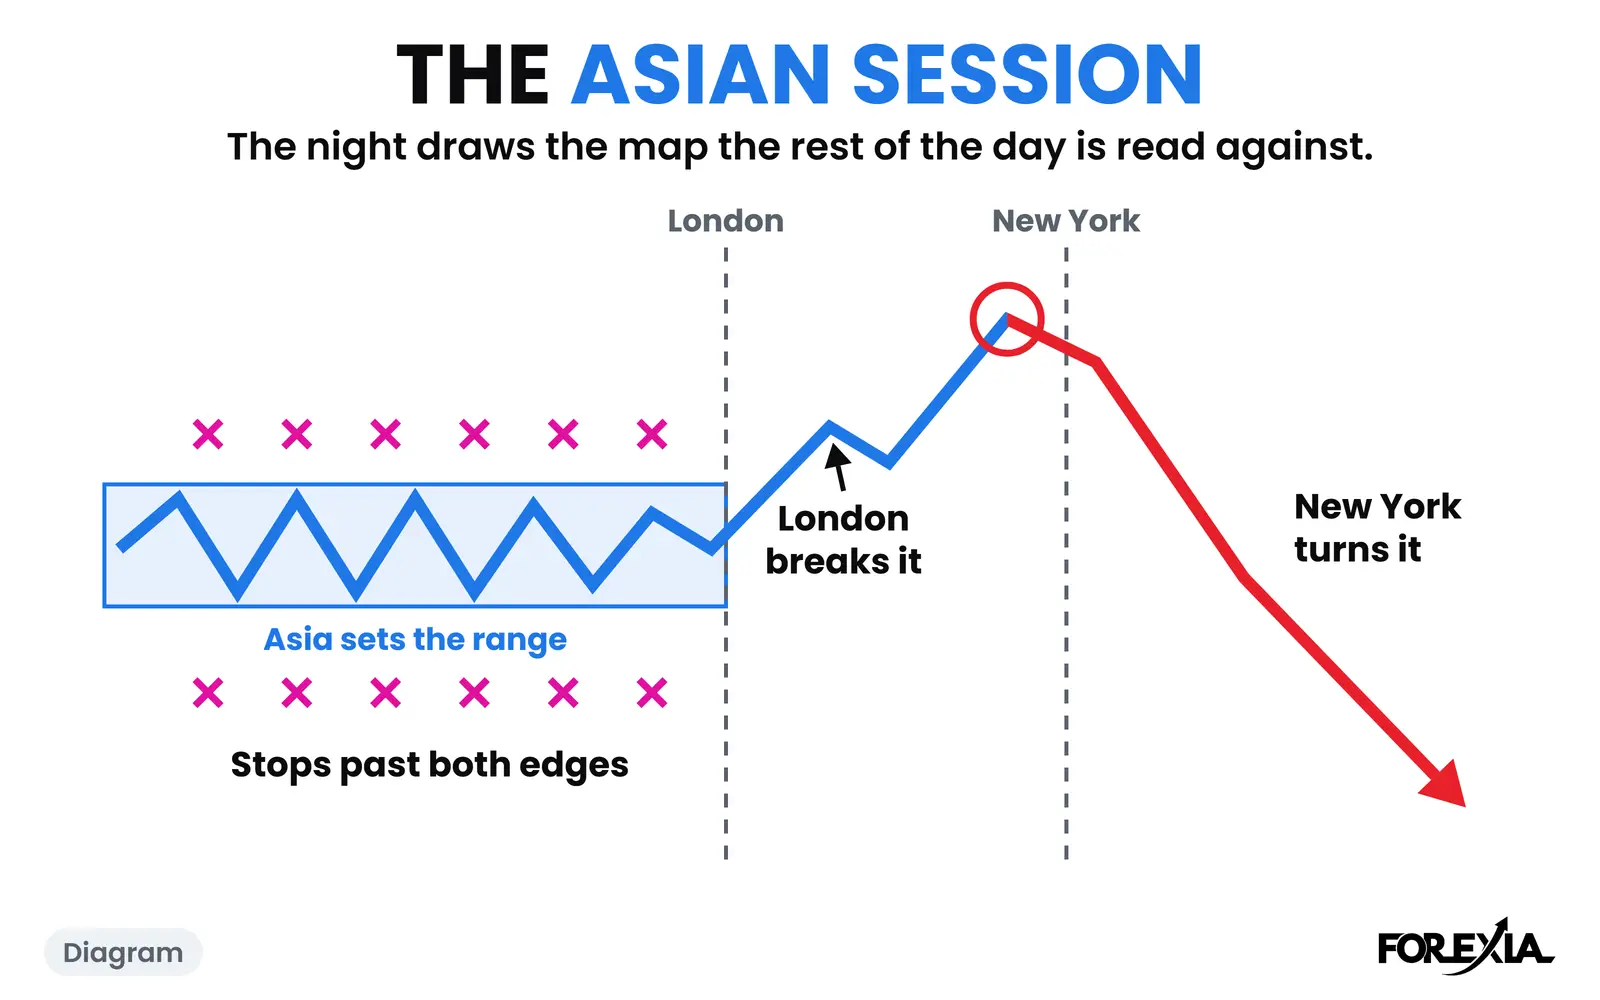
An Asian session strategy starts with what the night leaves. Three real days, USD/CHF and EUR/USD, and how often Asia, London and New York ran in order.
8 min read
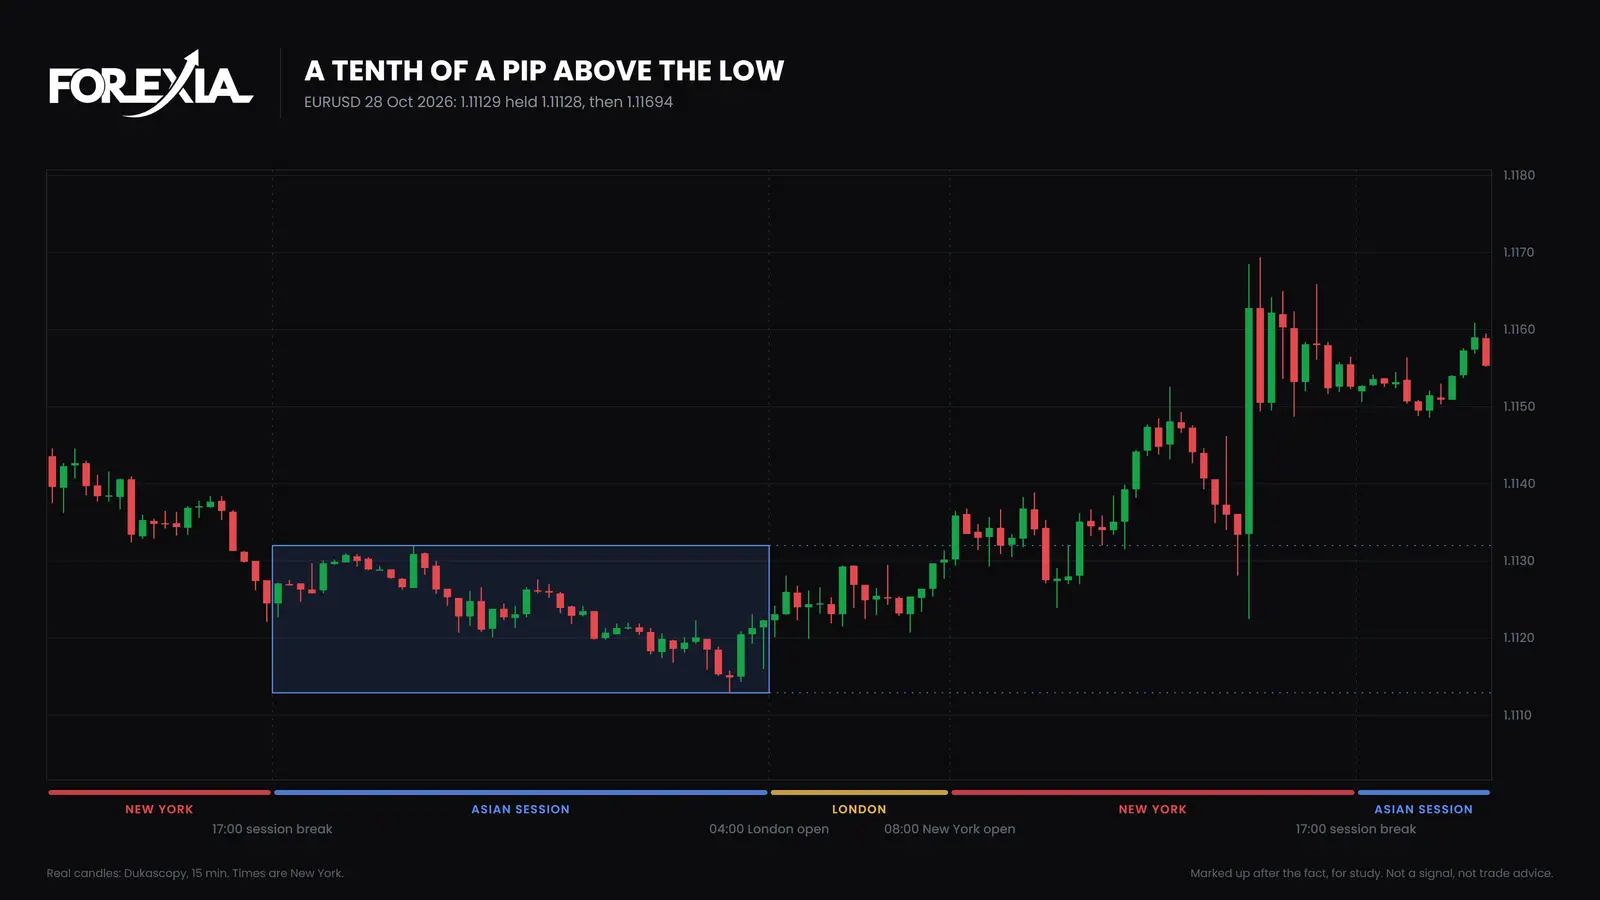
The COT report EUR/USD counted 13 October 2026: the crowd at index 0, who sat on the other side, one level under the market, and what the euro did next.
8 min read
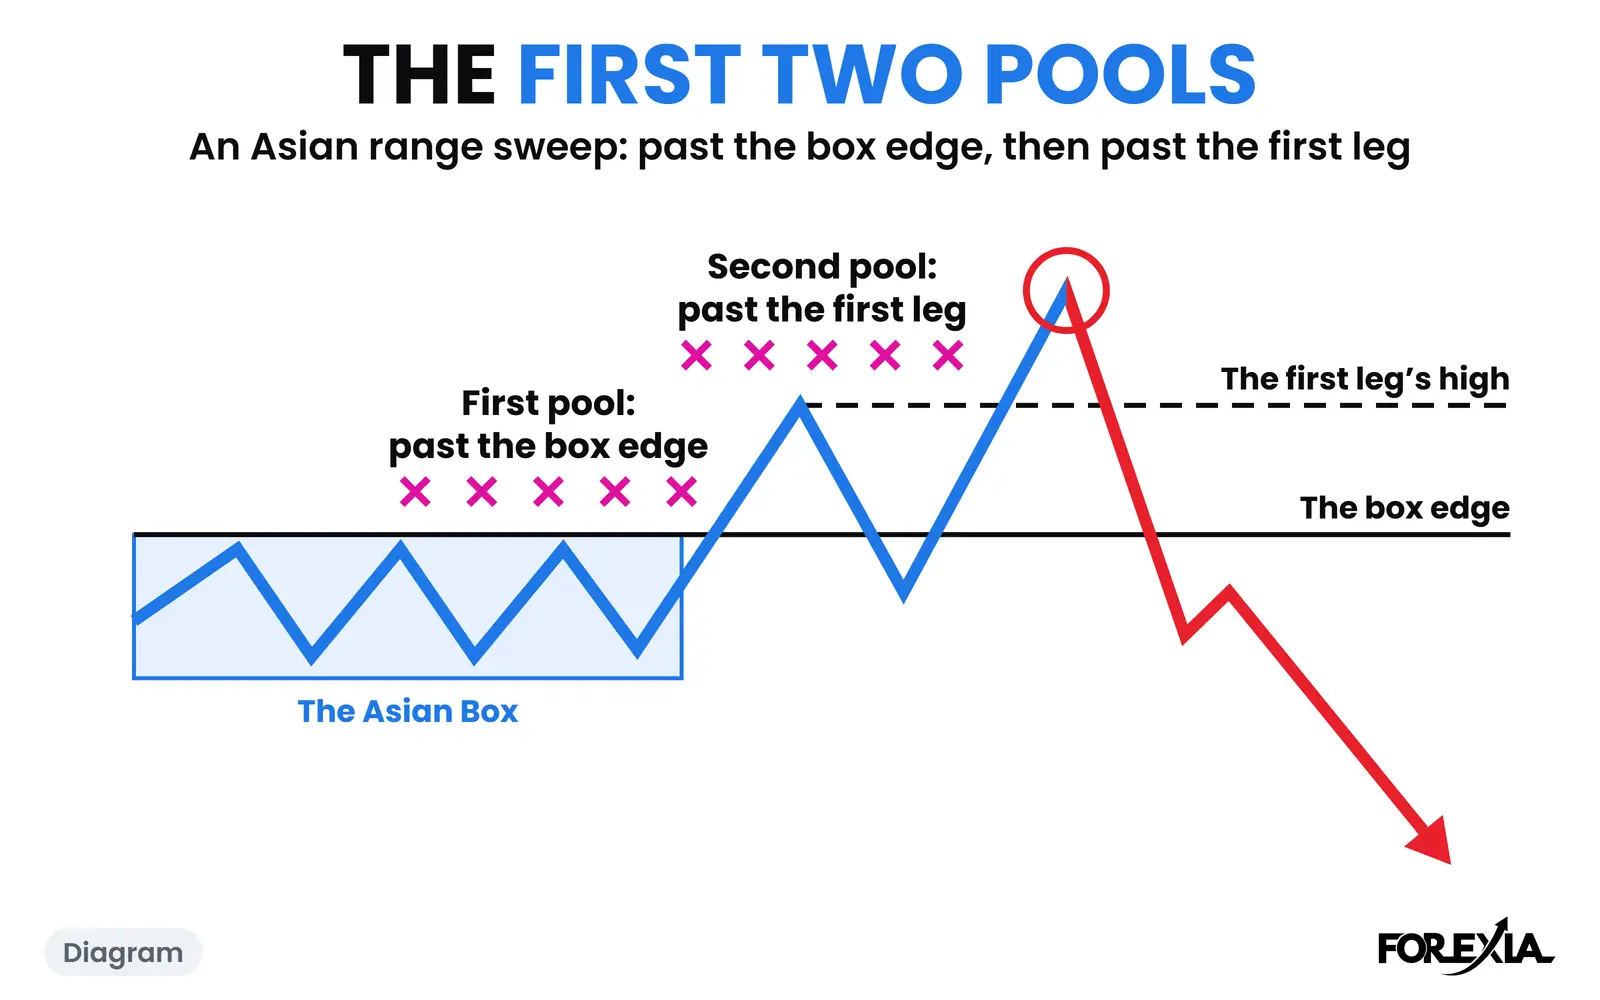
An Asian range liquidity sweep takes the stops past the session's high or low. How to mark the range, then two real days: USD/CAD and NZD/USD in 2026.
7 min read
Weekly high and low liquidity: last week's fixed lines and this week's moving ones. A count of 177 lines taken, and three real 2026 weeks, one unturned.
9 min read
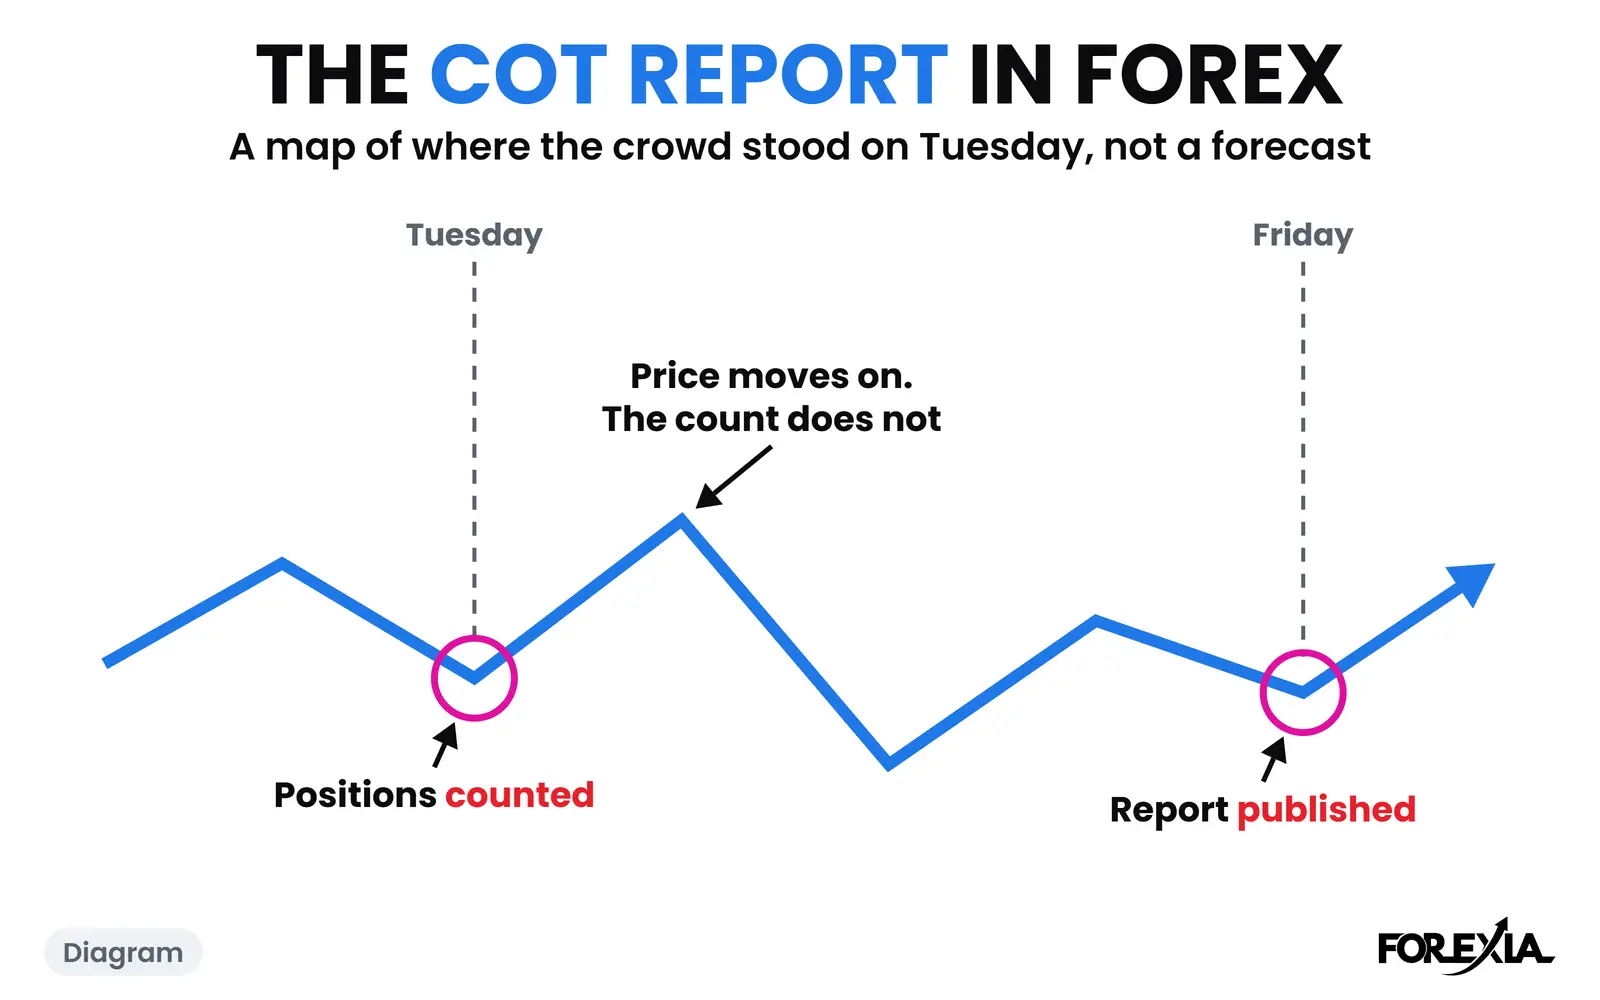
What is the COT report in forex? Who it counts, one real week on the euro and gold, why it rests on futures, and the four things it cannot tell you.
7 min read
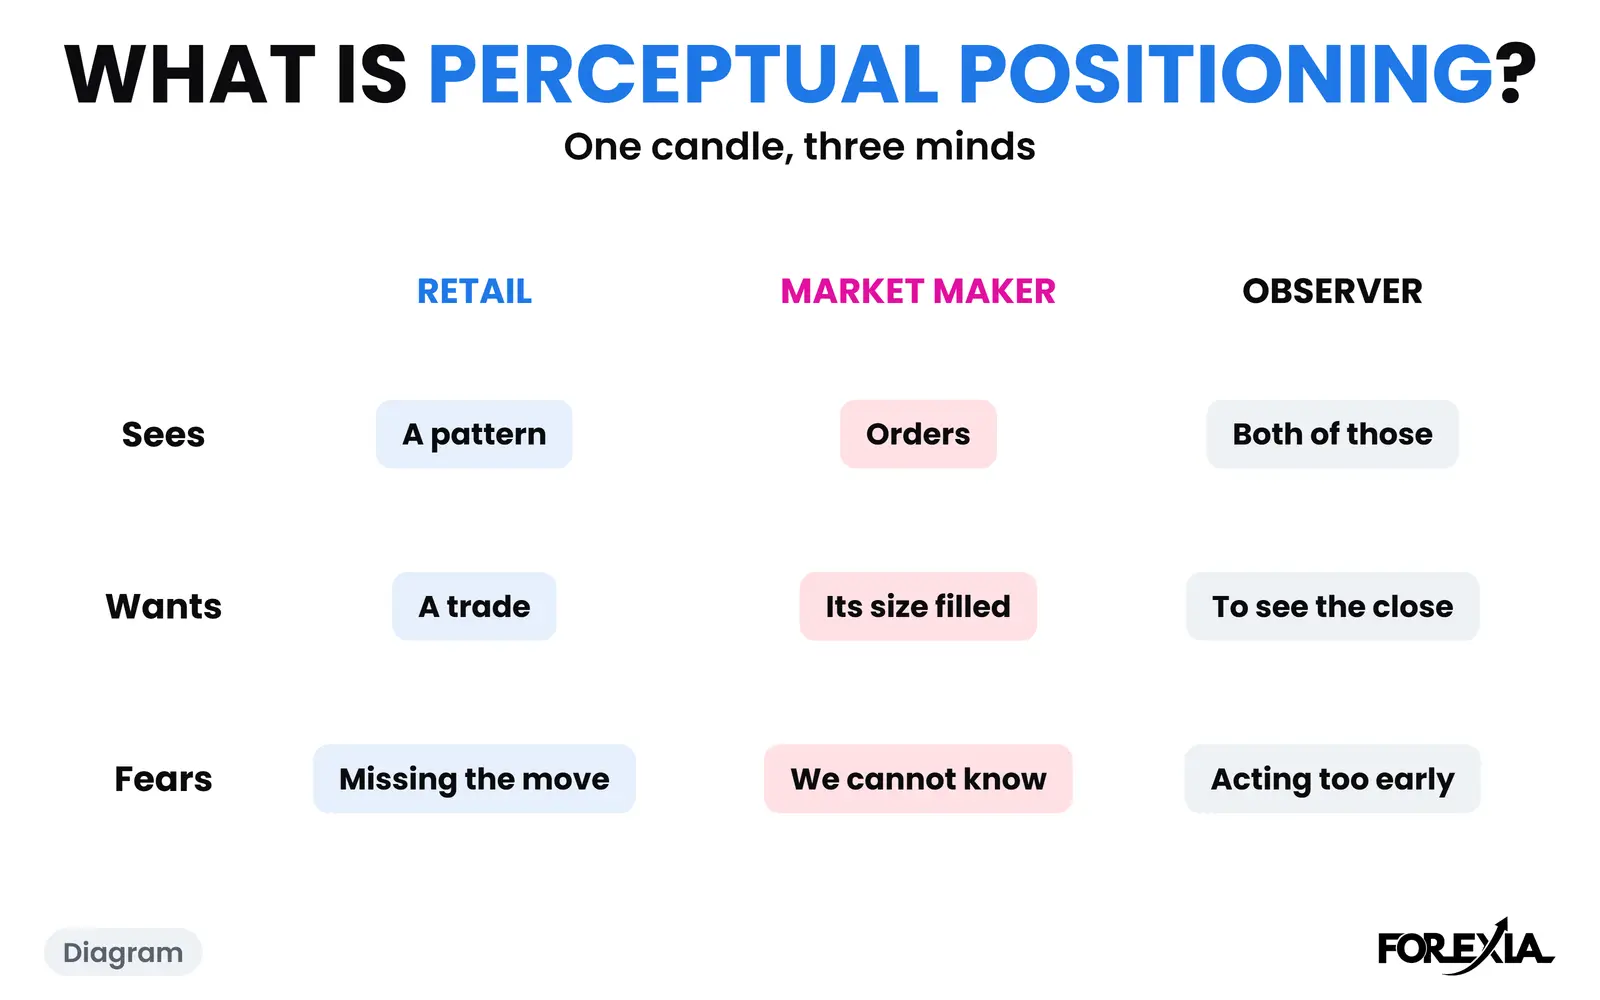
What is perceptual positioning in trading psychology? Where the idea comes from, what it asks of each seat, and a real day the read changed three times.
7 min read
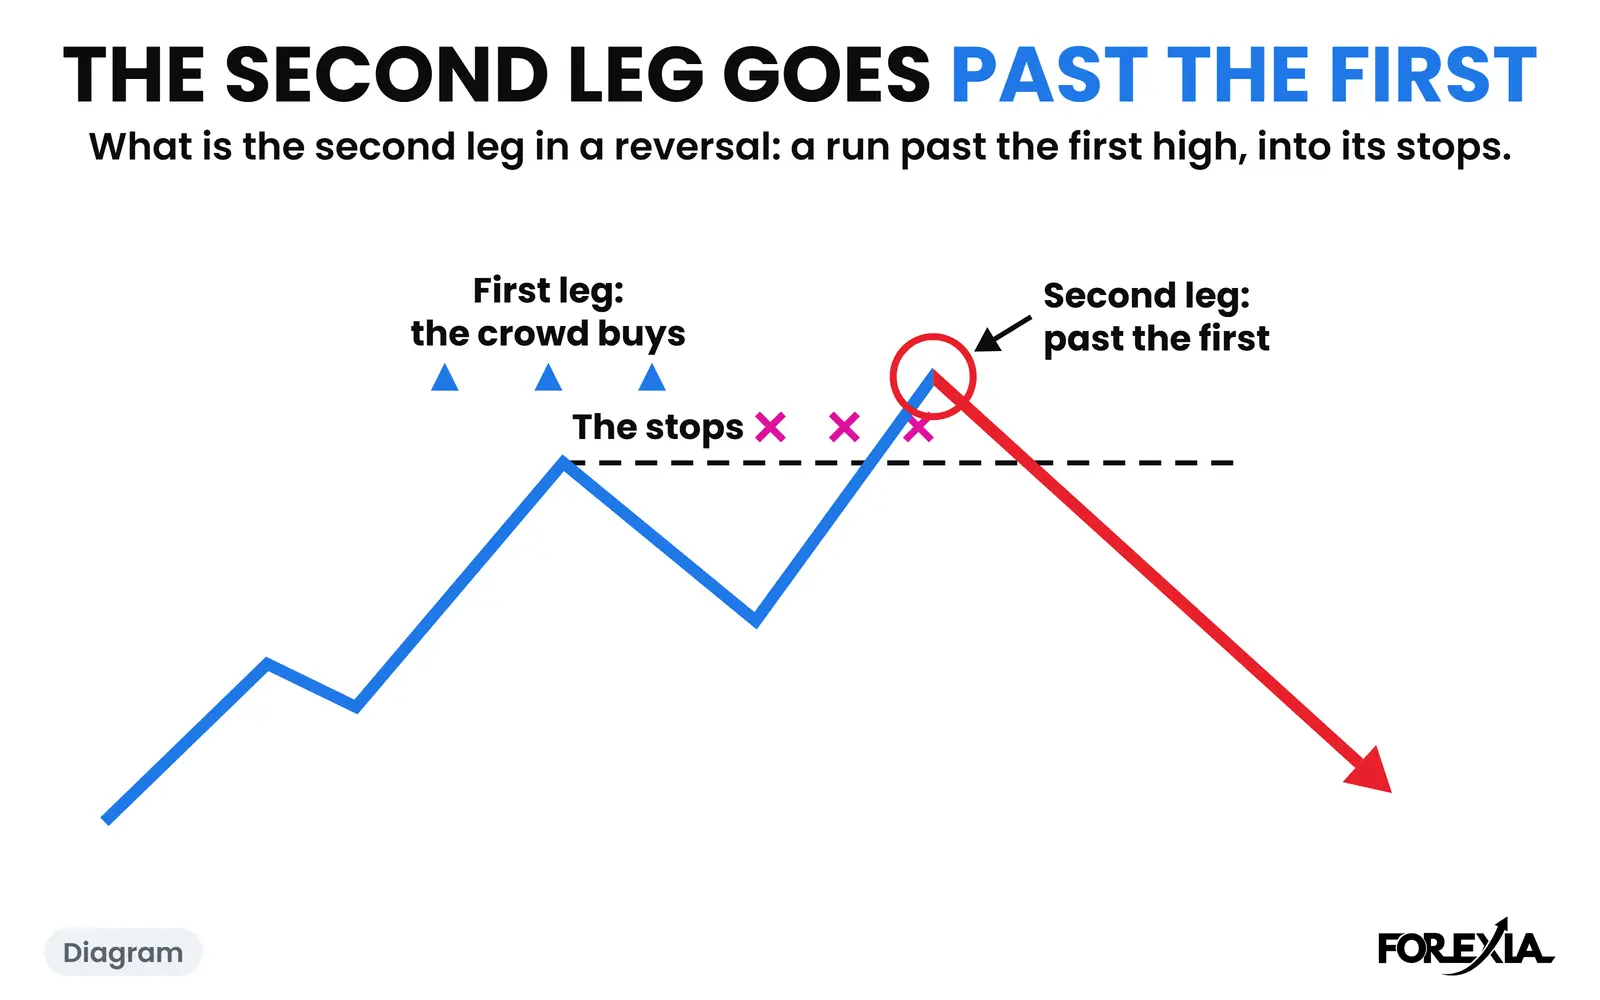
What is the second leg in a reversal? In an M or W the first leg is bait and the second is the hunt. Six real days: how far each ran and what came next.
7 min read
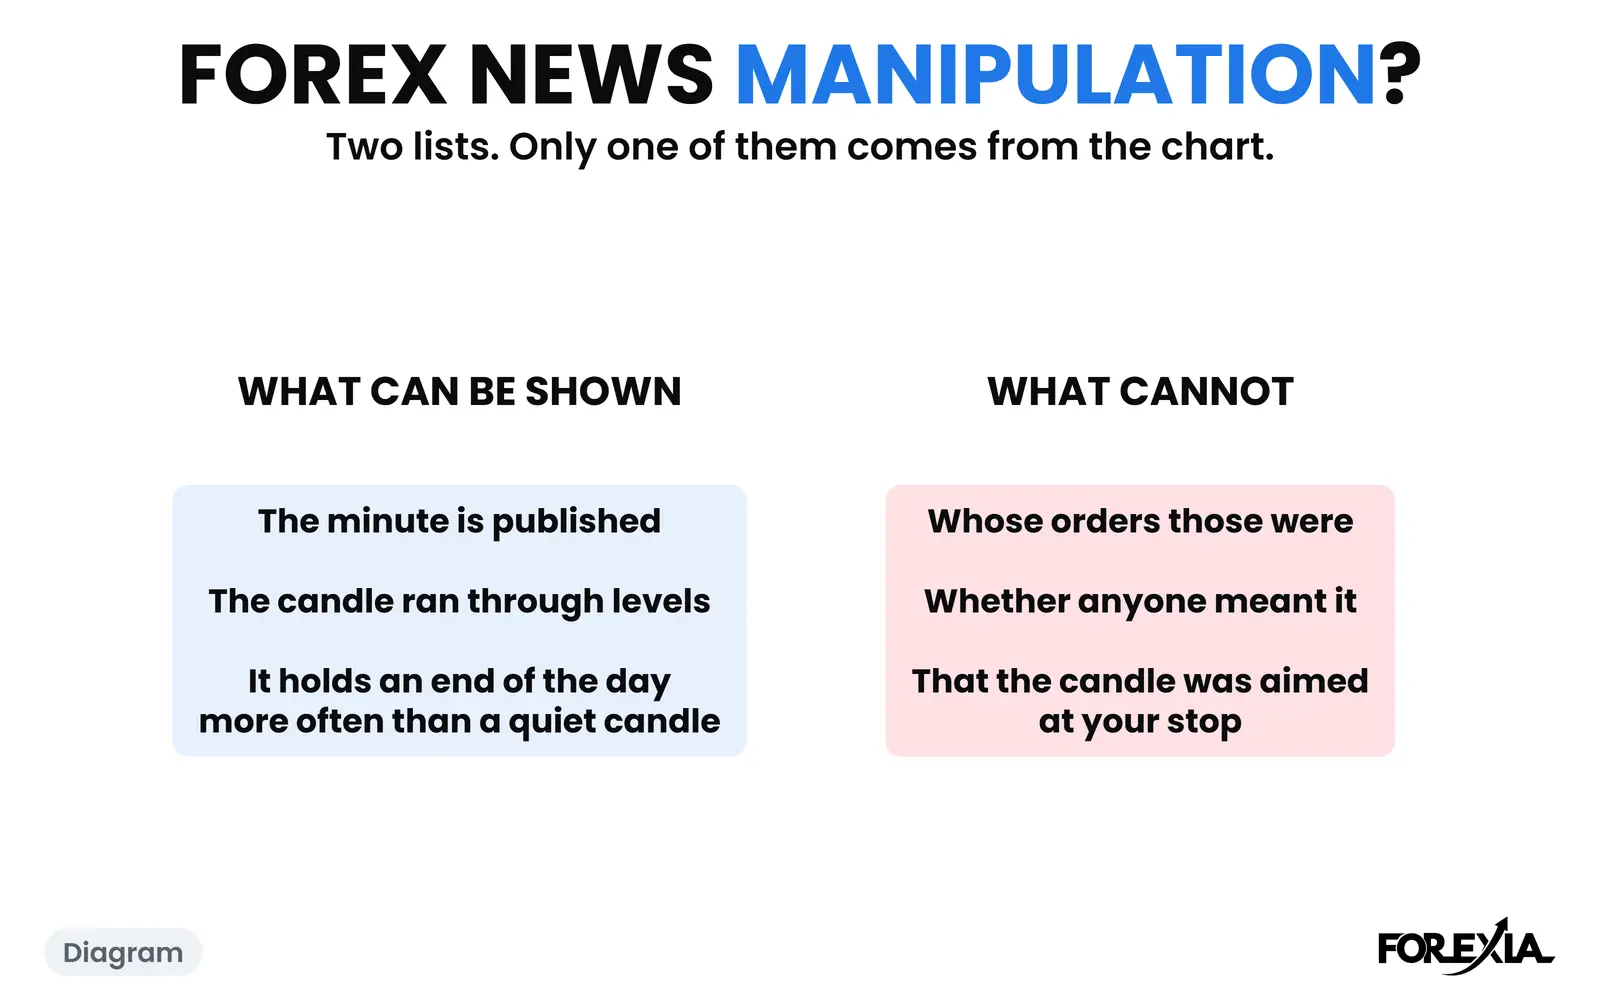
Forex news manipulation: we counted the 8:30 candle on 30 release mornings and 8 markets, set it beside the regulators' findings and show its limits.
8 min read
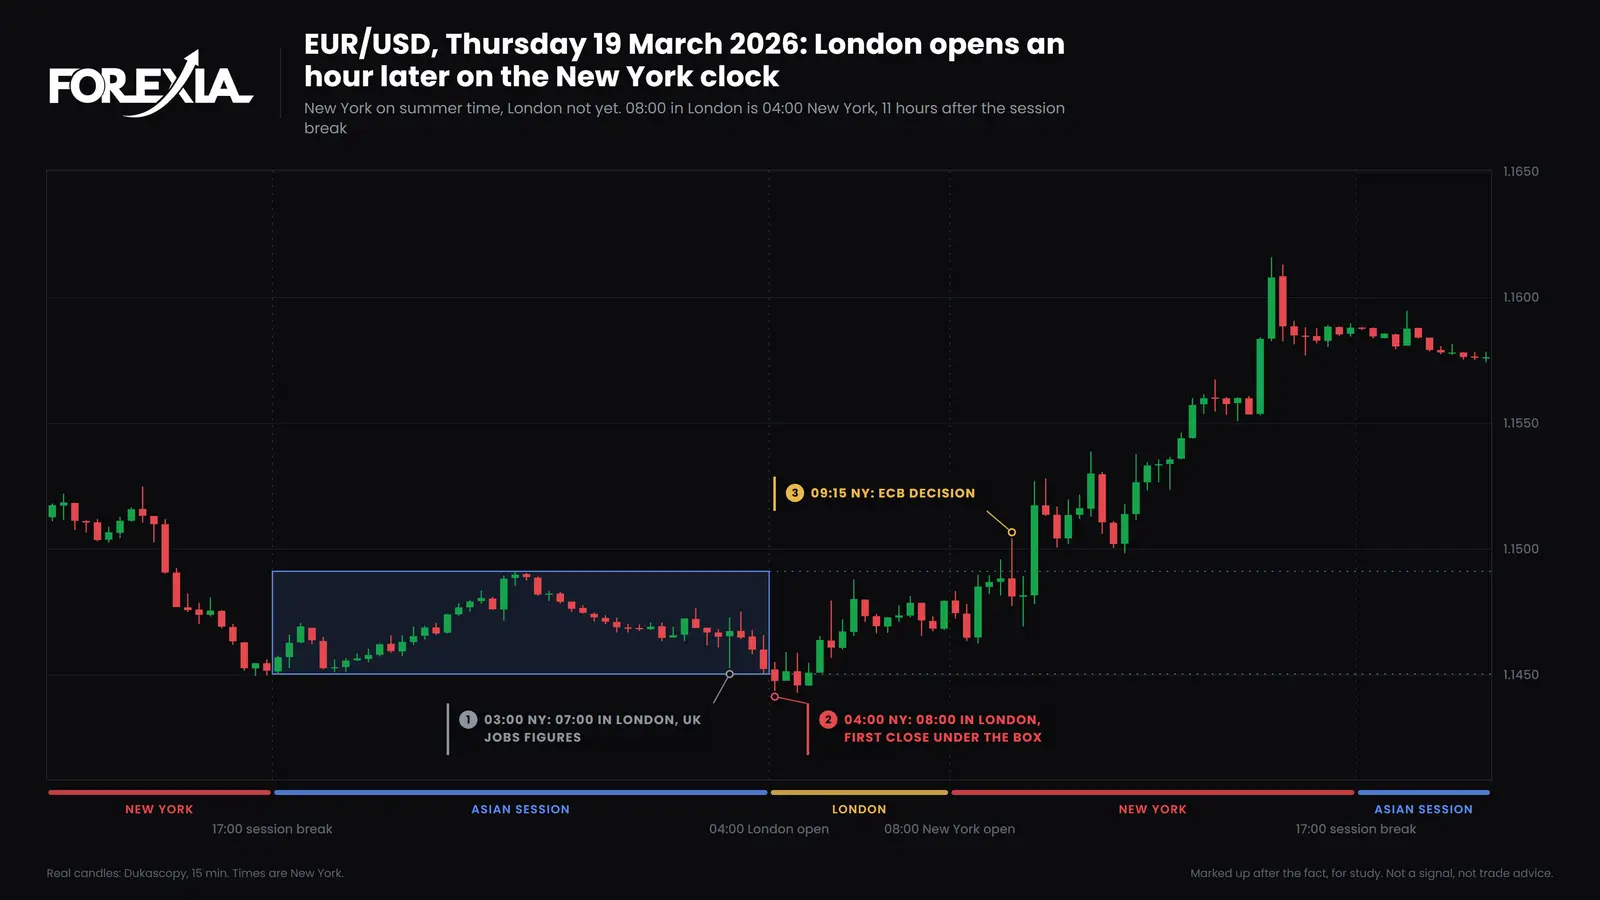
A forex market hours clock: your time beside New York, London, Tokyo and Sydney, each session open or closed, through every clock change. Its limits too.
11 min read
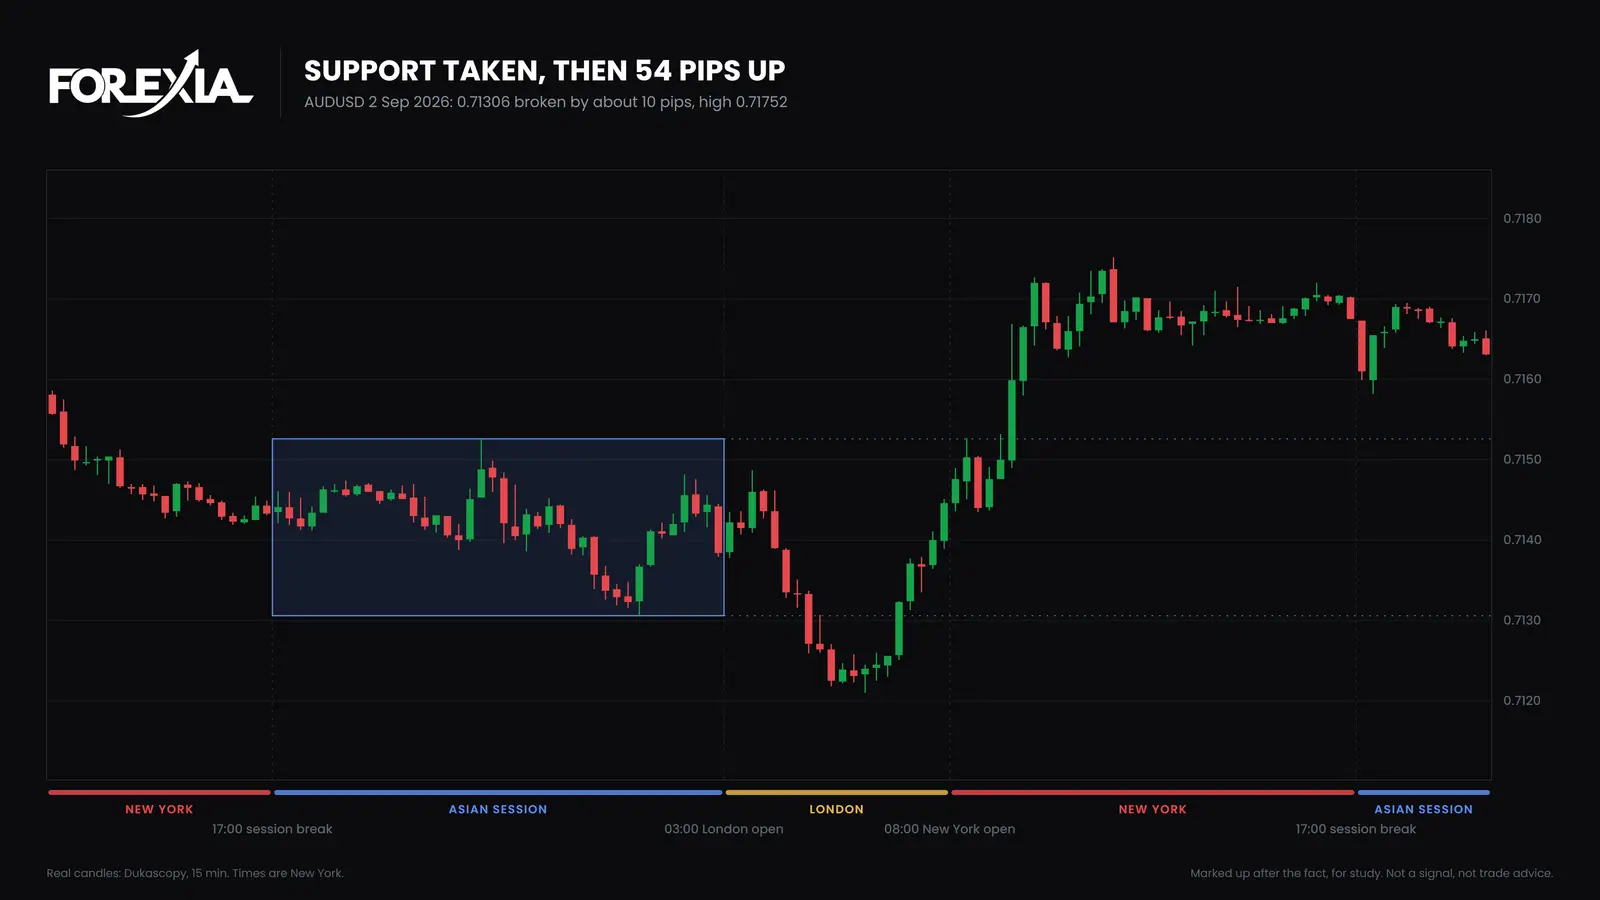
What is trading psychology? Emotion, habit and the seat you read from. Two real 2026 days, AUD/USD and USD/CHF, show the textbook read and what came next.
9 min read
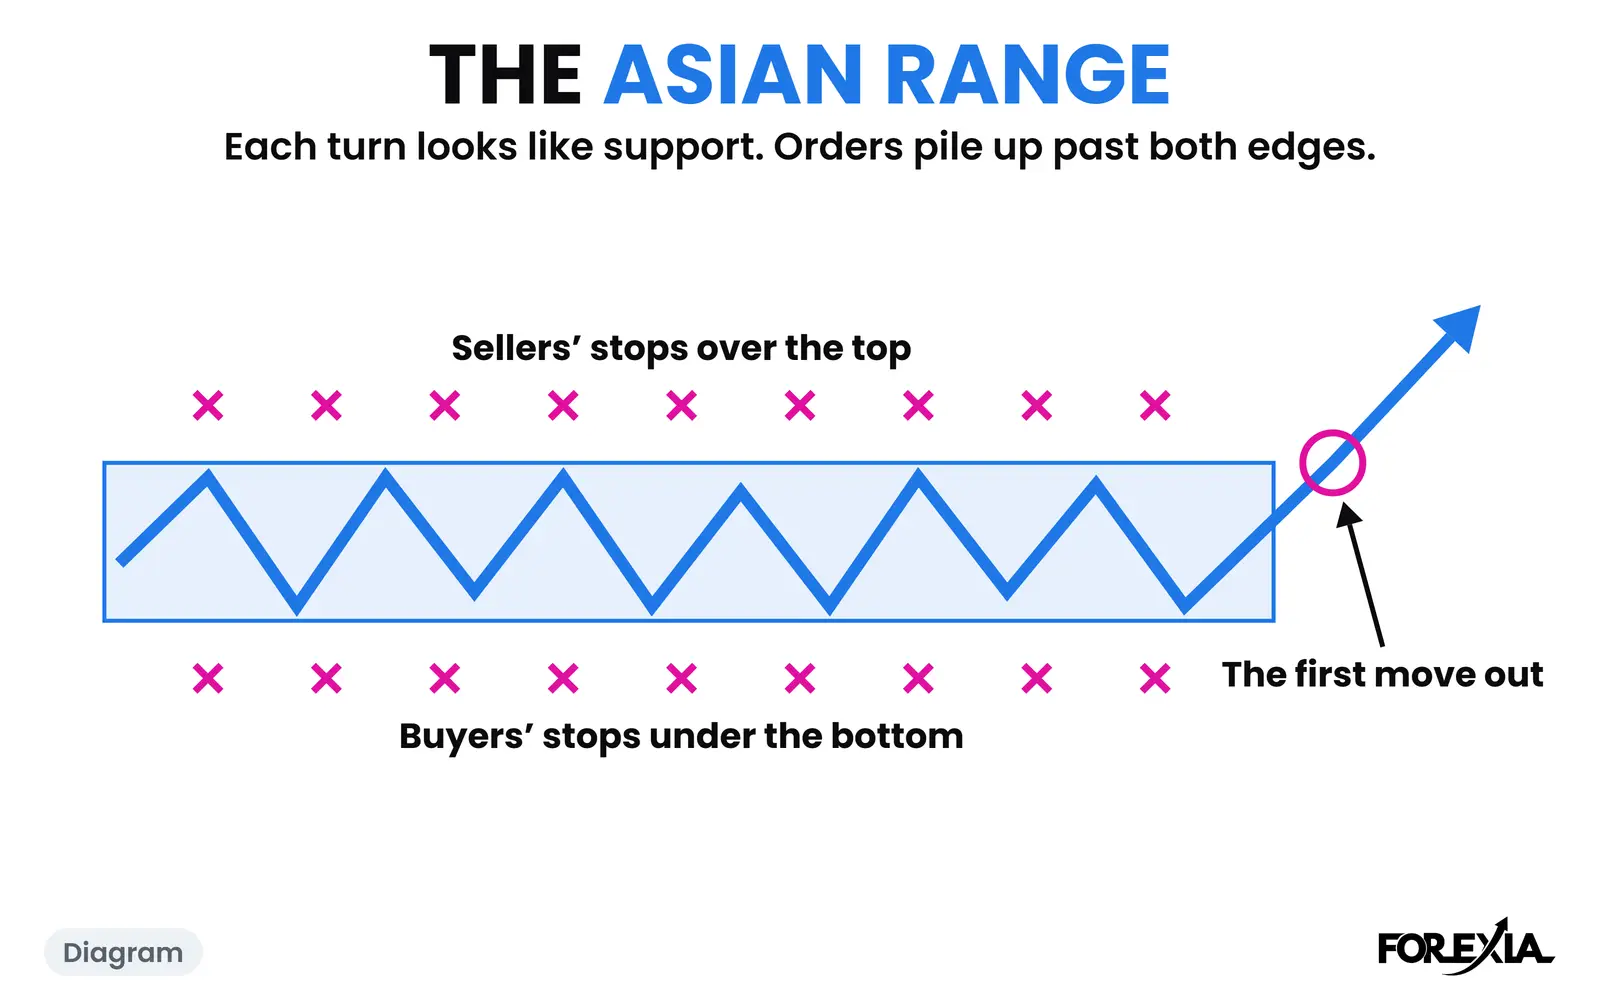
What the Asian range in forex is for: ten quiet hours build orders on both sides. GBP/USD on three real days and how often each pair's day was set in Asia.
10 min read
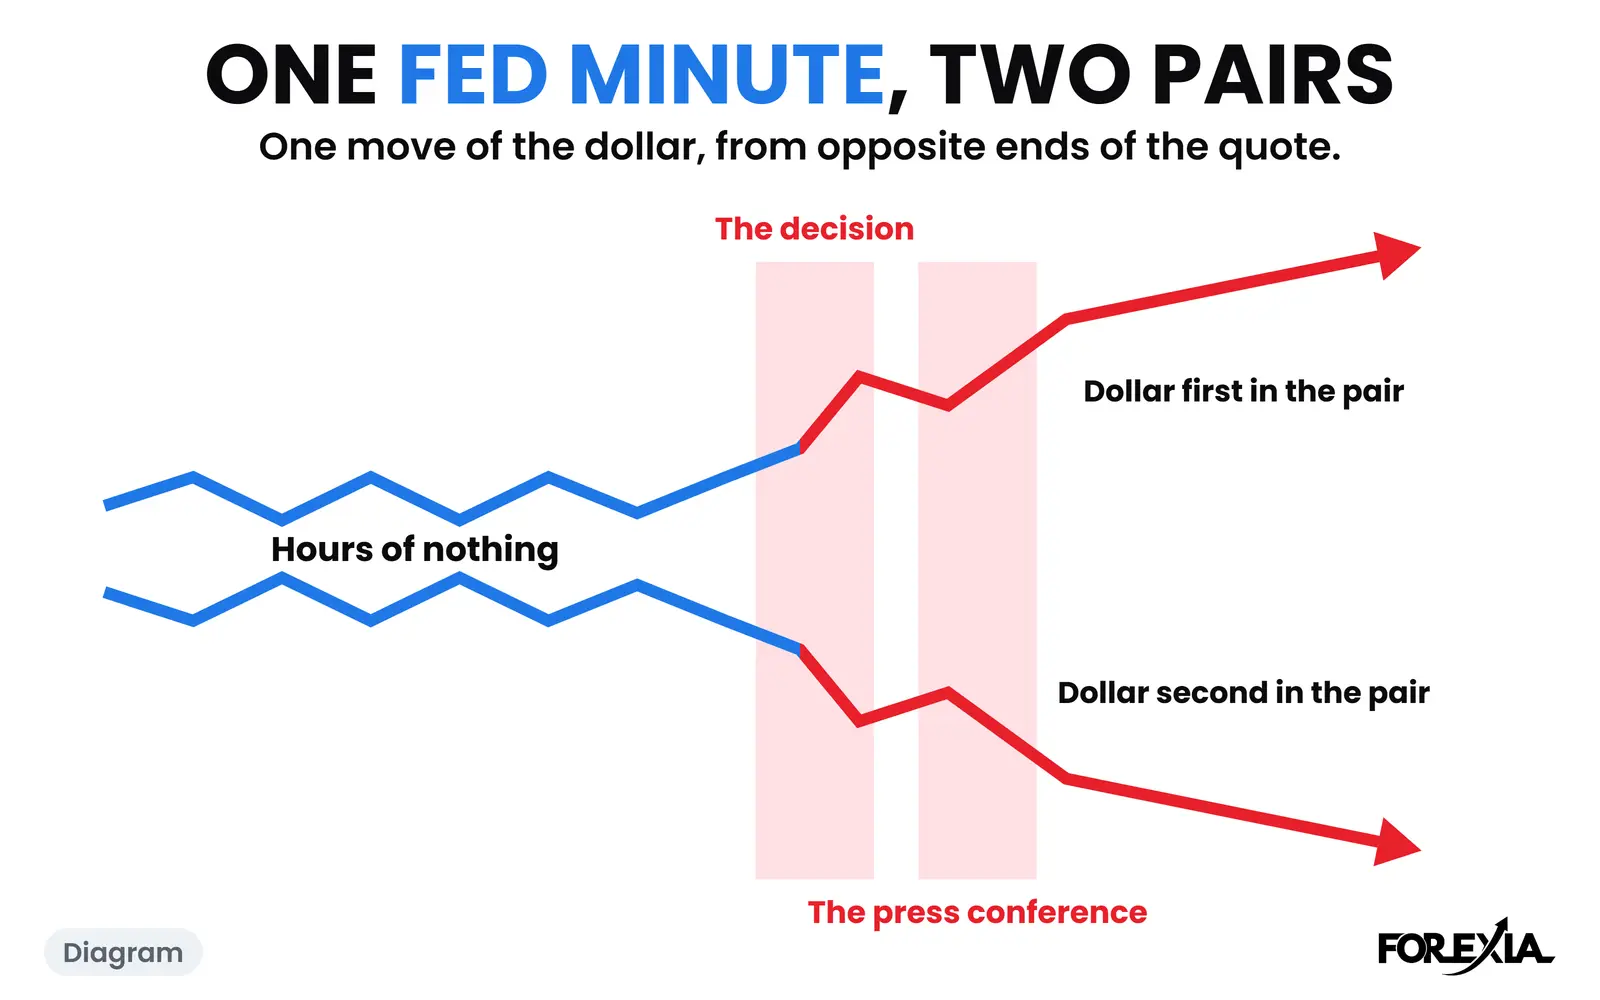
Why price spikes both ways on FOMC: inside one candle, across two Fed minutes and across pairs. AUD/USD, USD/JPY and USD/CHF, read to the minute.
8 min read
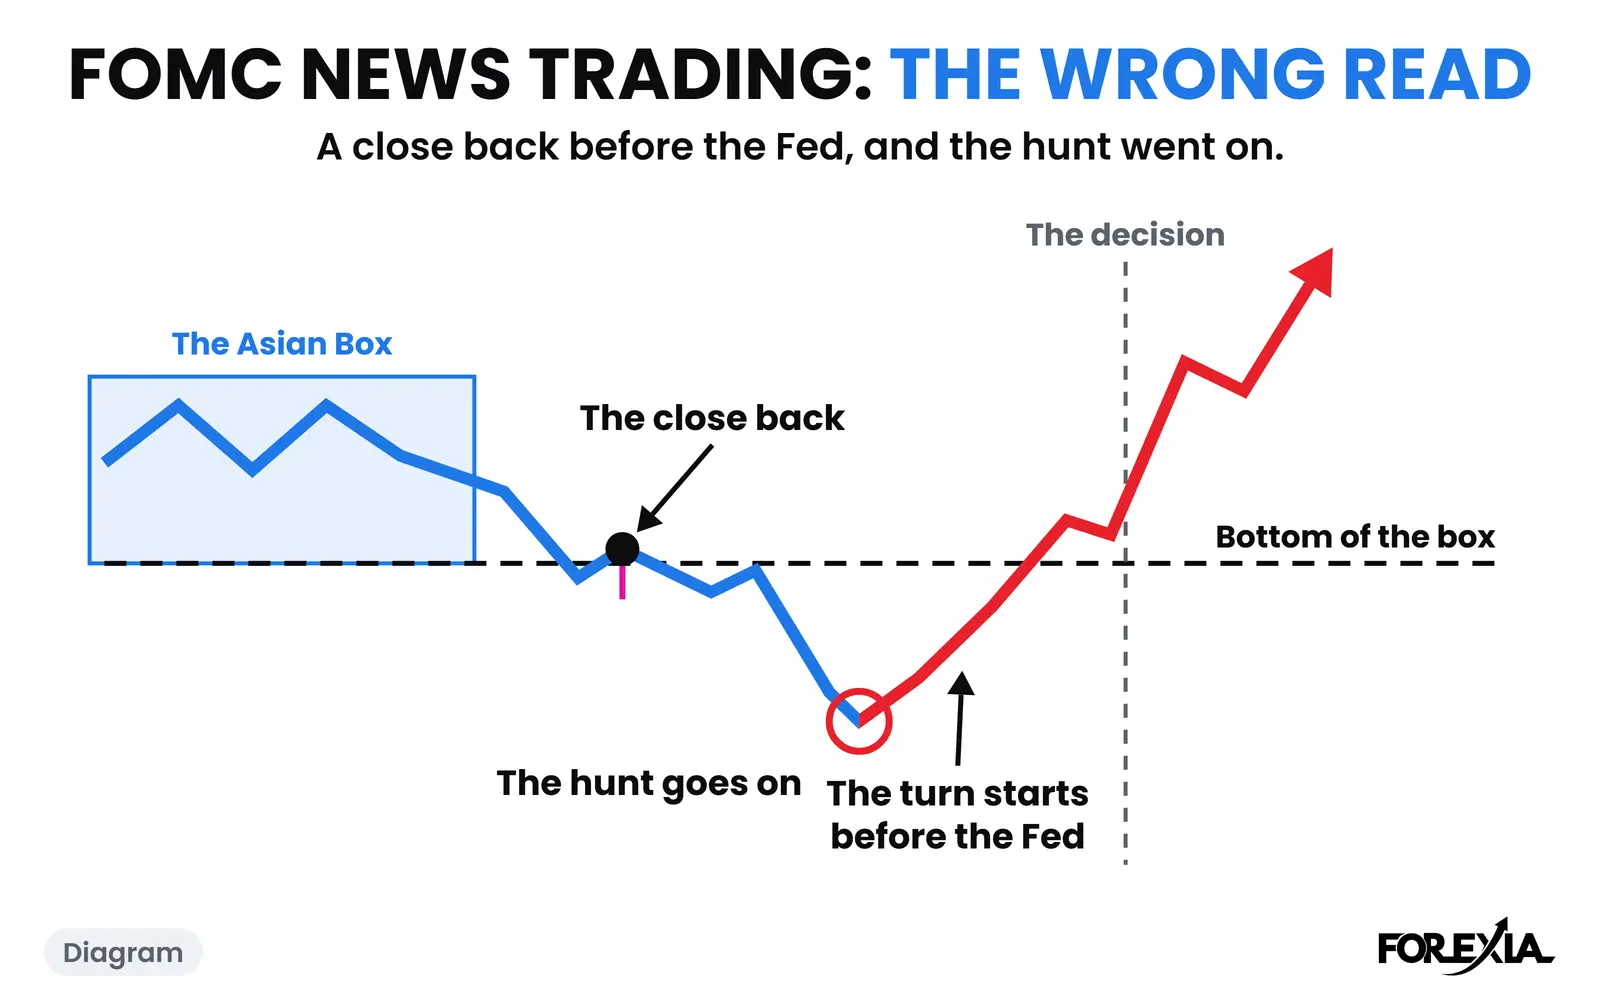
FOMC news trading forex on a day we got wrong: gold, 29 July 2026, closed back and the hunt went on. Every 2026 Fed date, and how long a close back lasts.
9 min read
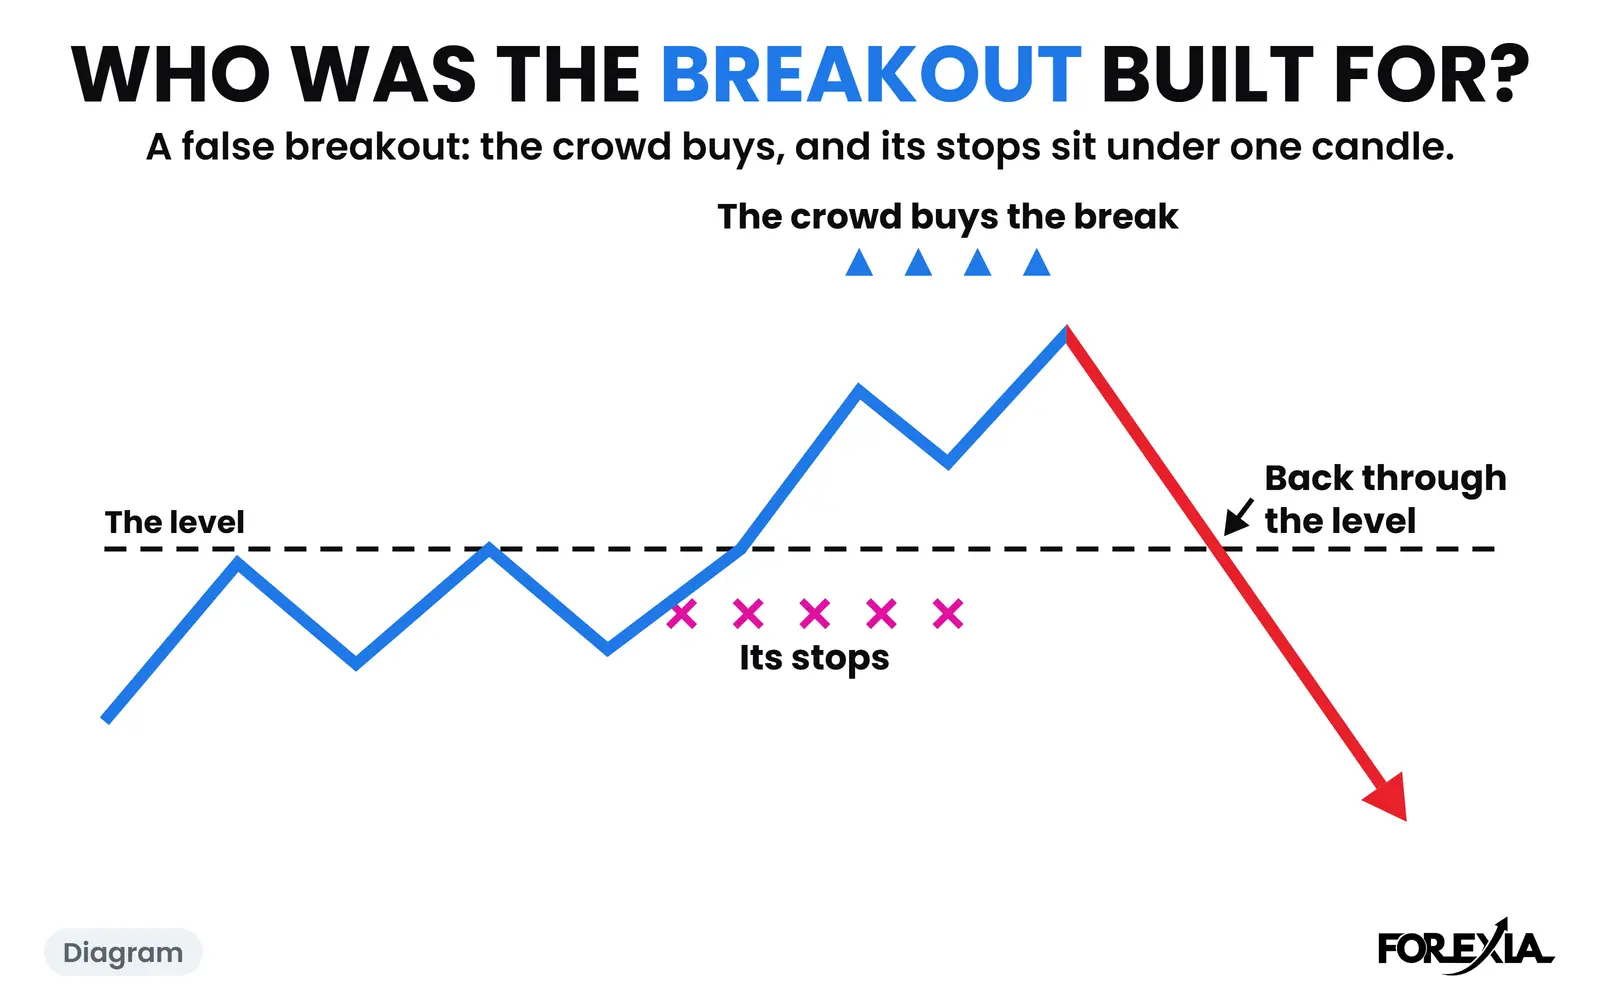
A false breakout in forex on three real days: whose stops sit behind a clean break, why price goes there, and how often a break turns out to be real.
7 min read
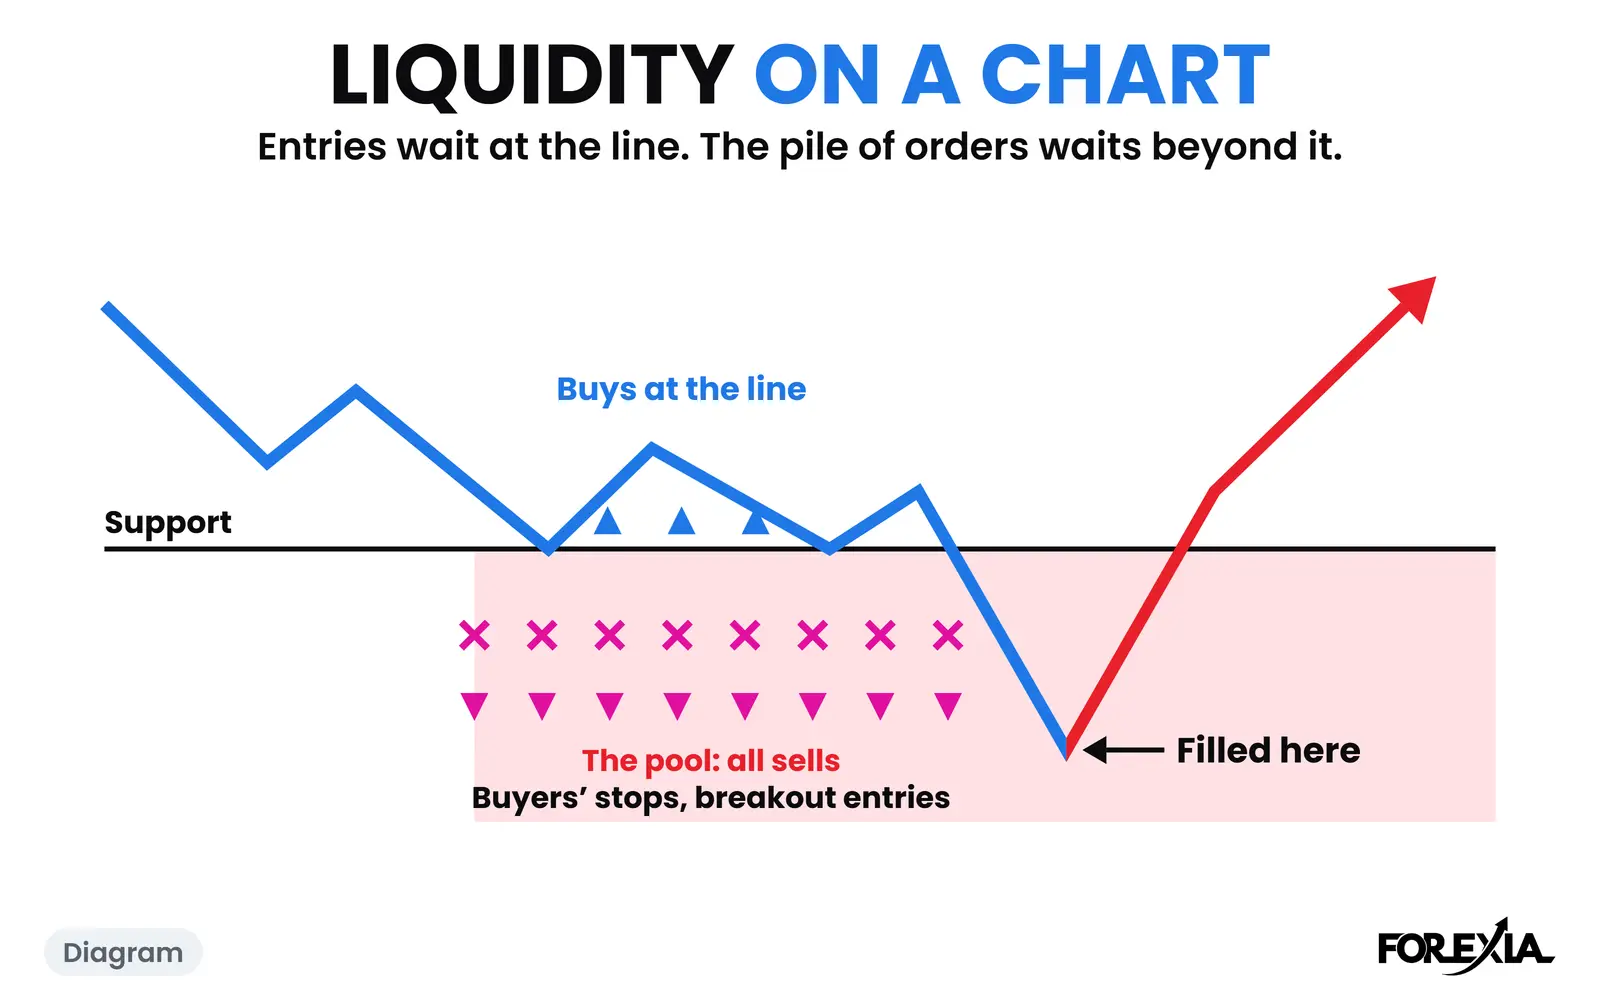
Where is liquidity on a chart? Just past each line the crowd draws, in its stops and breakout orders. Three real 2026 days: AUD/USD, gold and NZD/USD.
8 min read
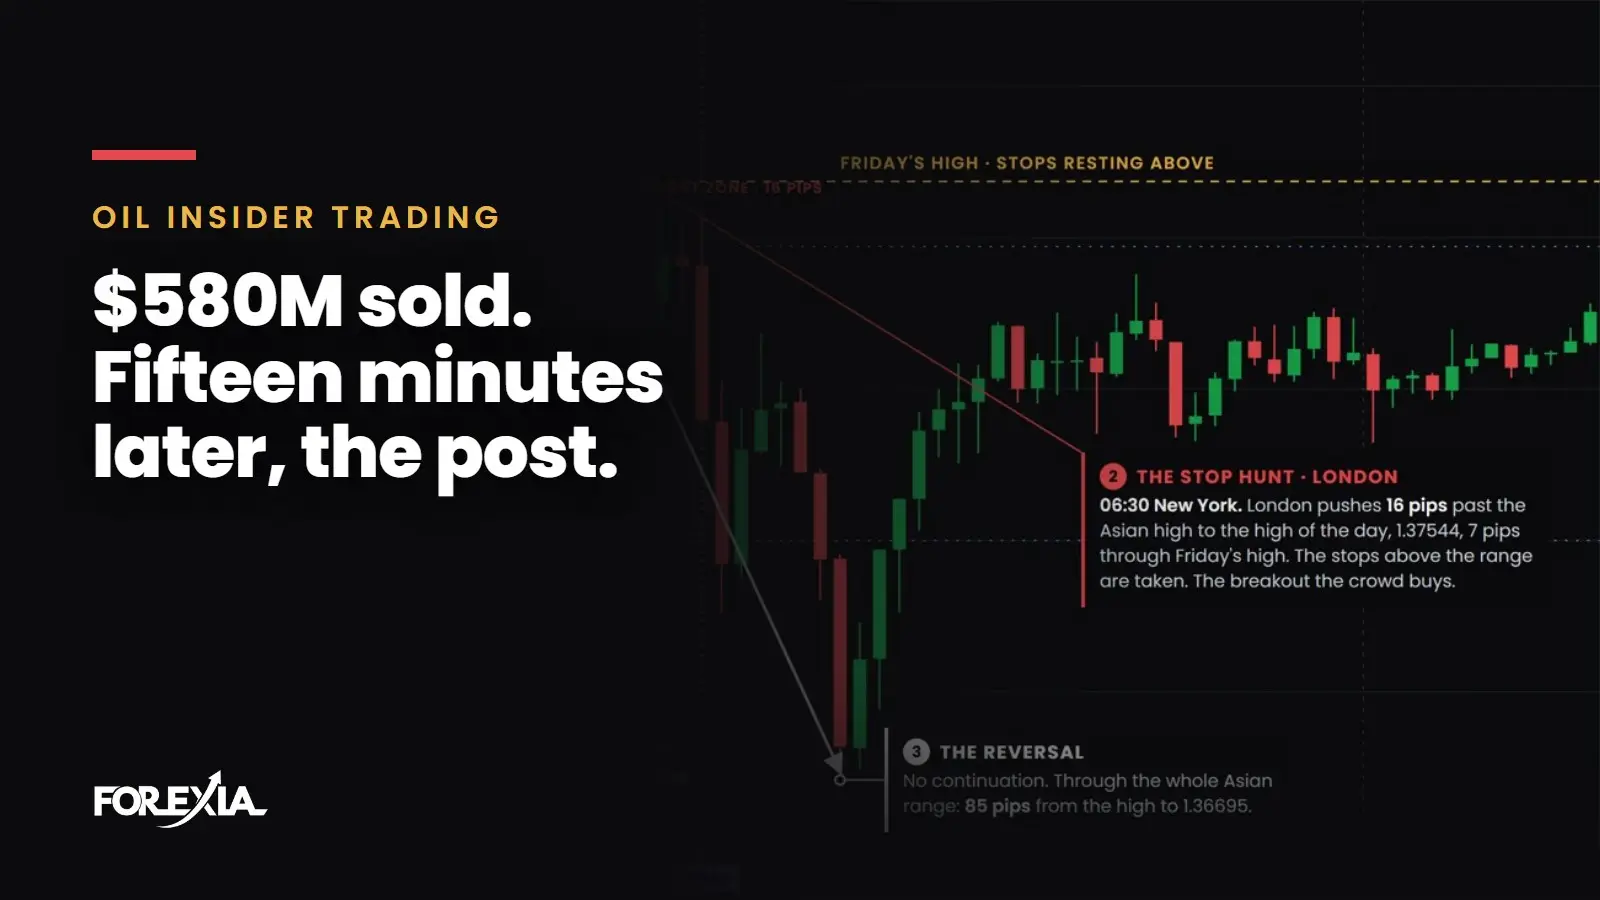
Oil insider trading referral, retracted: a $580M bet against oil 15 minutes before Trump's Iran post. How the trap was built, on the chart.
10 min read

Why is gold falling after the weakest US jobs report in months? The number gave buyers their reason, and $12bn had already left gold futures.
7 min read
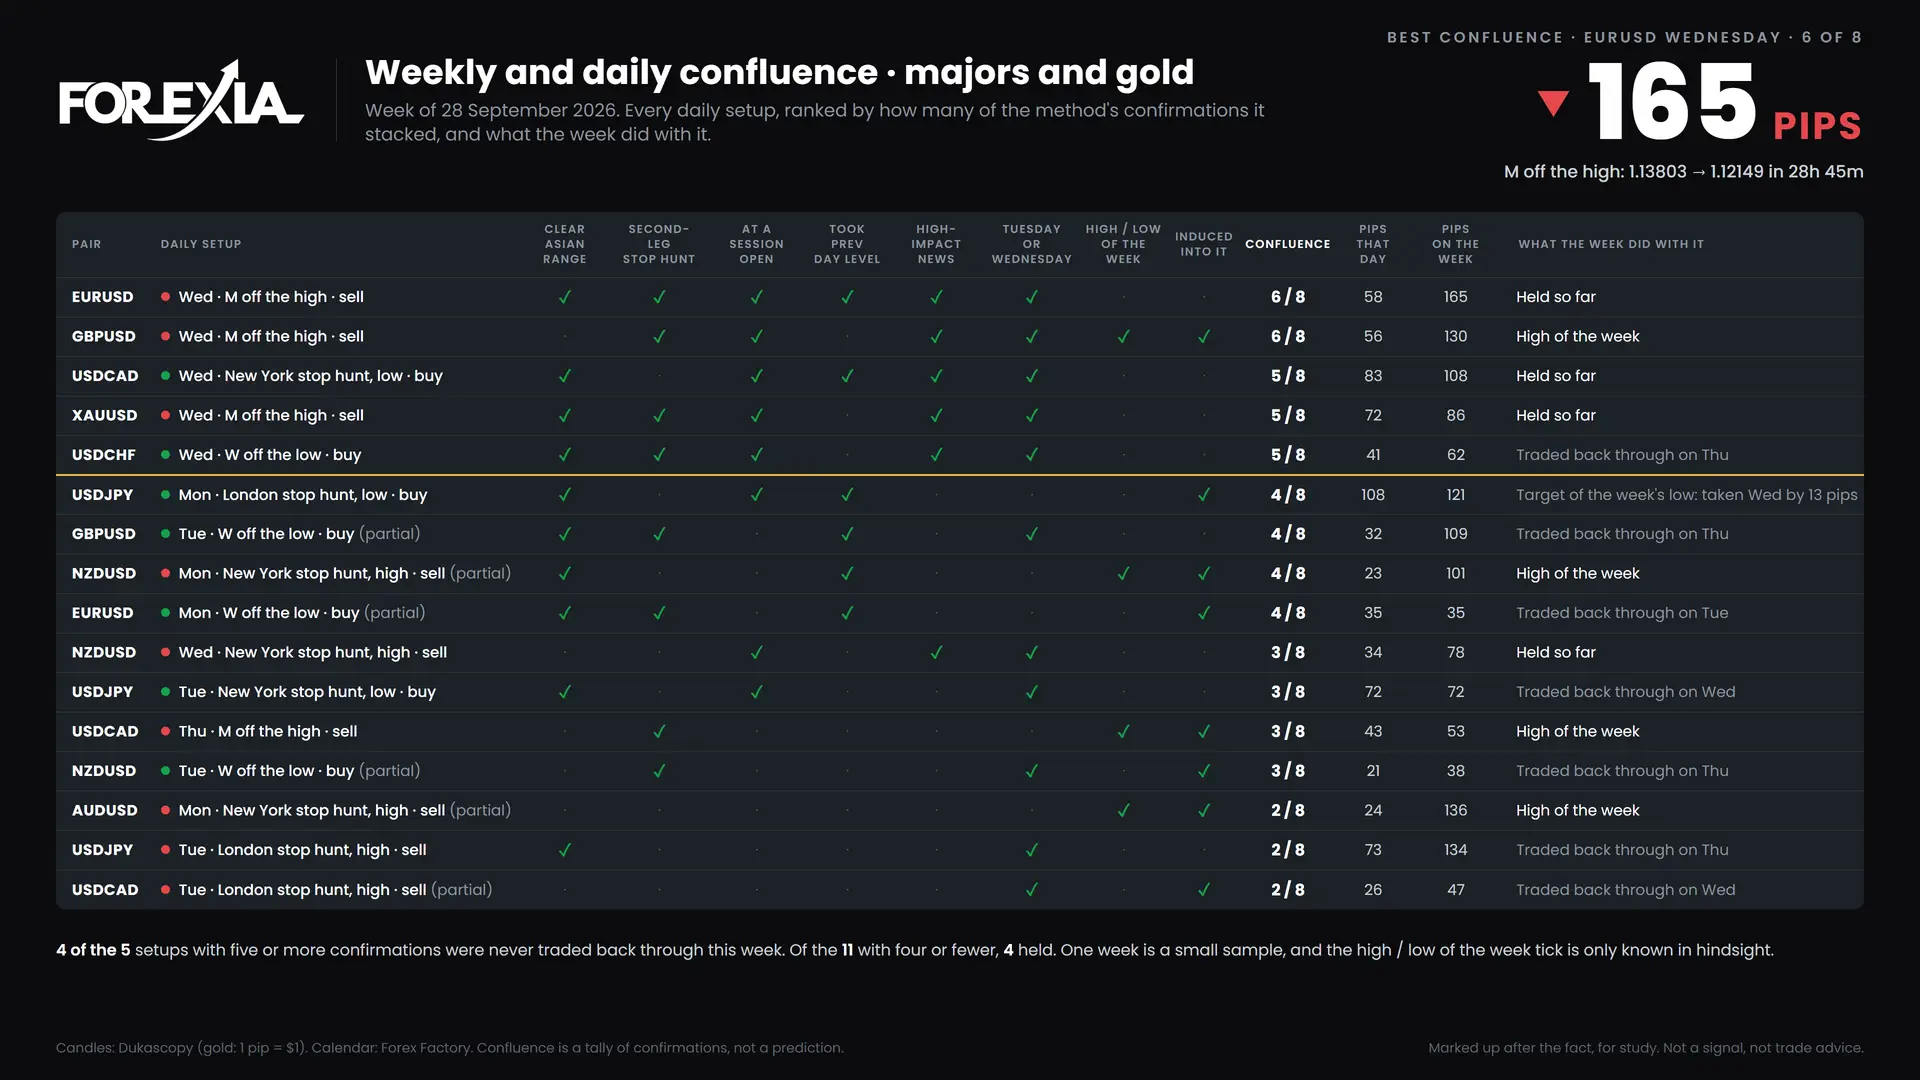
Forex chart markups, week by week: stop hunts, M and W formations and midweek reversals on the majors and gold, drawn on real candles.
8 min read
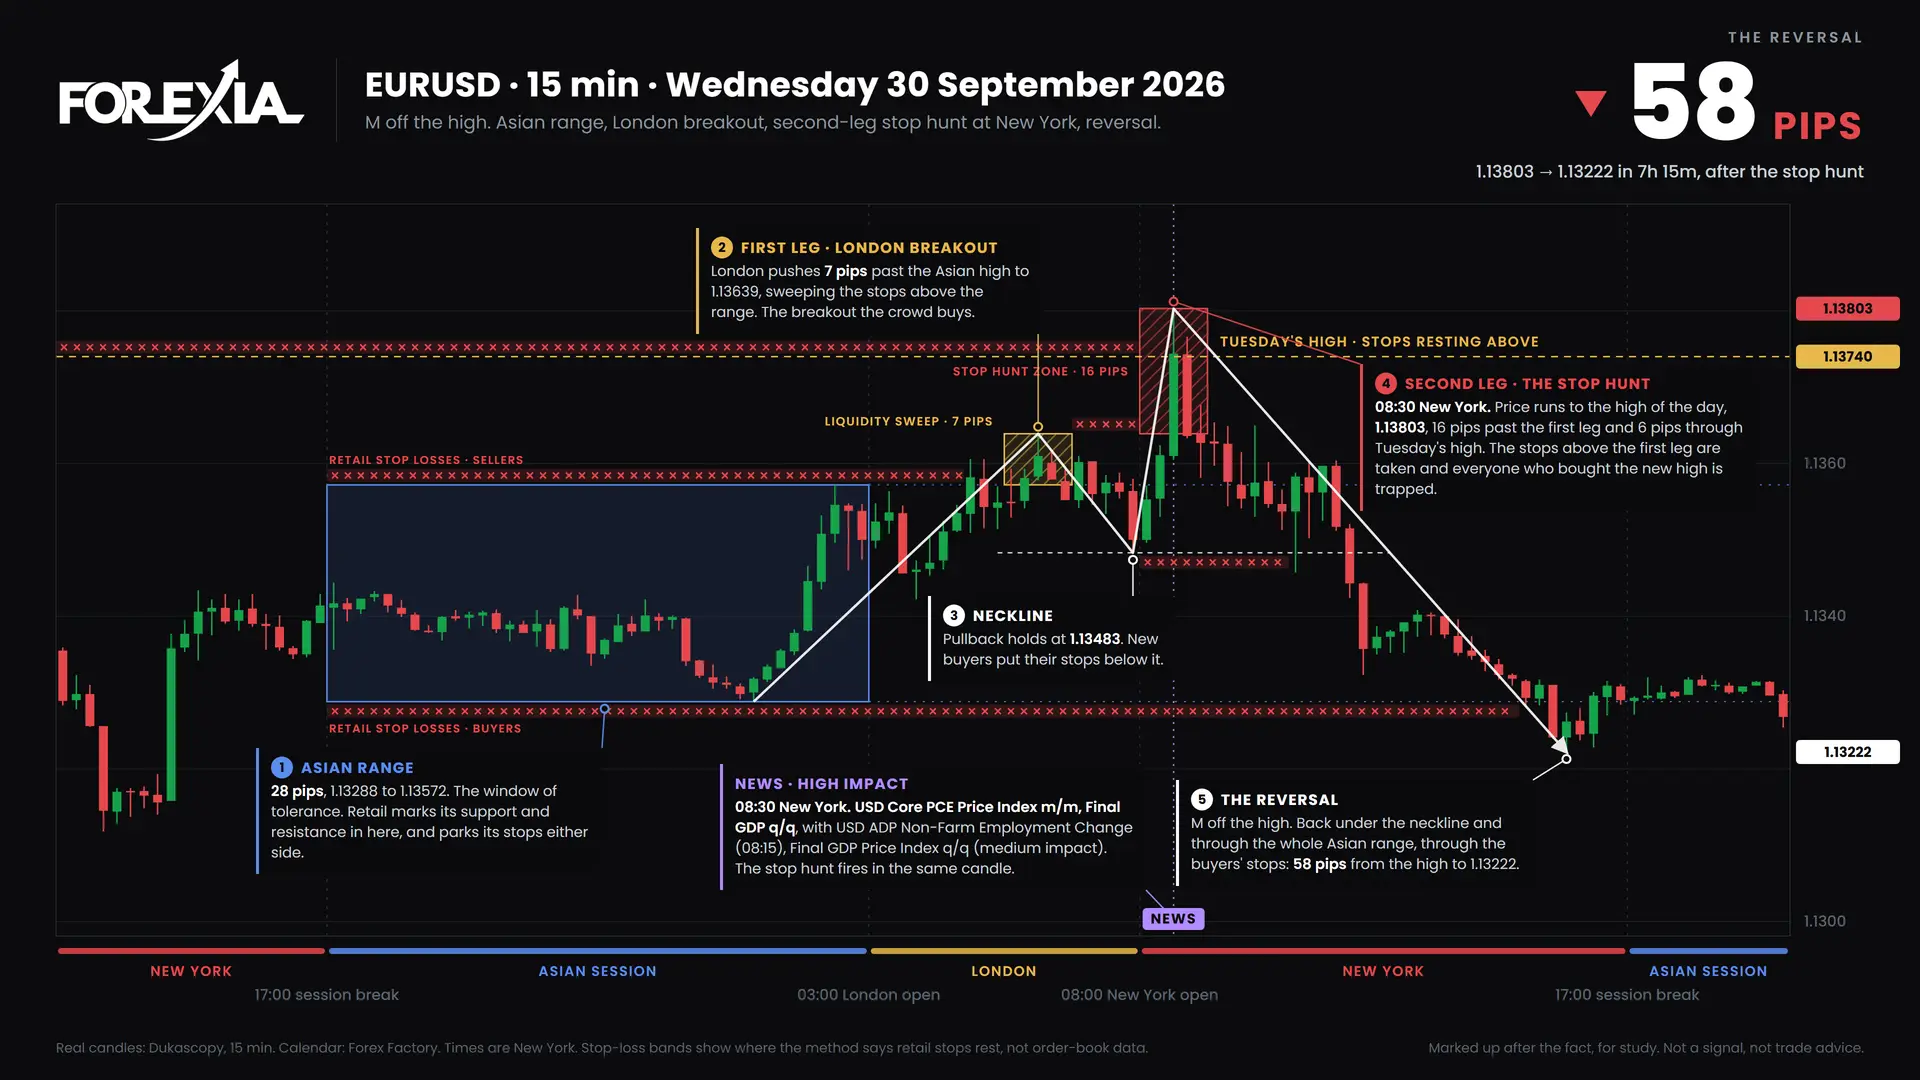
Reverse price action reads a chart from the side of the crowd: where retail orders and stop losses sit, and how price collects them. A visual guide.
7 min read

An EURUSD stop hunt through Tuesday's high on US PCE data completed an M formation and fell 165 pips. Chart markups, 28 September 2026.
15 min read
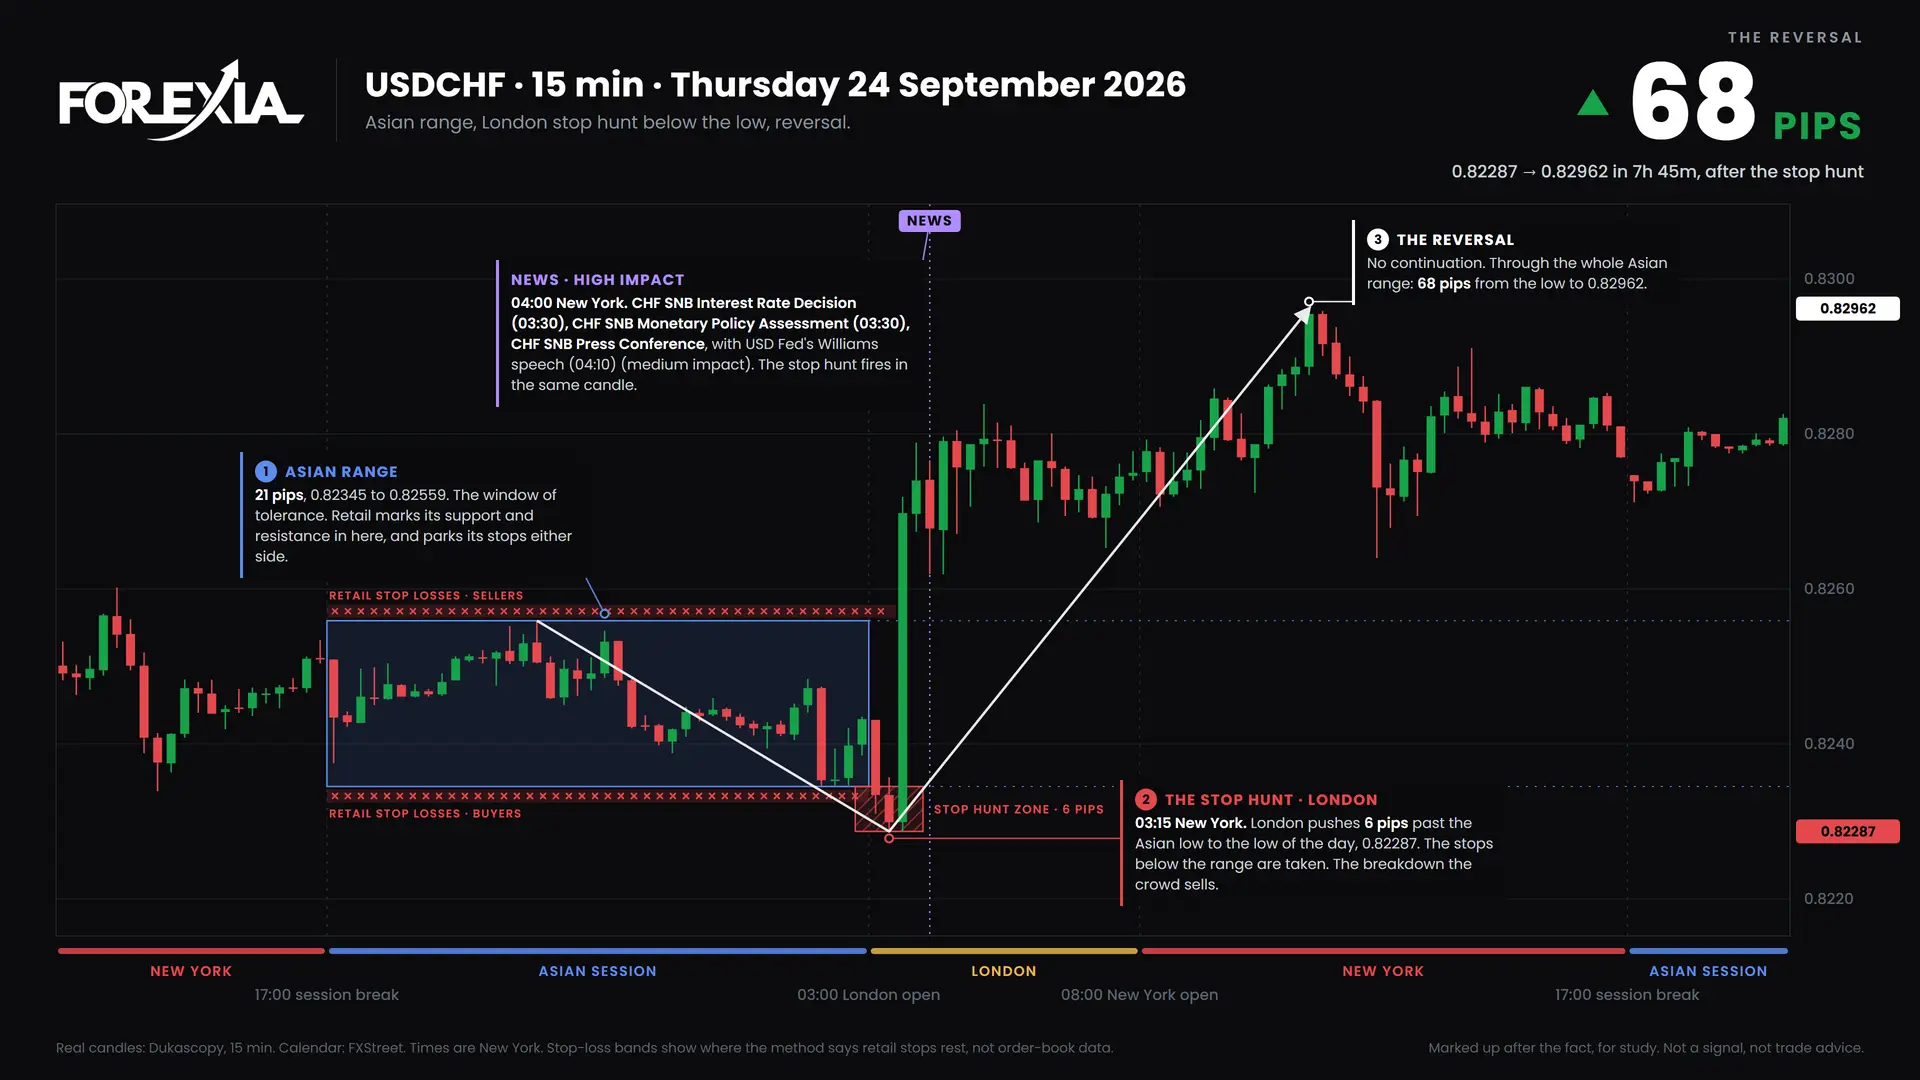
A USDCHF stop hunt fired 15 minutes before the SNB rate decision and reversed 68 pips. Real chart markups, week of 21 September 2026.
13 min read
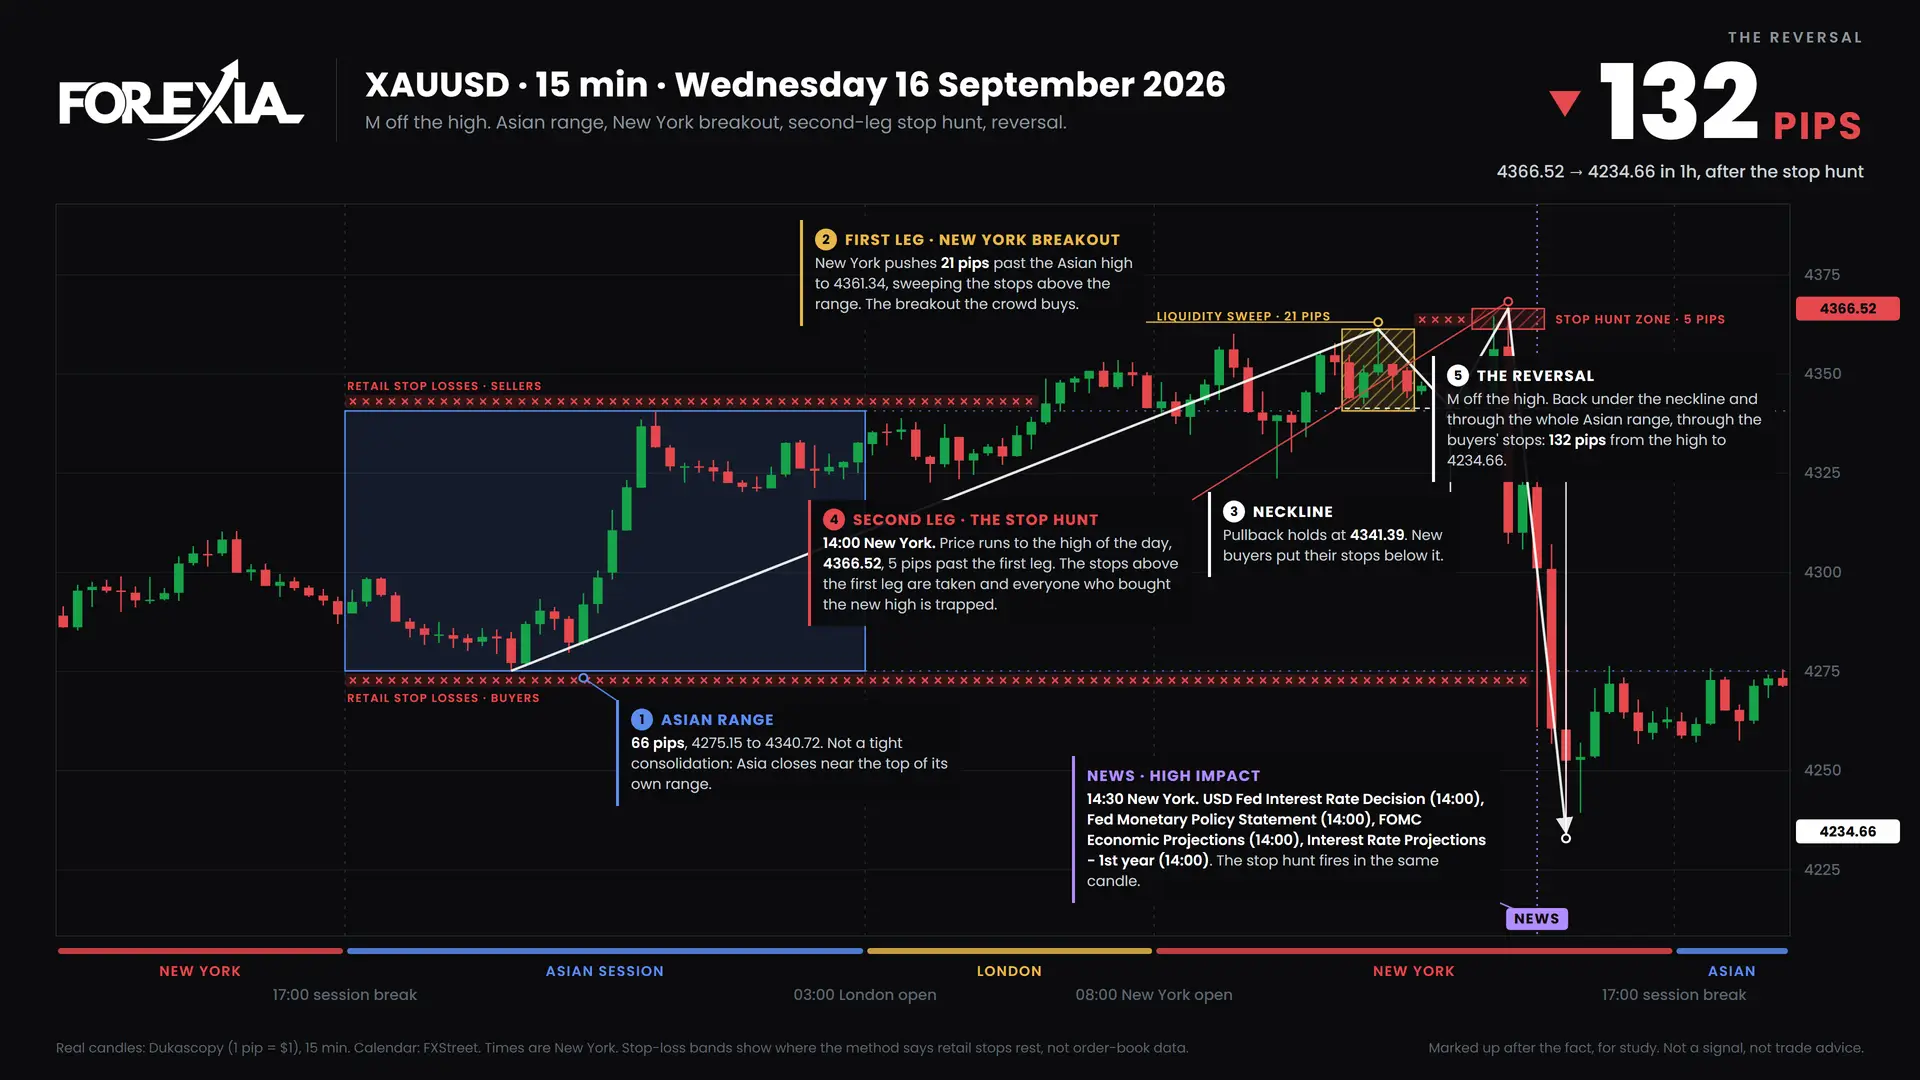
The FOMC stop hunt completed M formations on gold, AUDUSD and NZDUSD in the candle of the Fed decision. Chart markups, 14 September 2026.
14 min read
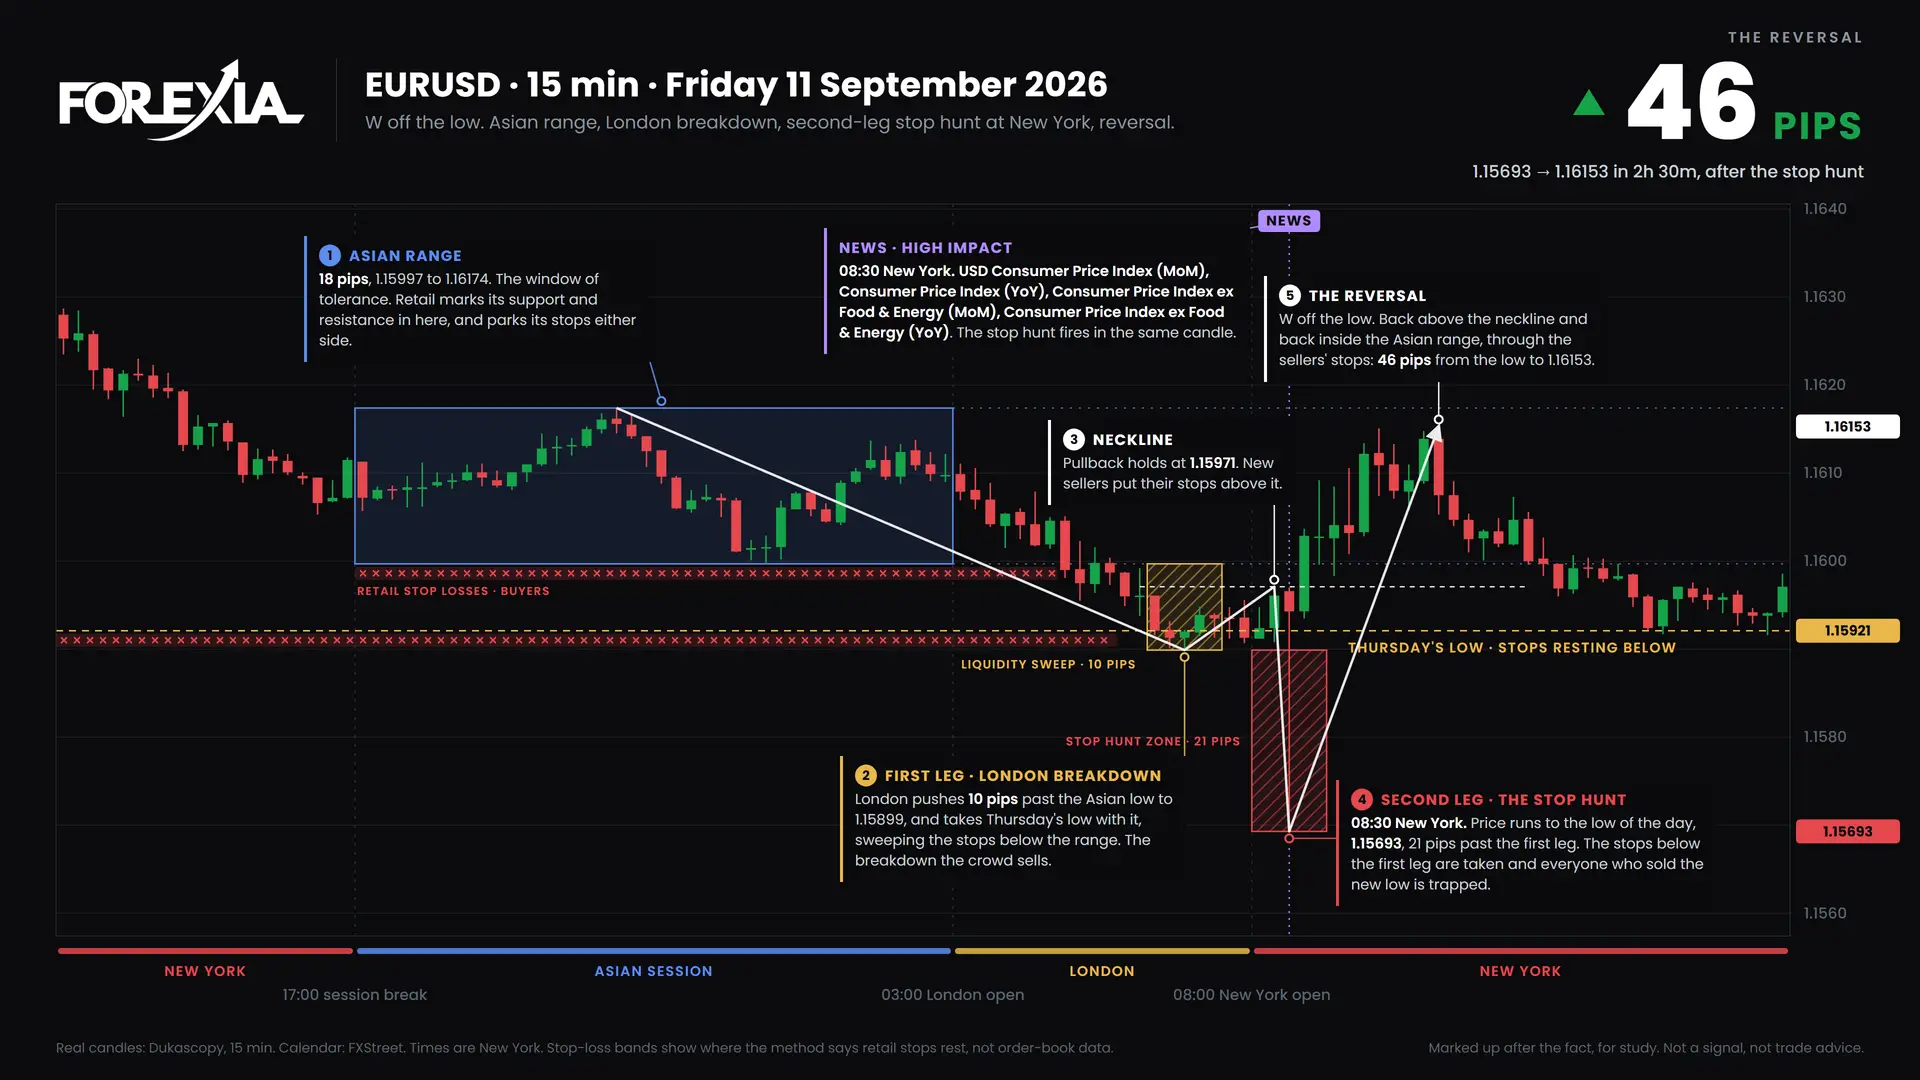
The CPI stop hunt hit EURUSD, GBPUSD and gold in one candle, with an EURUSD W formation at the low of the week. Markups, 7 September 2026.
16 min read
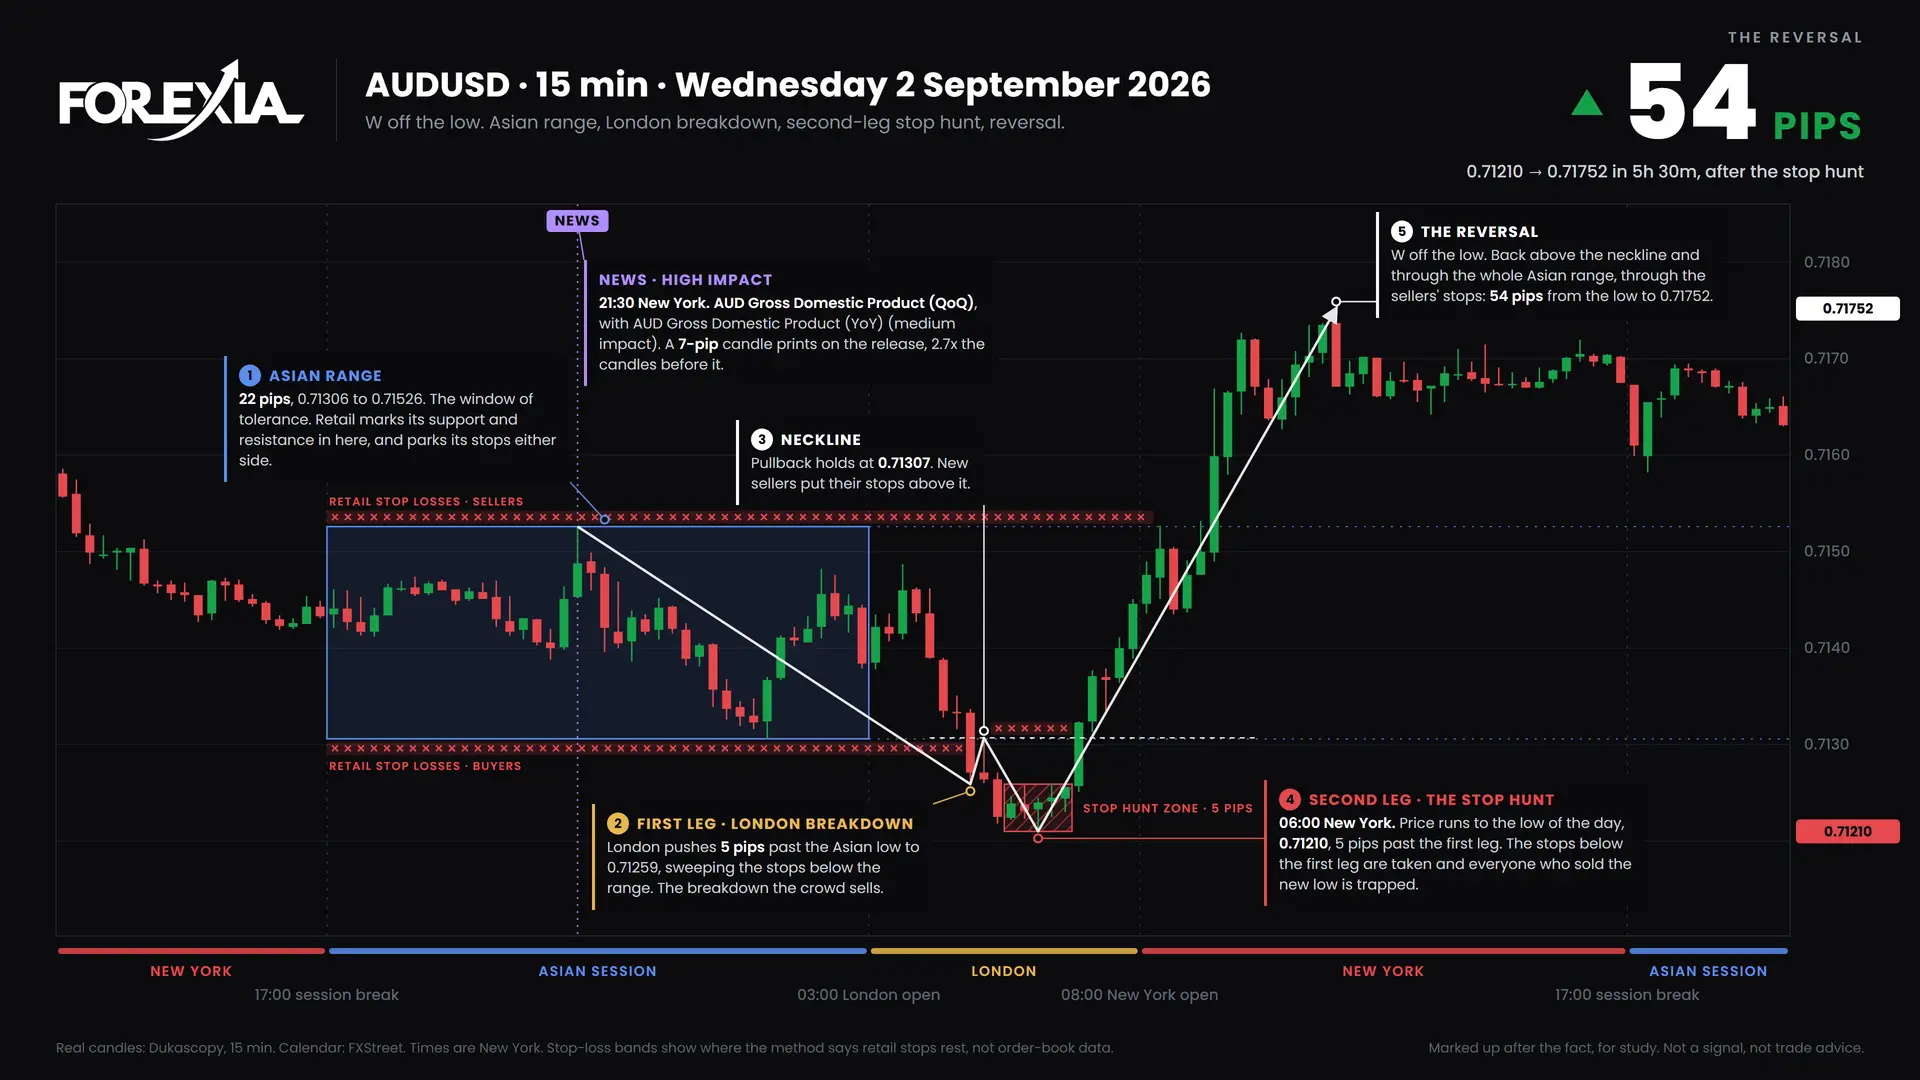
An AUDUSD W formation marked the low of the week as all eight markets turned midweek. Real chart markups for the week of 31 August 2026.
13 min read
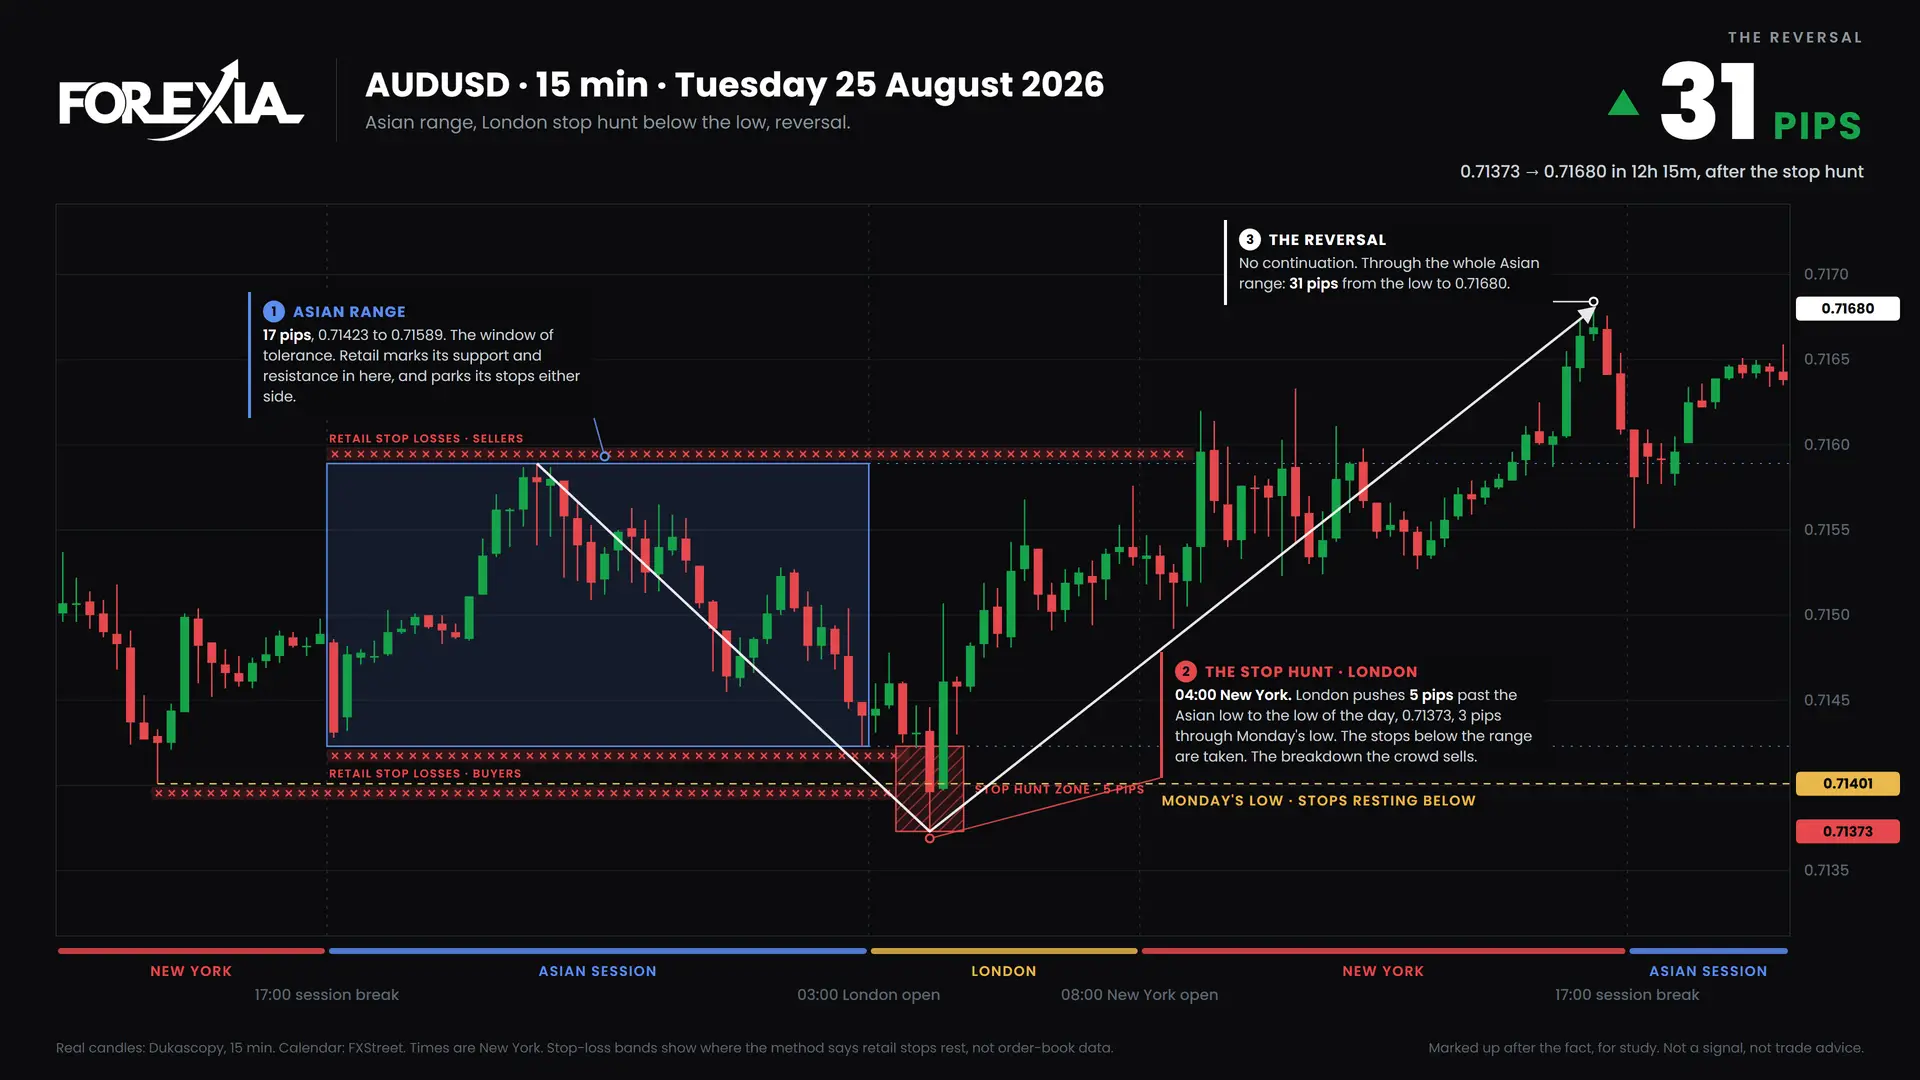
An AUDUSD stop hunt in London set the low of the week, and a second one on Friday set the high. Chart markups, week of 24 August 2026.
12 min read
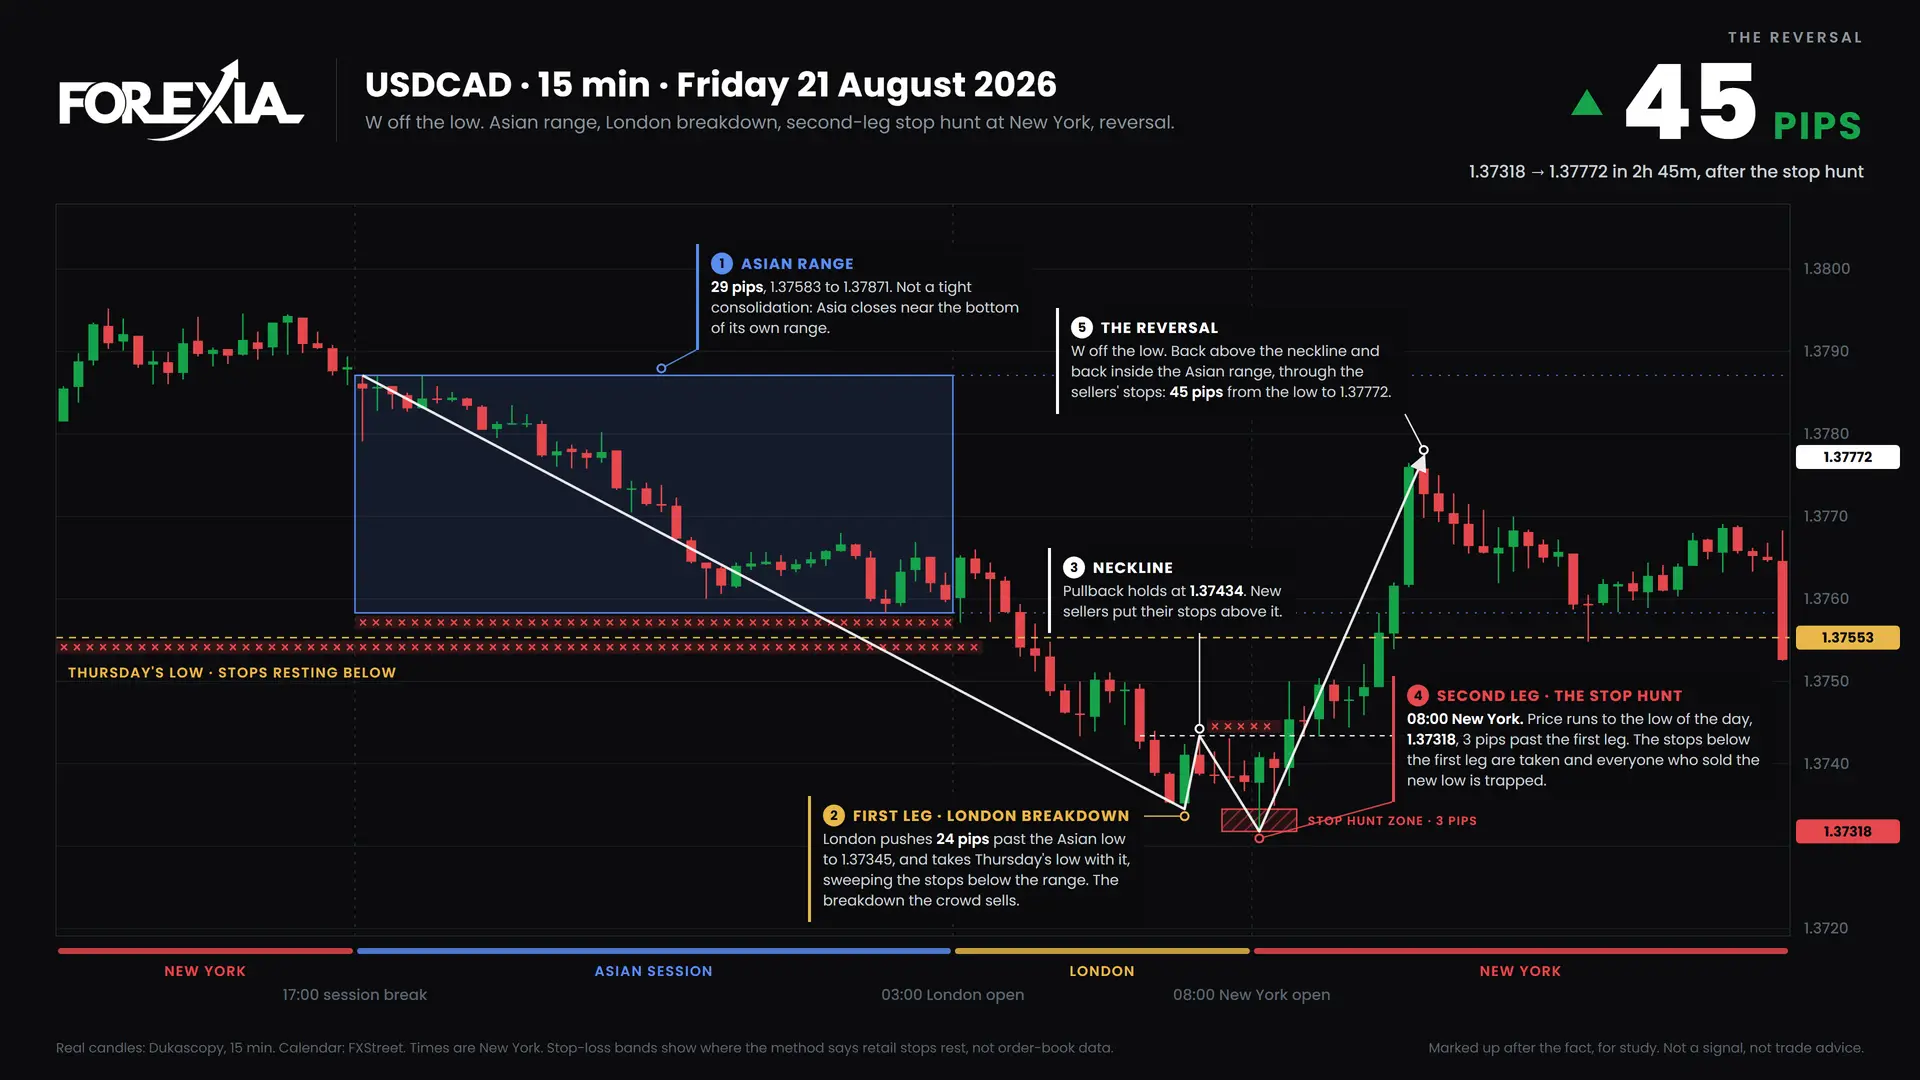
The USDCAD midweek reversal ran 178 pips from Tuesday's high to a Friday W formation at the low. Chart markups, week of 17 August 2026.
14 min read
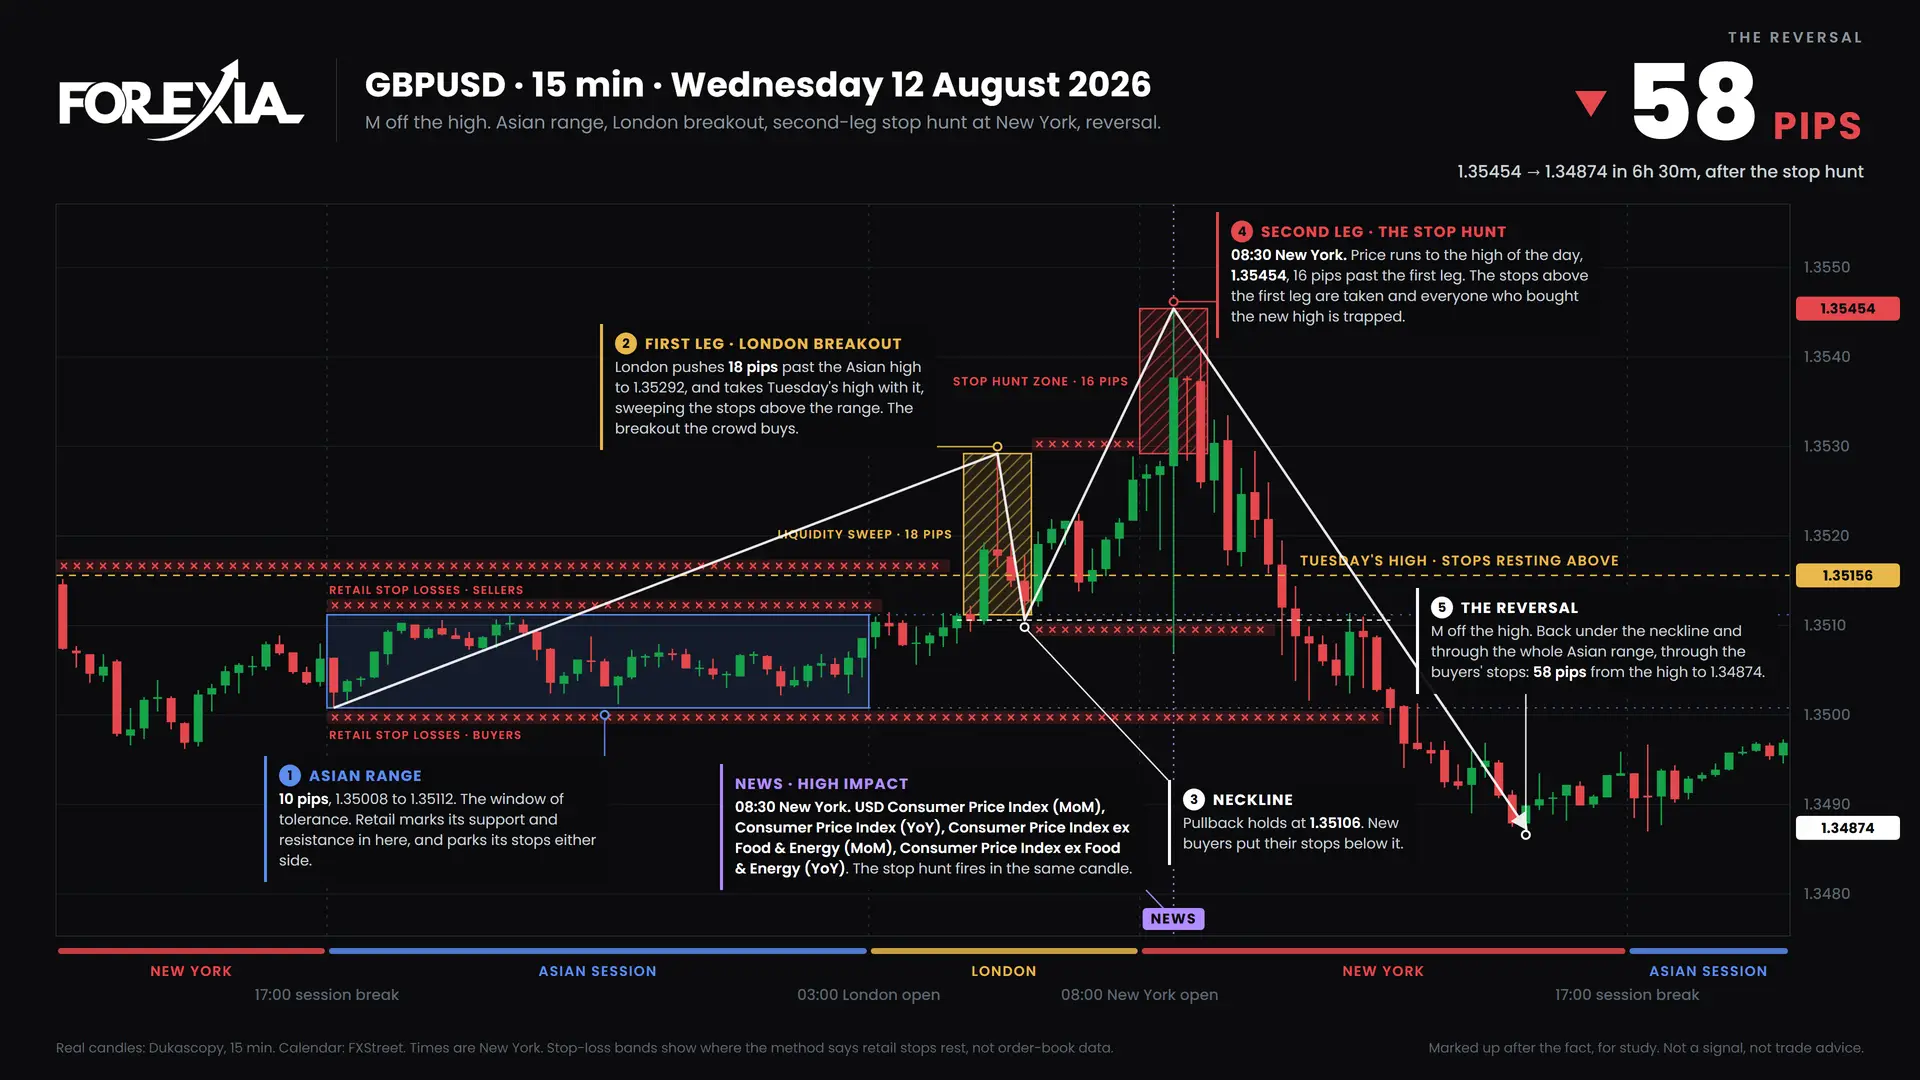
A GBPUSD M formation on US CPI scored 7 of 8 and fell 58 pips, yet the high did not survive the week. Chart markups, 10 August 2026.
13 min read
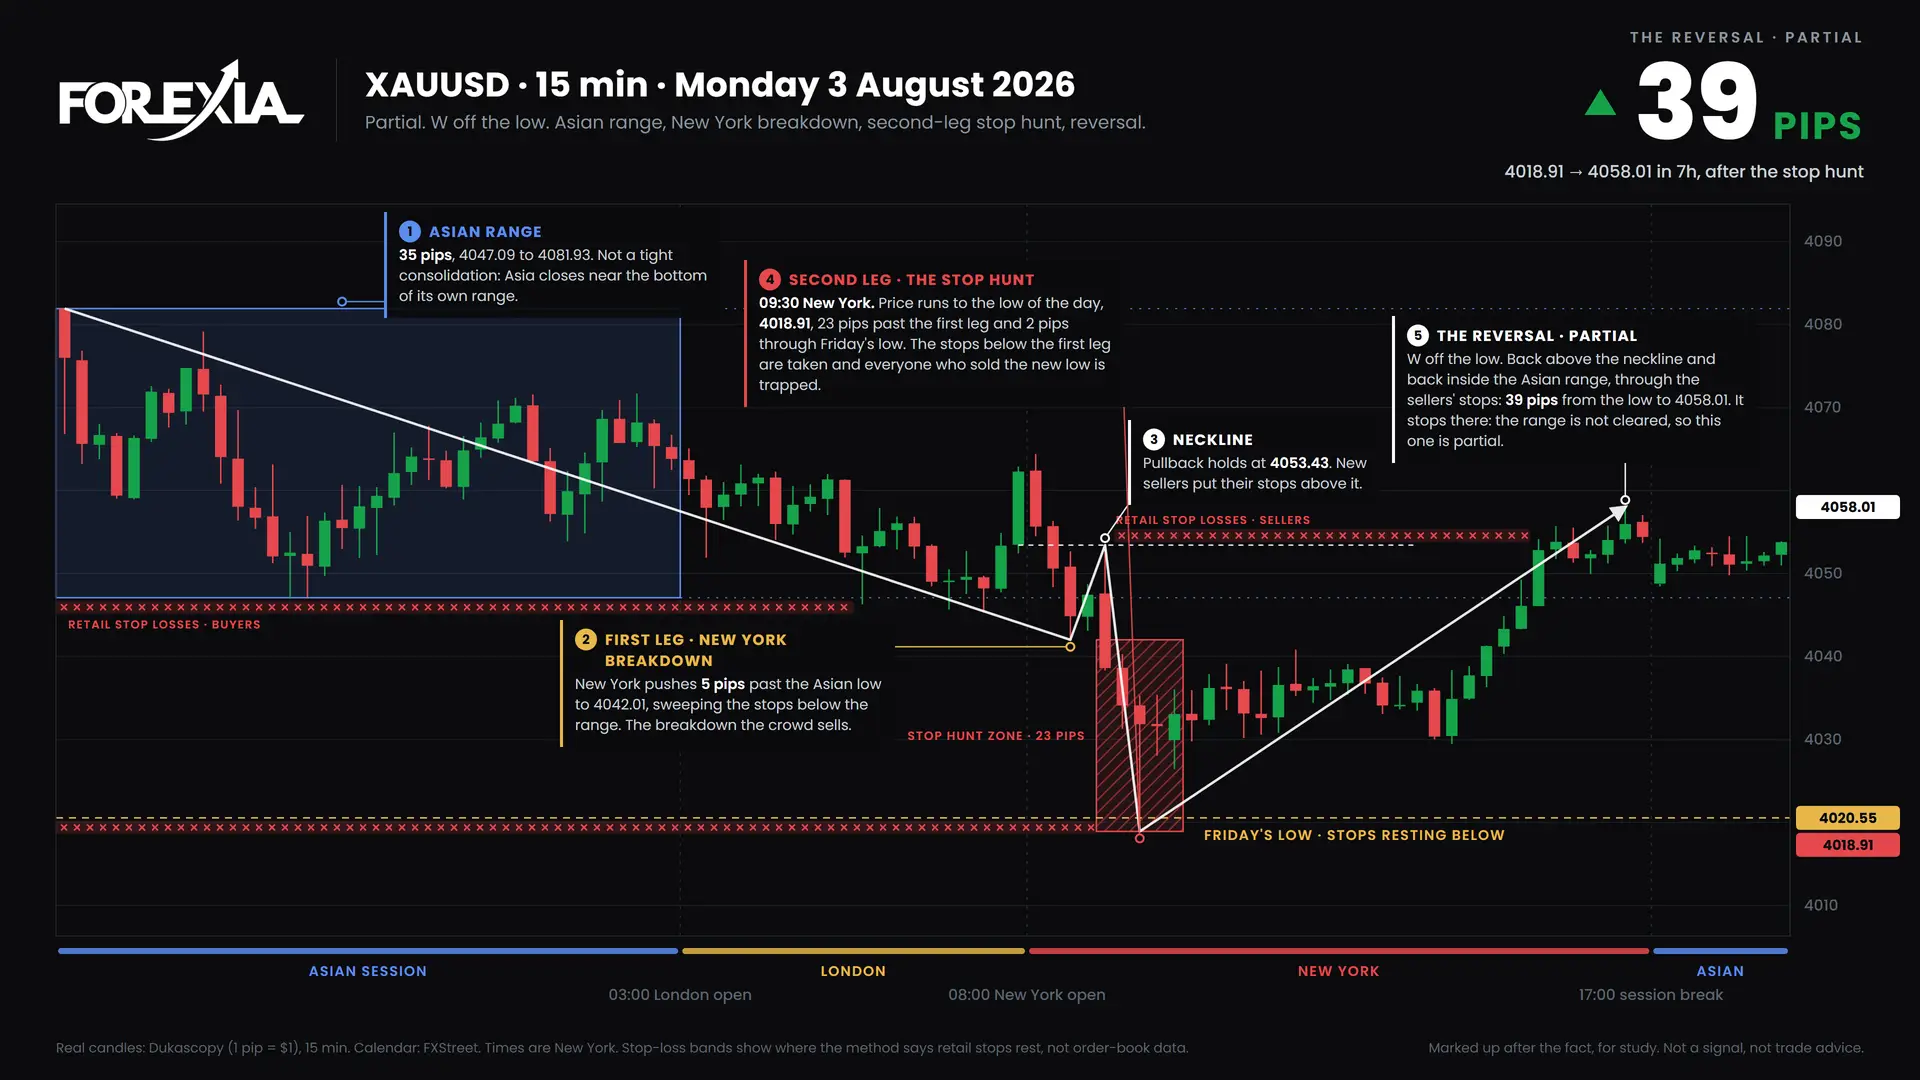
A gold W formation on Monday paid 39 pips that day and 353 on the week from the same low. Real chart markups, week of 3 August 2026.
11 min read
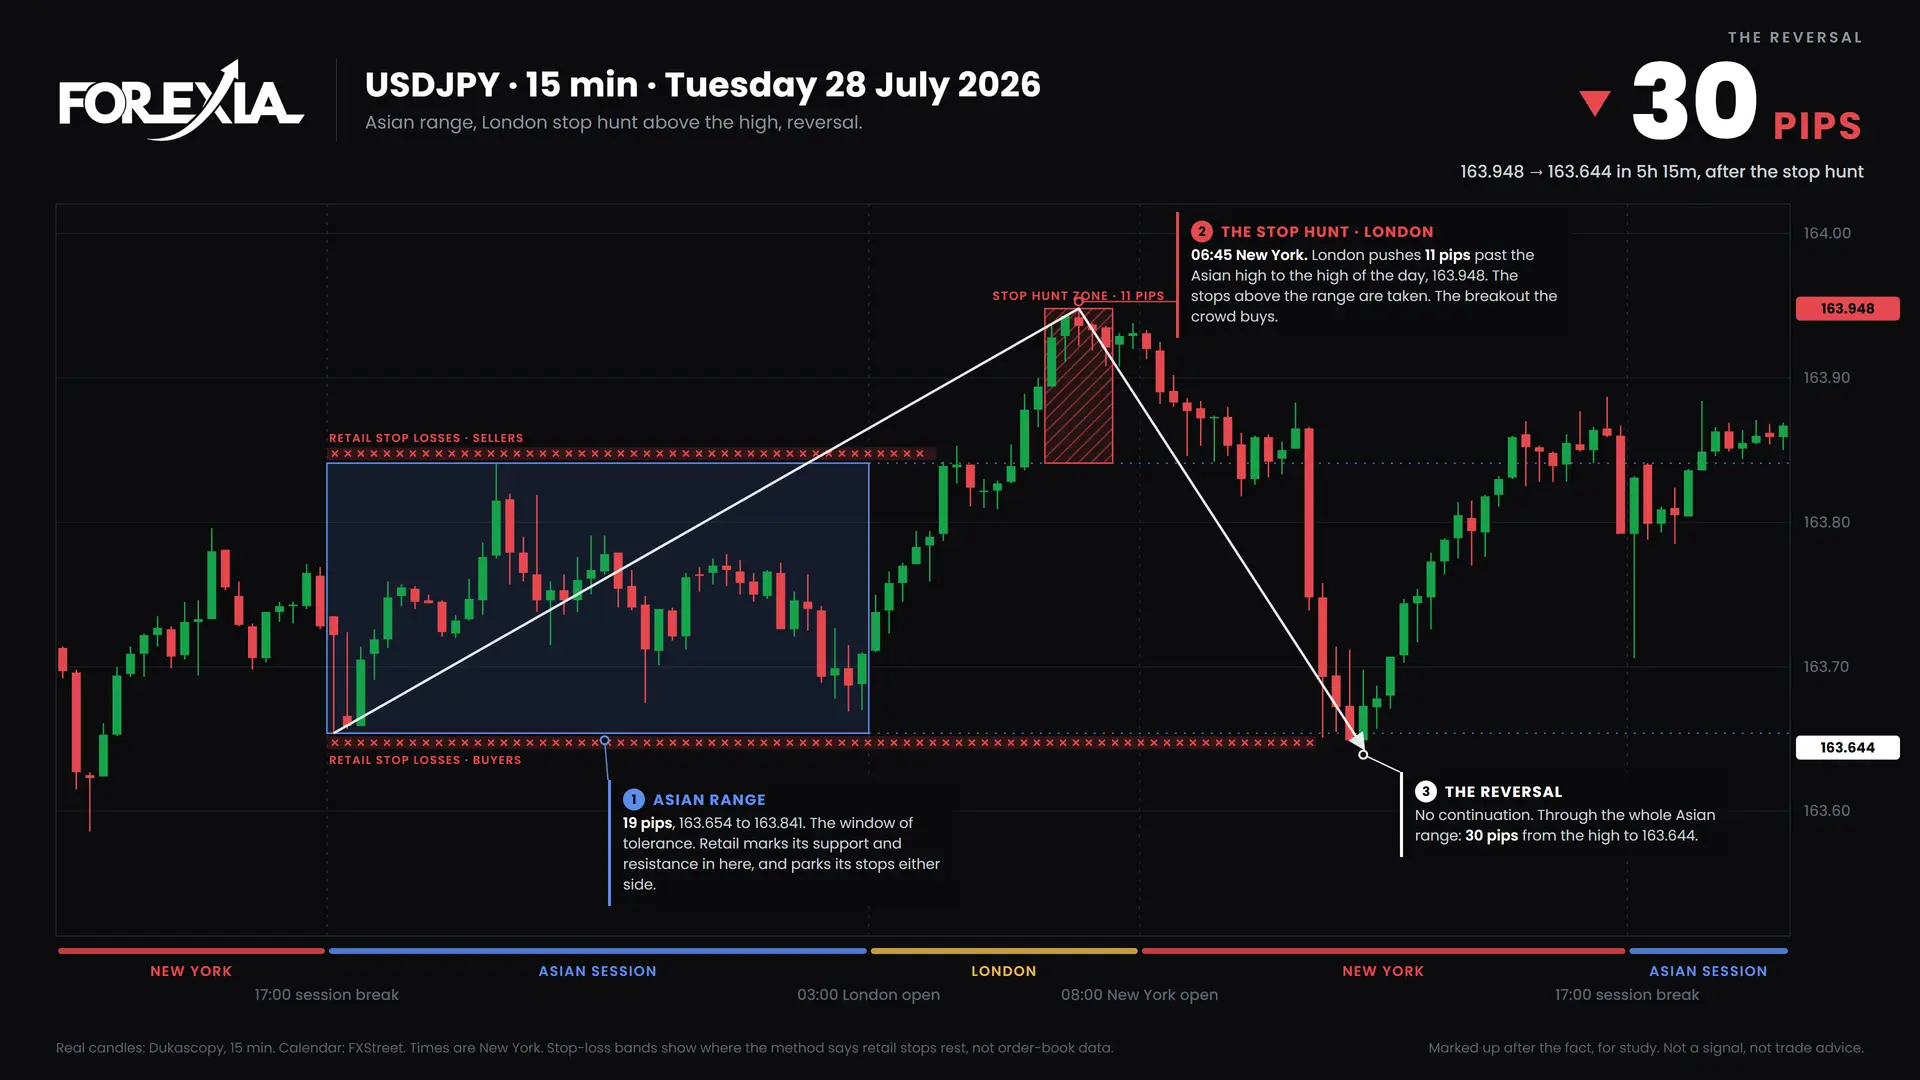
The USDJPY midweek reversal fell 675 pips from a Tuesday stop hunt, the largest move in six months of chart markups. Week of 27 July 2026.
16 min read
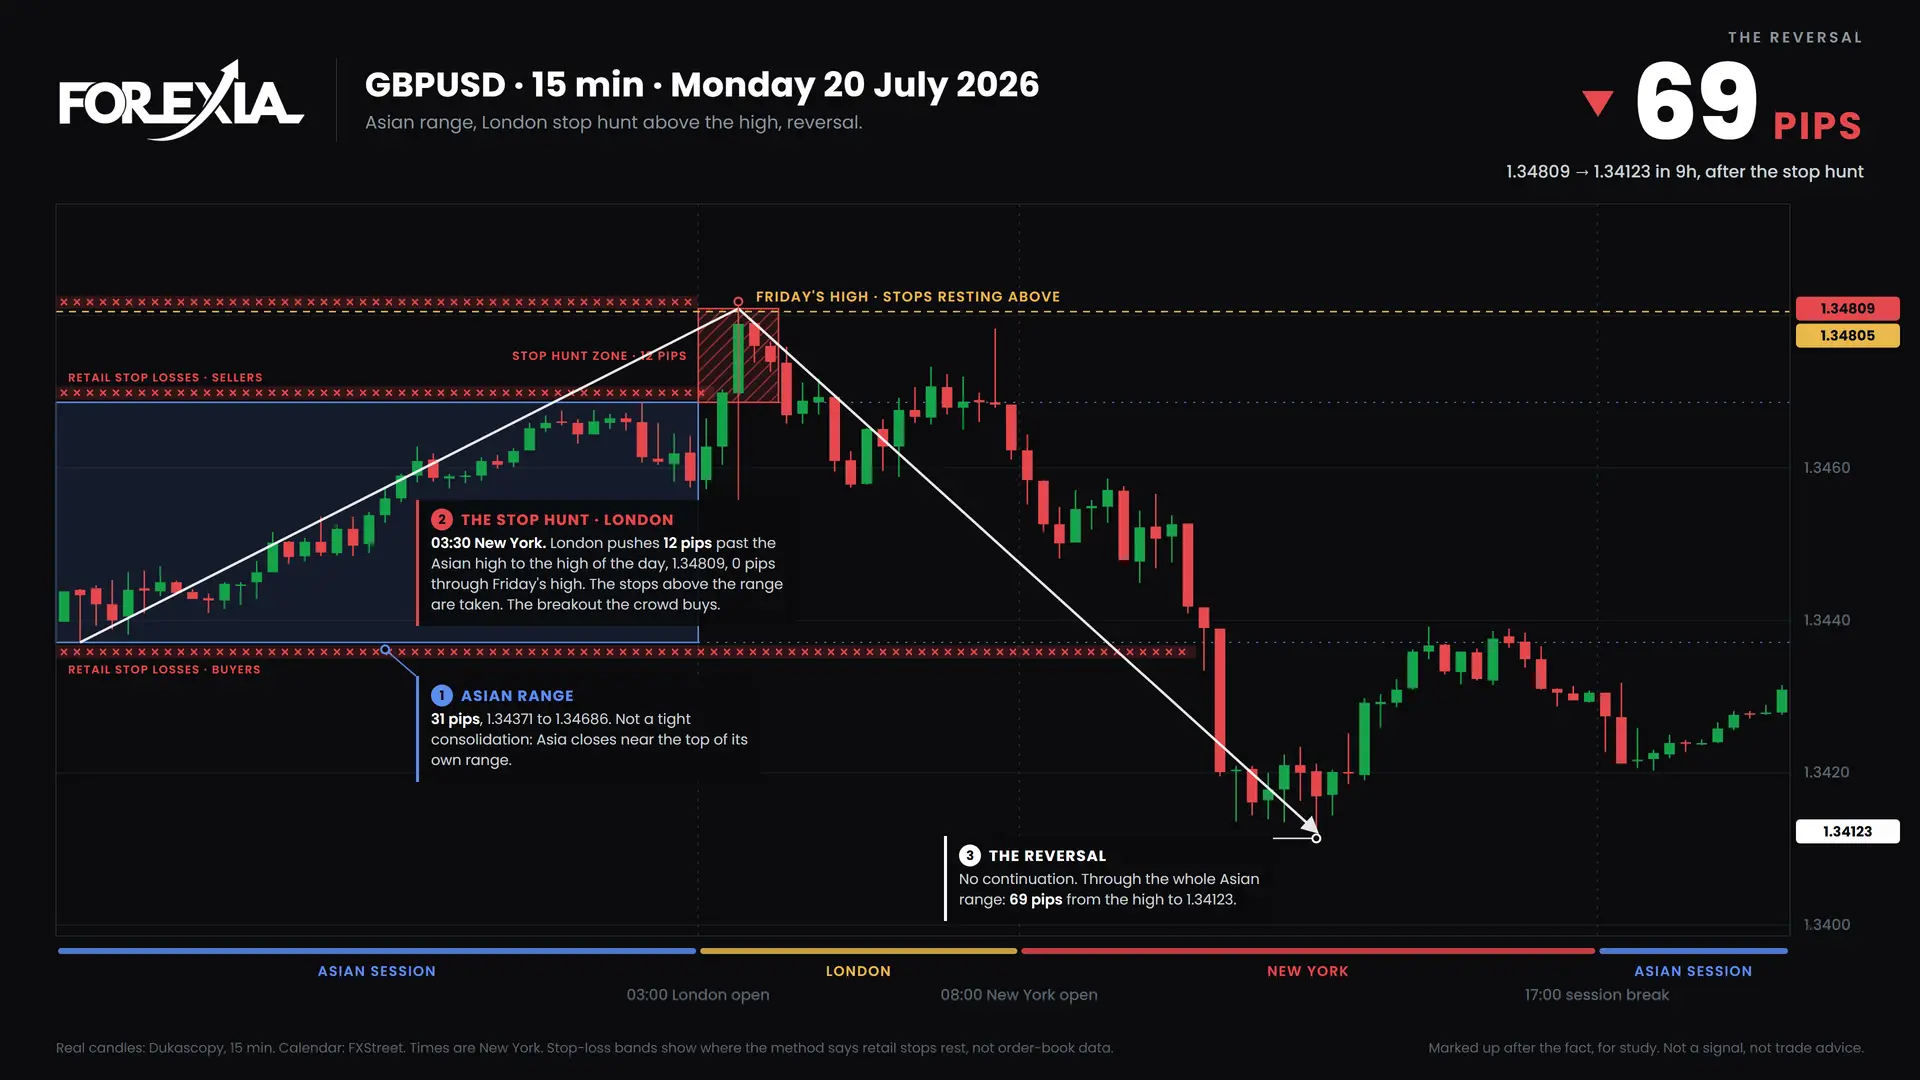
A GBPUSD stop hunt at Monday's London open set the high of the week, and price fell 185 pips. Real chart markups, week of 20 July 2026.
13 min read
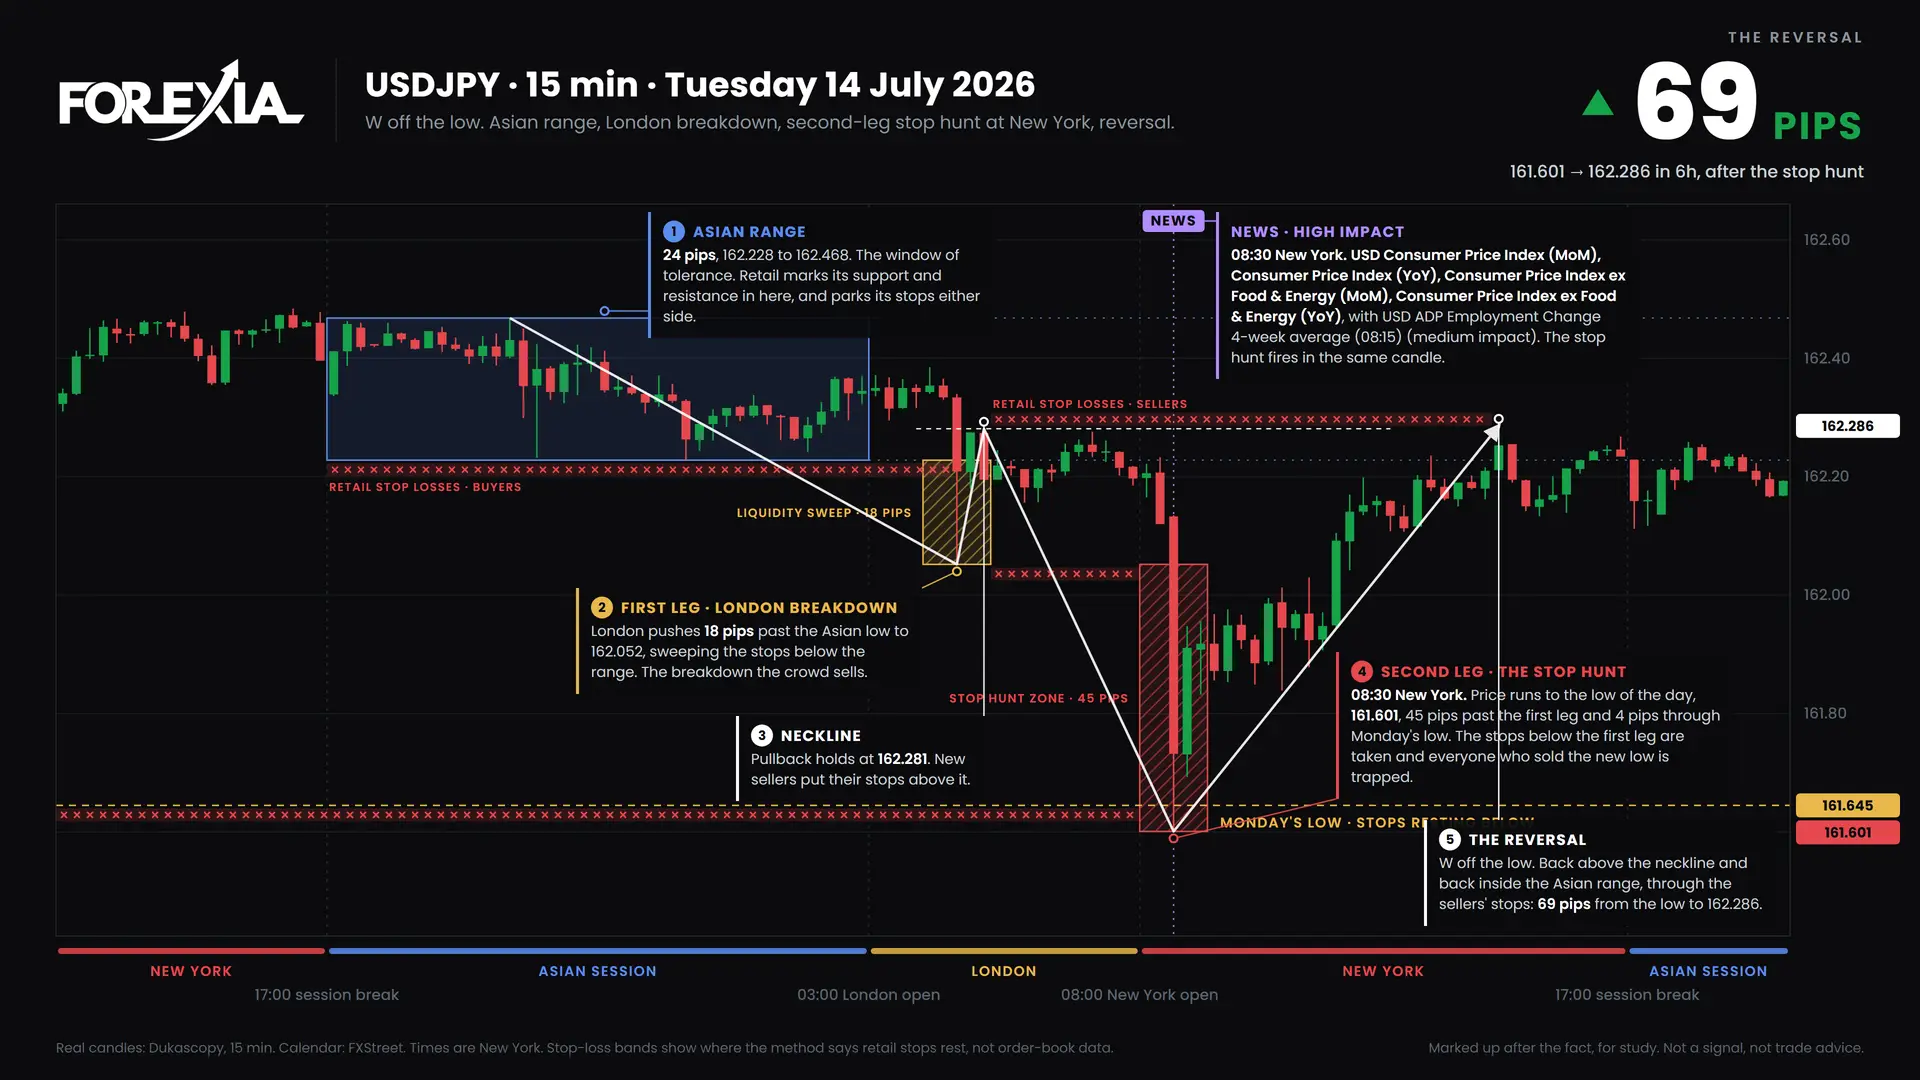
A USDJPY W formation hunted stops on US CPI, scored 7 of 8 and became the low of the week. Real chart markups, week of 13 July 2026.
16 min read
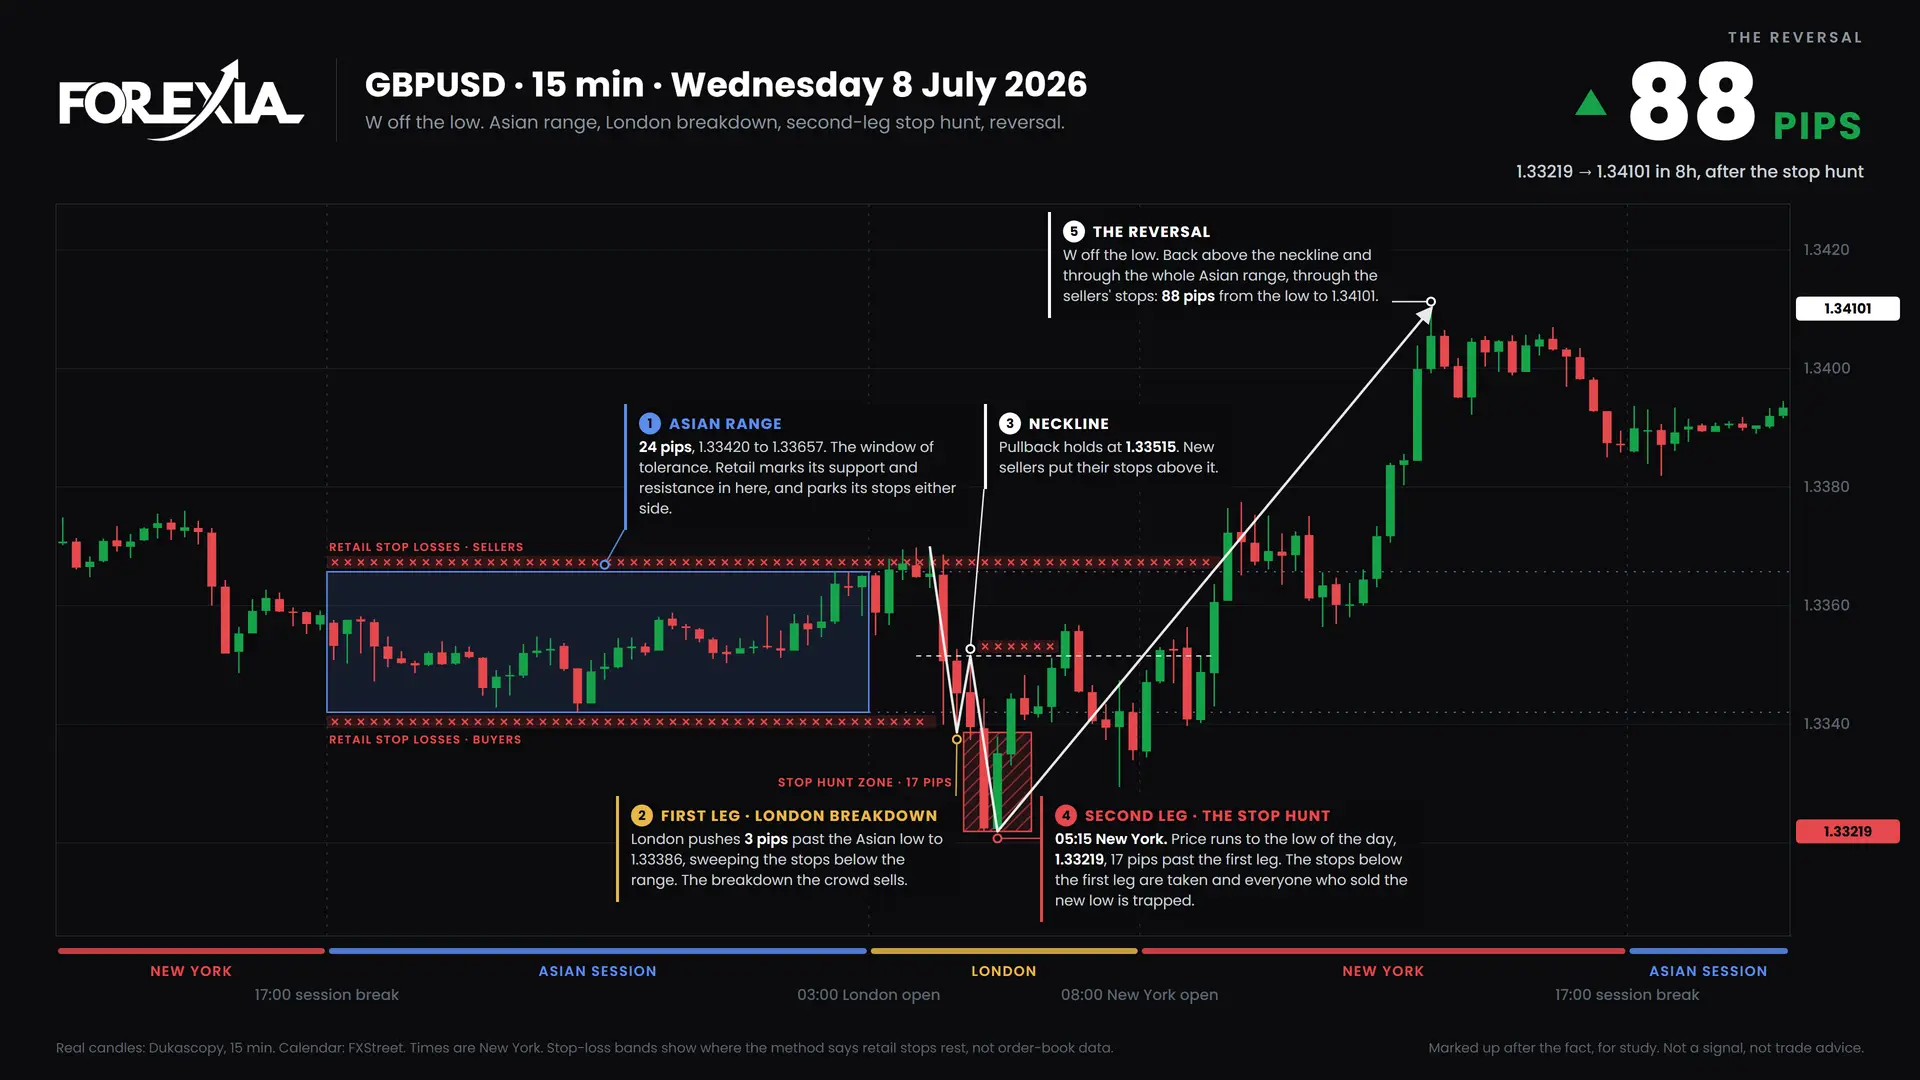
The GBPUSD midweek reversal began with a London W formation at the low of the week and ran 130 pips. Chart markups, week of 6 July 2026.
14 min read
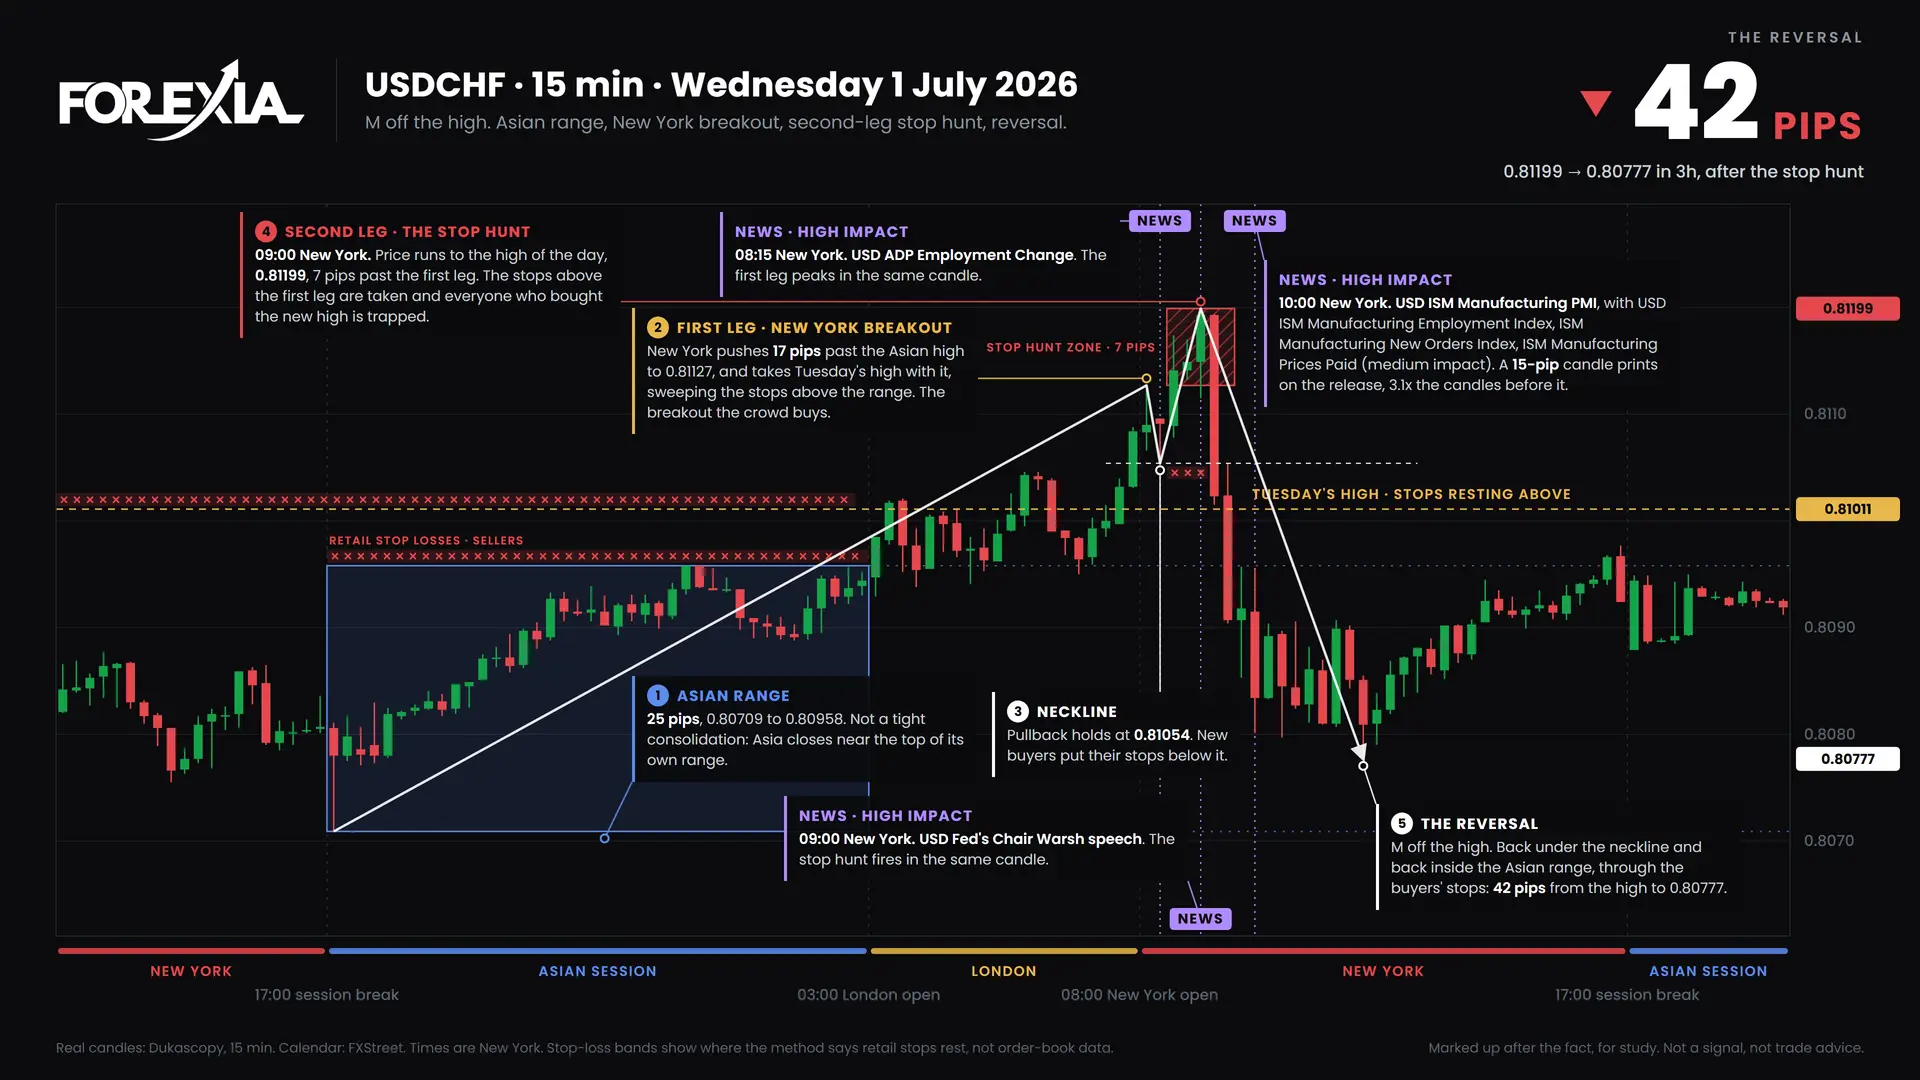
A USDCHF M formation made the high of the week at the New York open and fell 111 pips, as five pairs turned at once. Markups, 29 June 2026.
13 min read
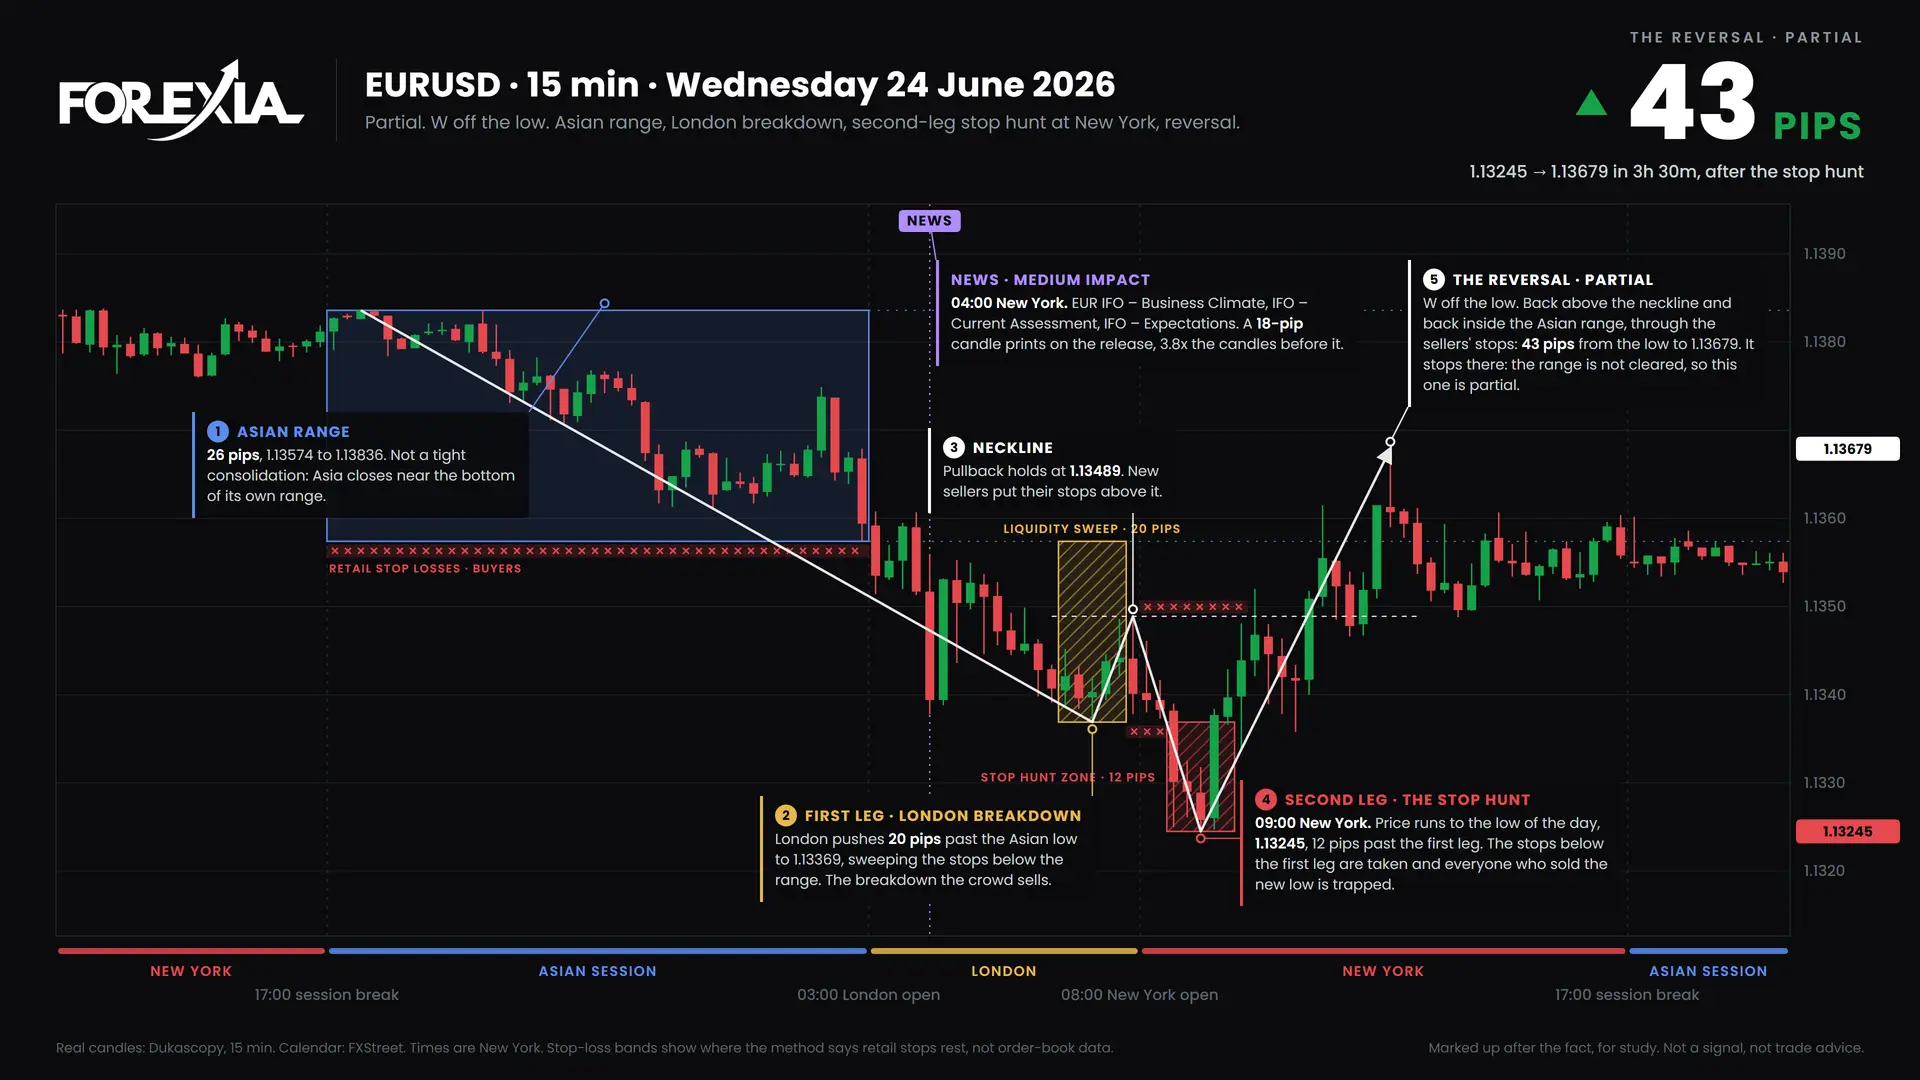
The EURUSD midweek reversal turned on a Wednesday W formation and climbed 109 pips, with two honest flaws. Chart markups, 22 June 2026.
14 min read
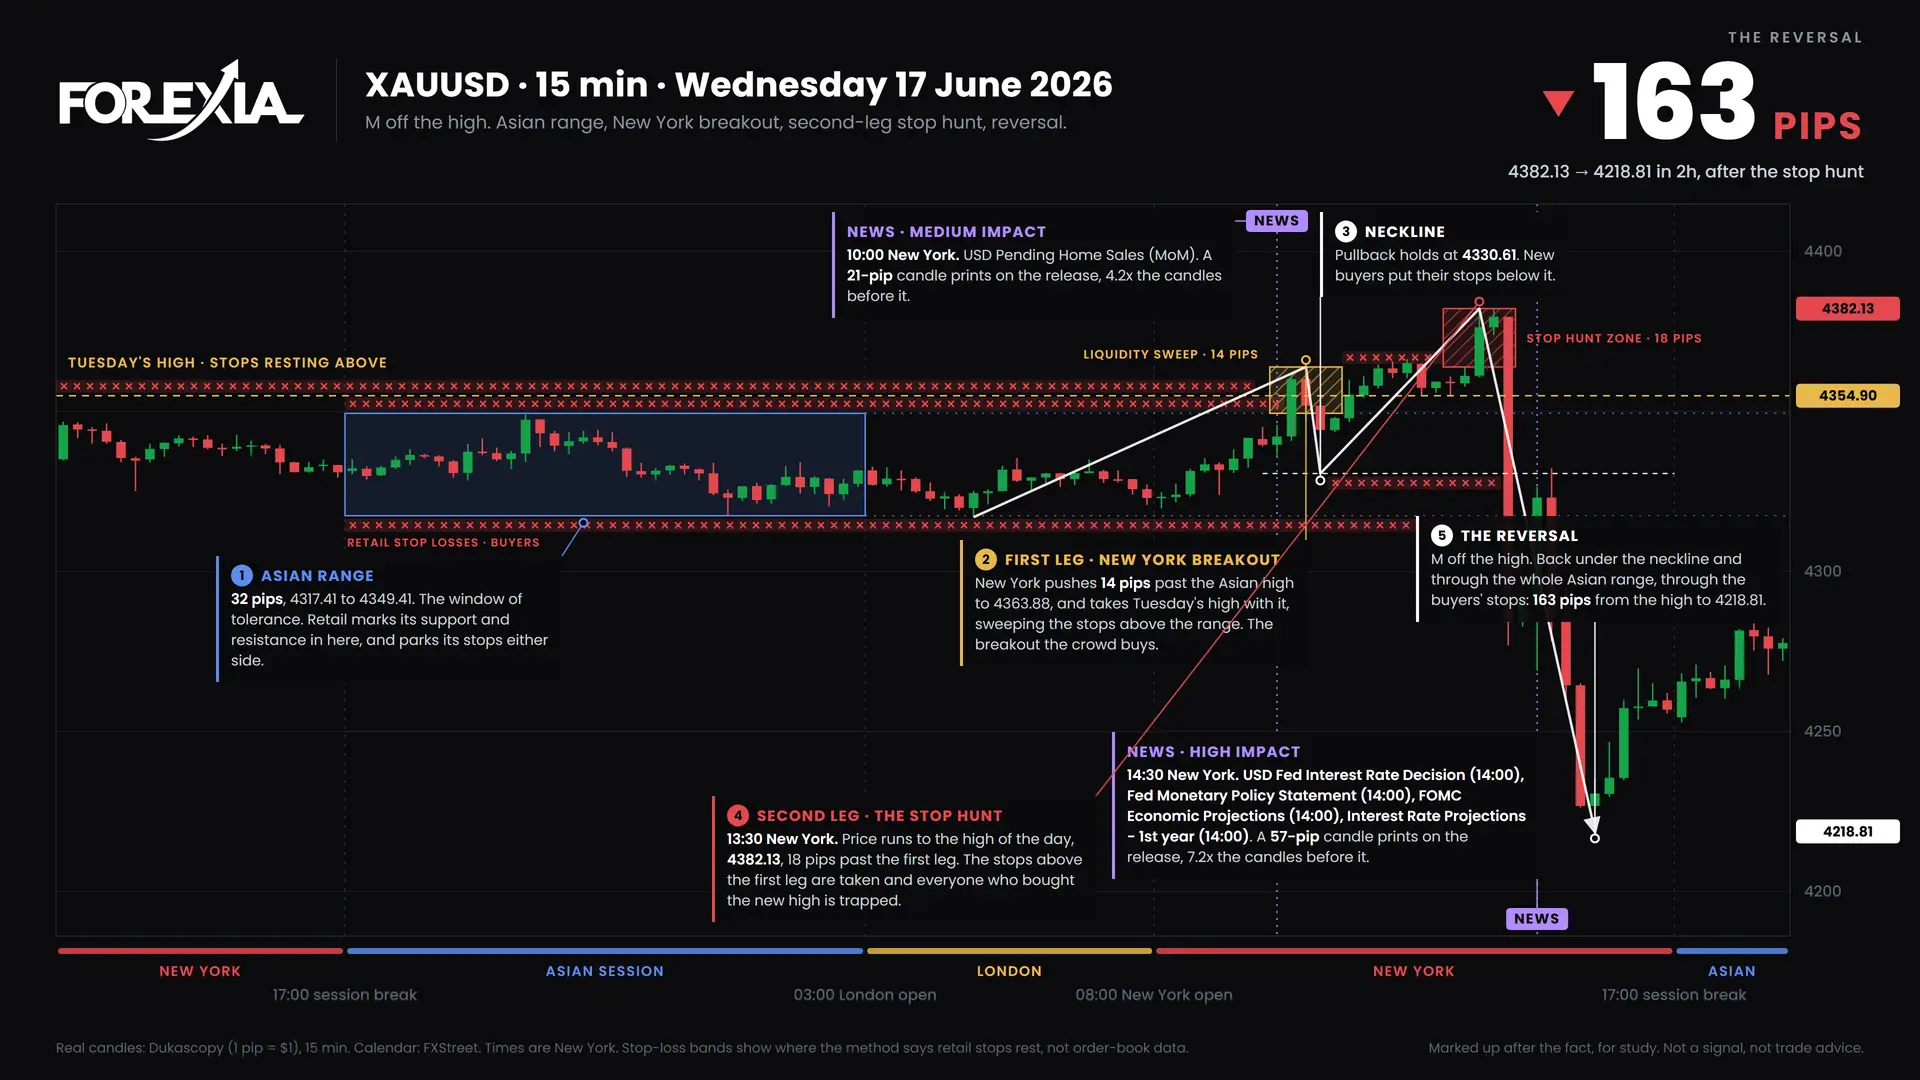
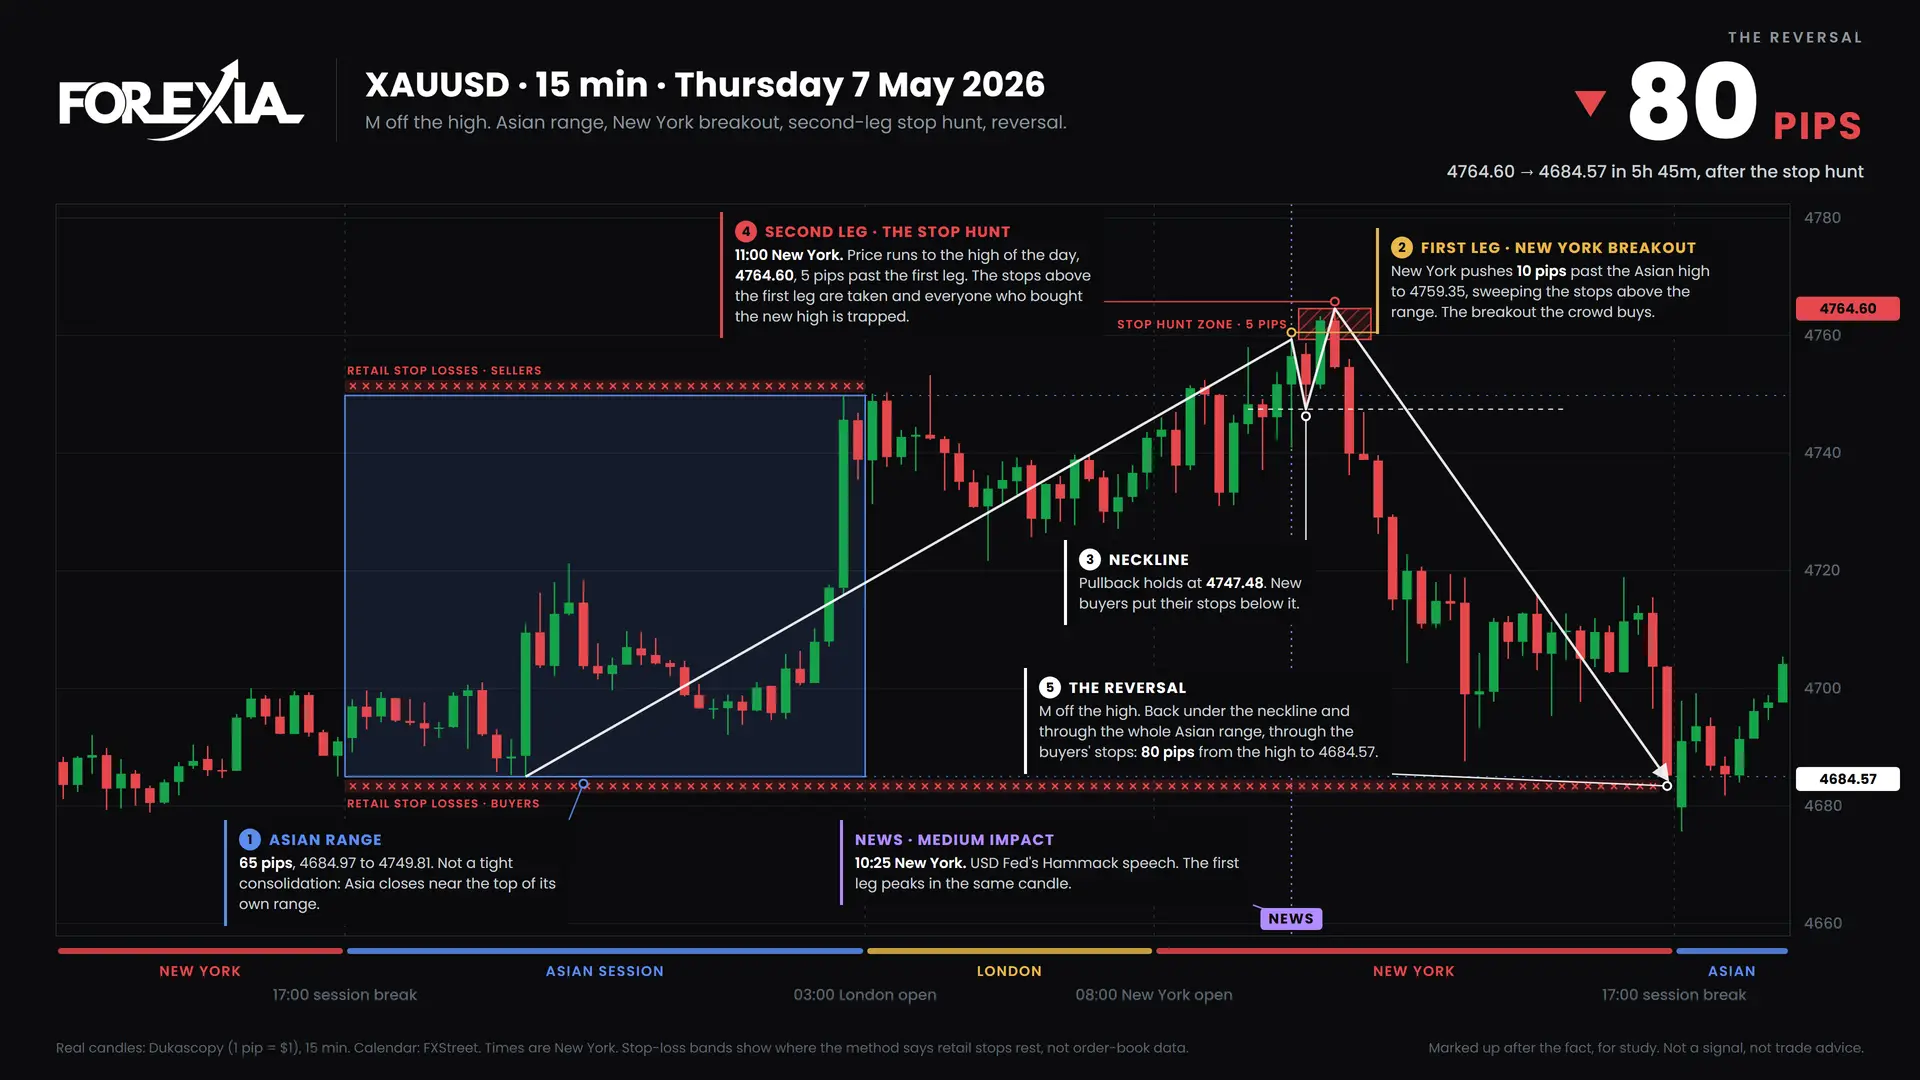
A gold M formation topped half an hour before the Fed decision and fell 163 pips that day. Real chart markups for the week of 15 June 2026.
11 min read
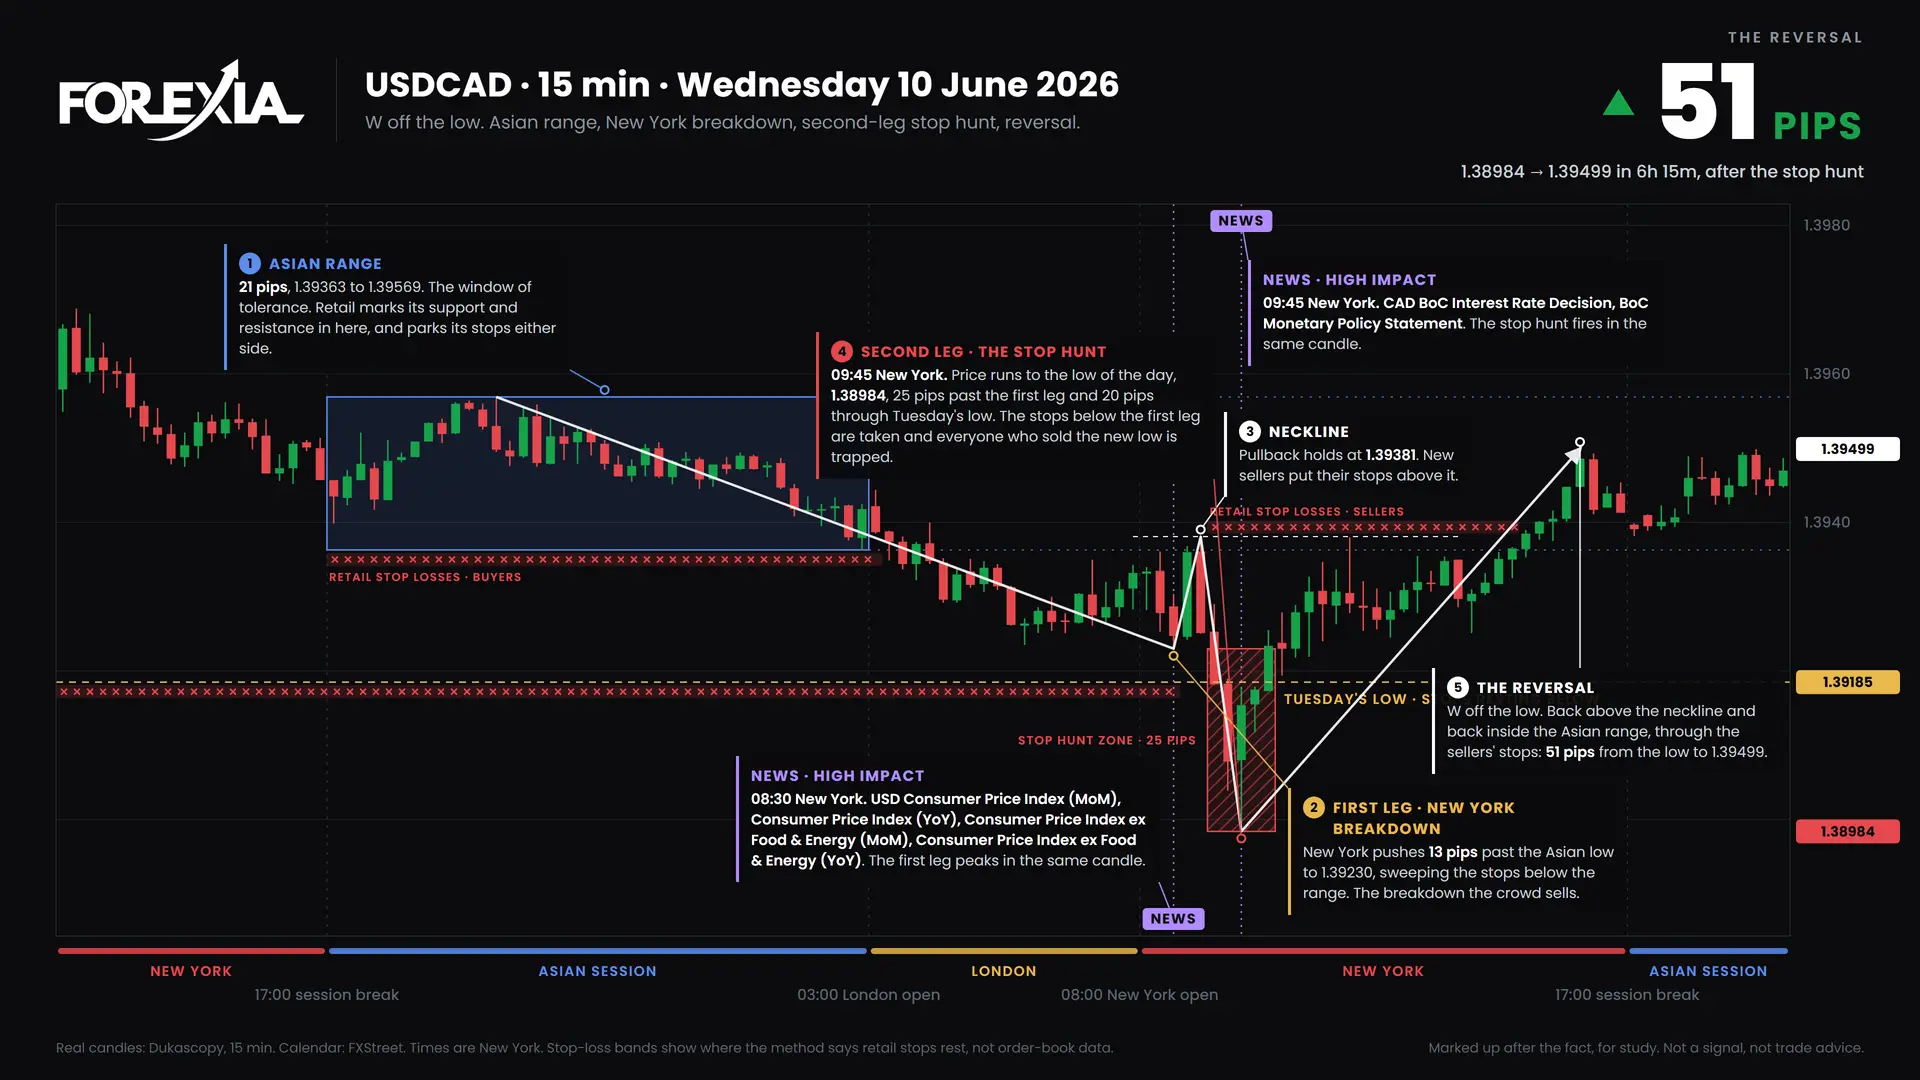
The only 8 of 8: a USDCAD W formation on US CPI and the BoC decision that became the low of the week. Chart markups, 8 June 2026.
19 min read
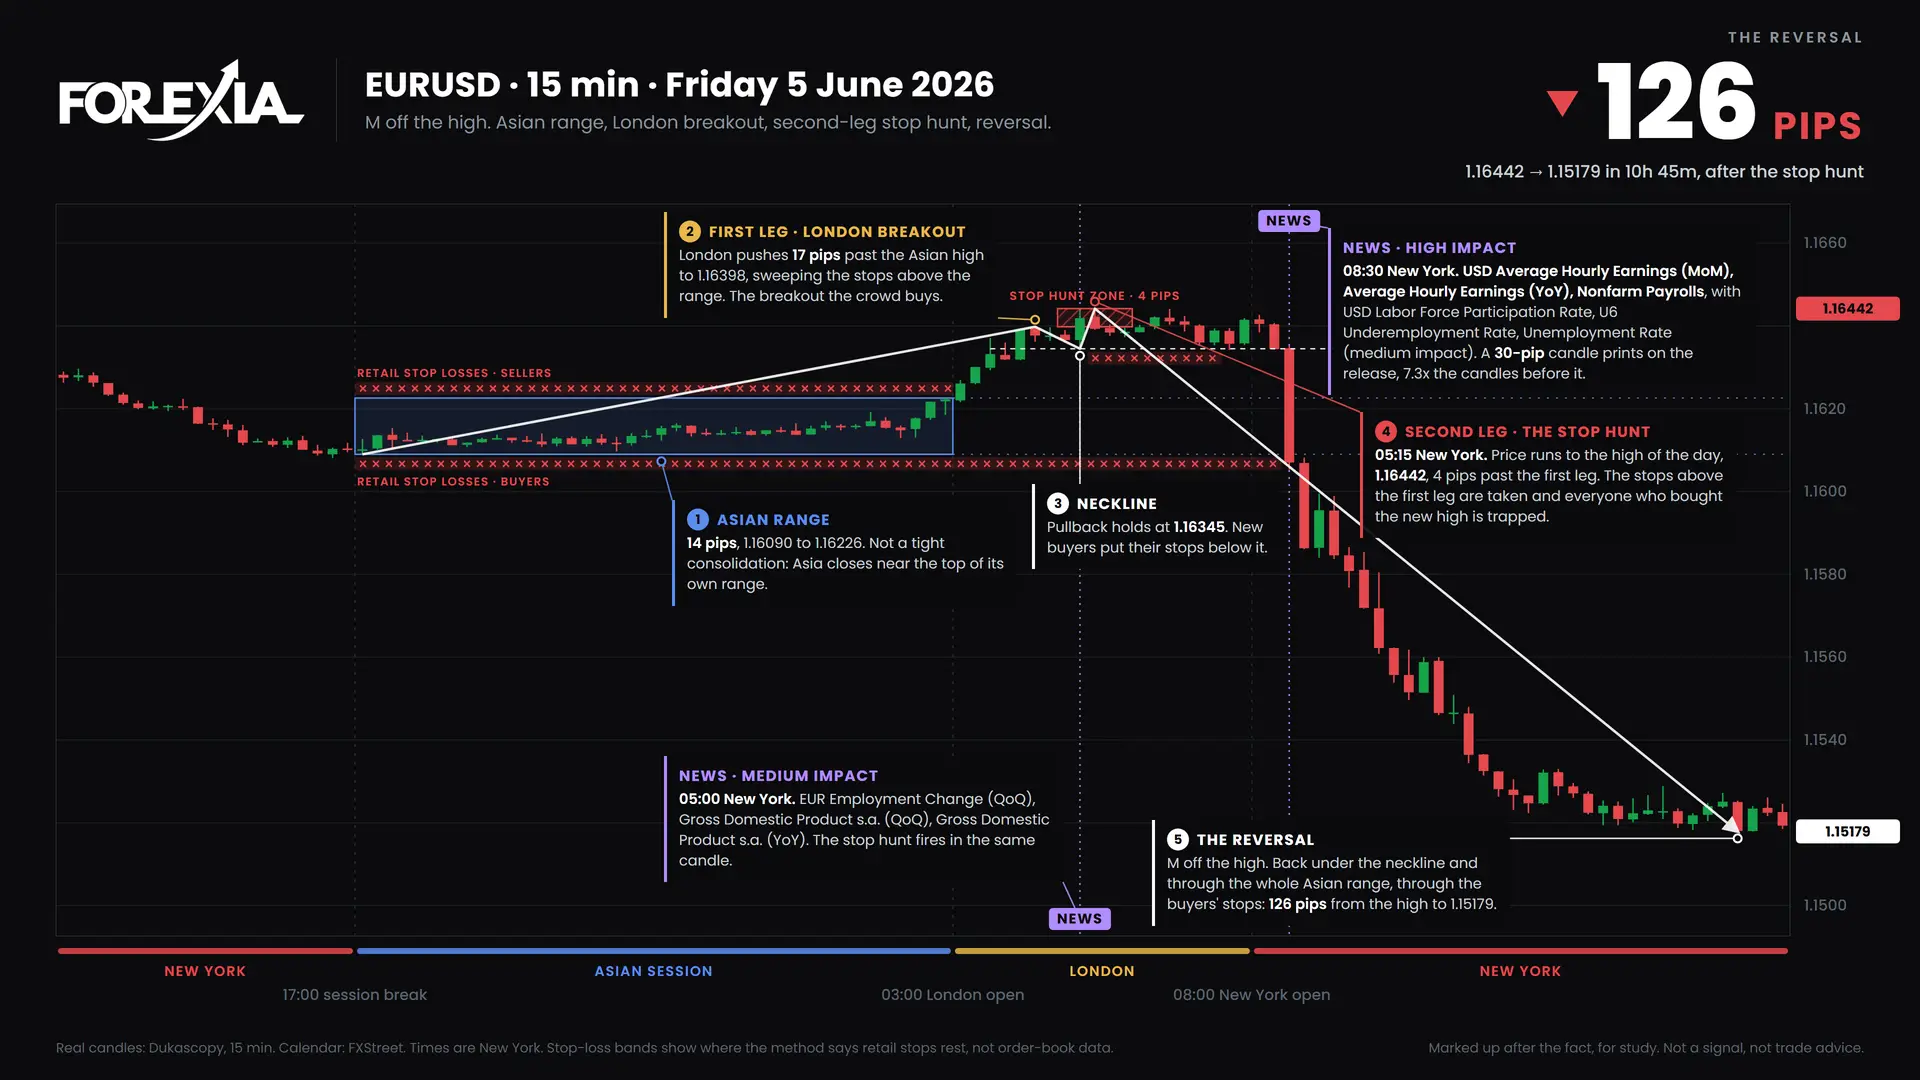
The NFP stop hunt happened hours before the jobs report: London set the trap, the release sprang it. Chart markups, week of 1 June 2026.
13 min read
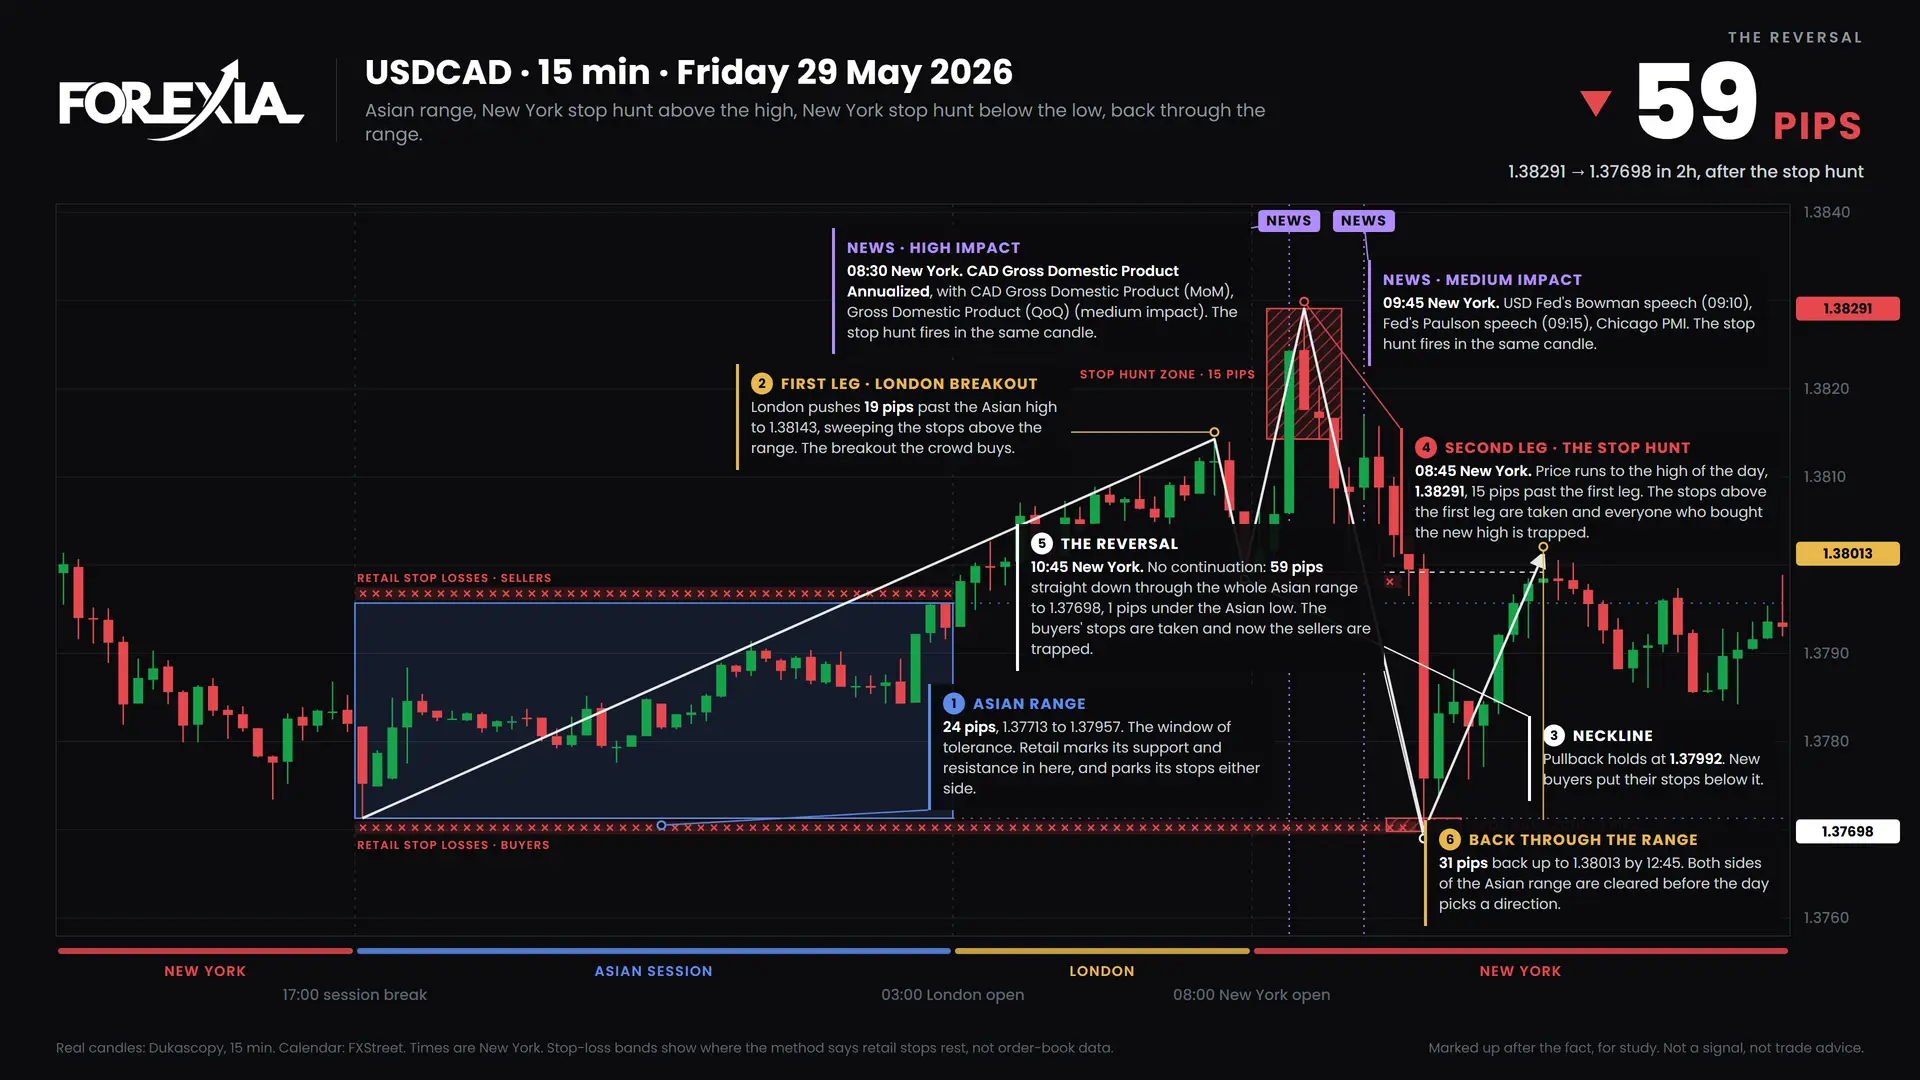
A USDCAD M formation fired on Canadian GDP and fell 59 pips, in a week where the trap came on Thursday. Chart markups, 25 May 2026.
14 min read
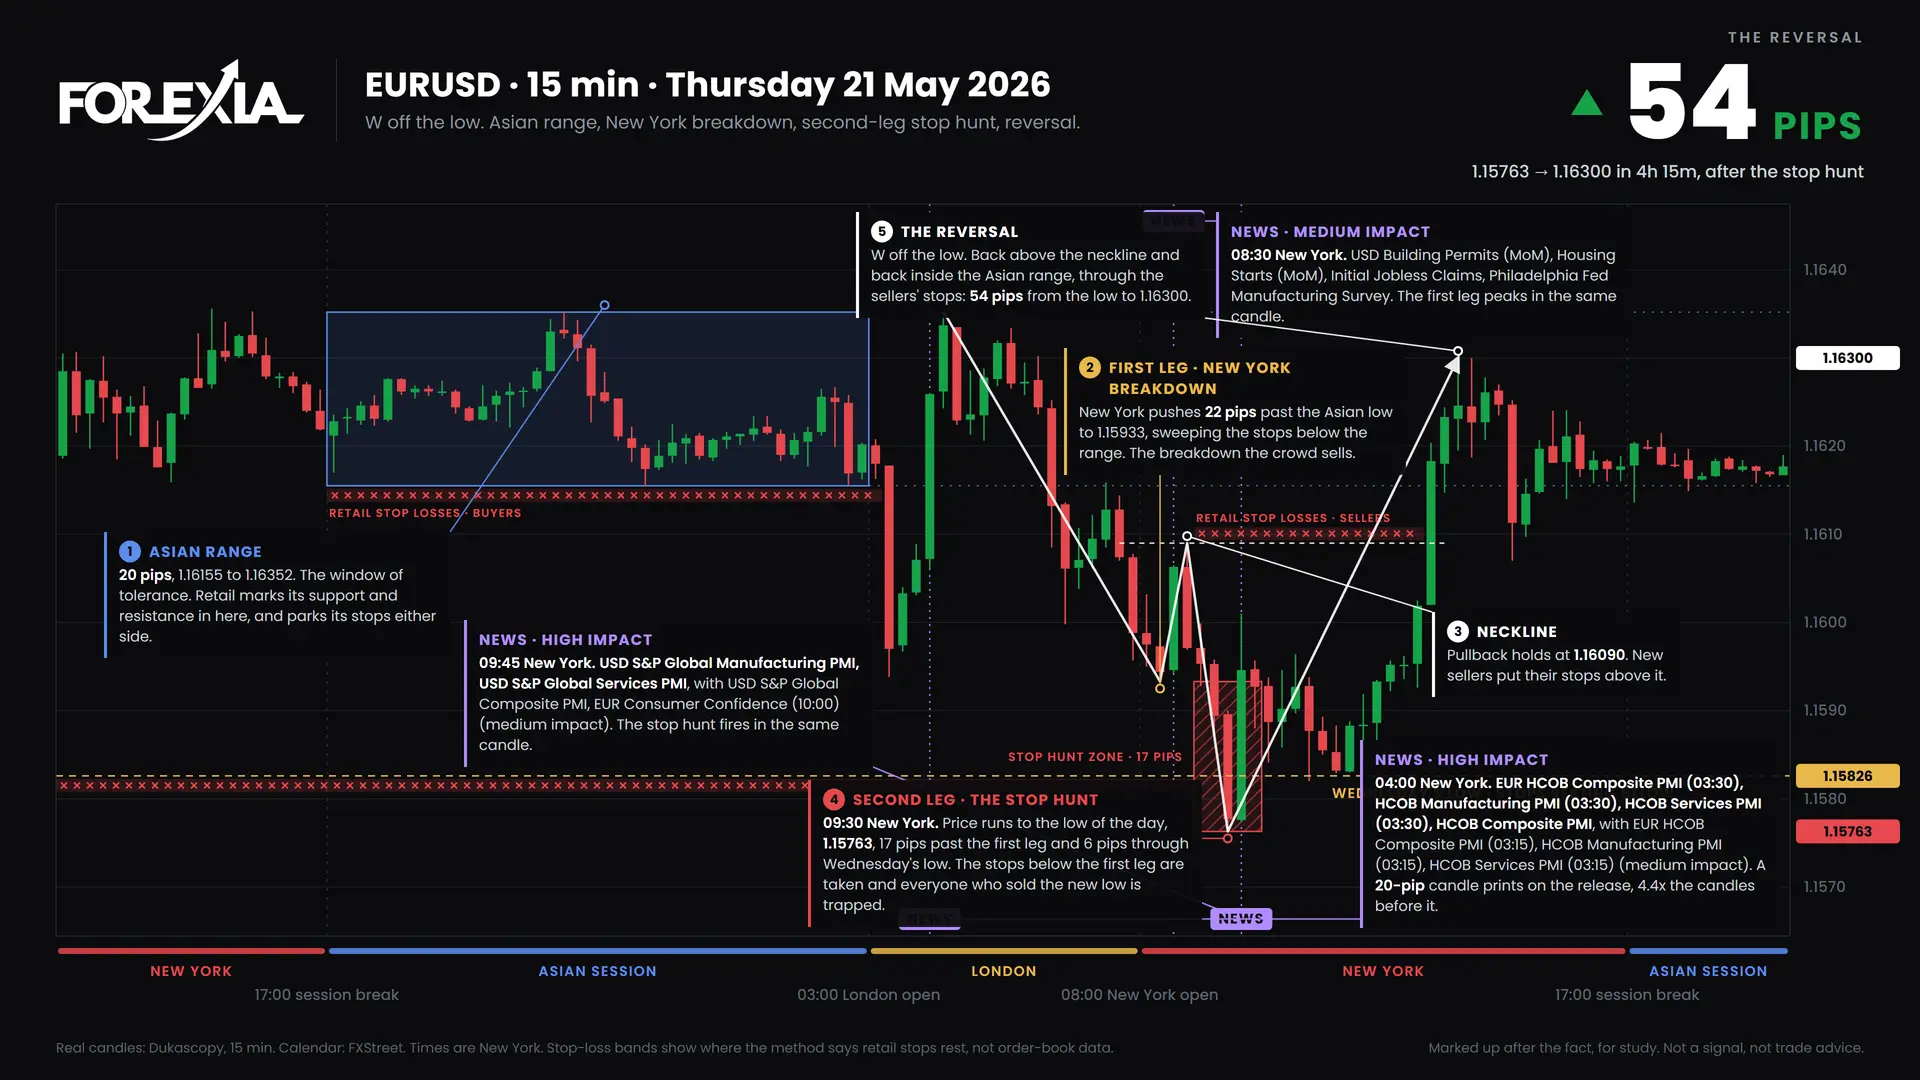
An EURUSD W formation printed the low of the week 15 minutes before US PMI data and scored 7 of 8. Real chart markups for the week of 18 May 2026.
15 min read
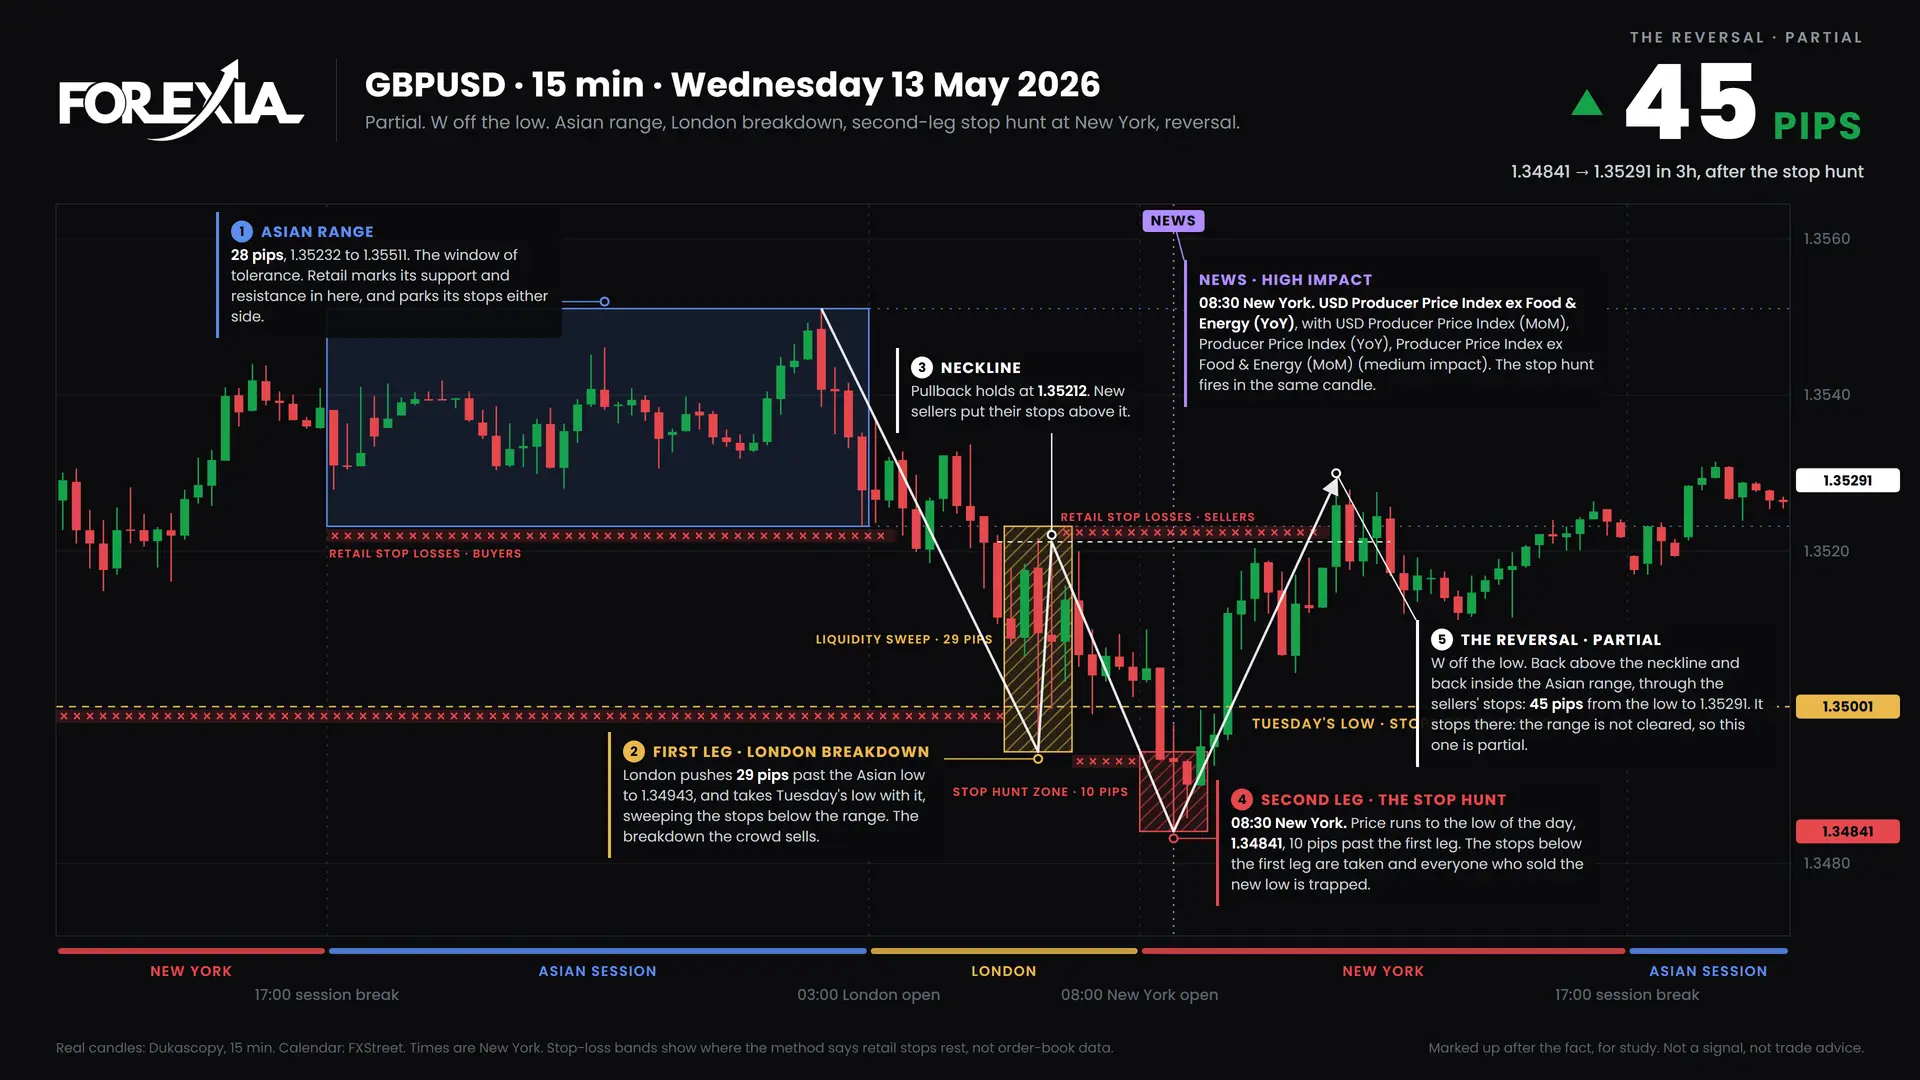
A GBPUSD W formation stacked 7 of 8 confirmations on US PPI and still only paid 45 pips. Real chart markups for the week of 11 May 2026.
10 min read
The forex weekly cycle ran by the book on four pairs: induction on Monday, the trap on Tuesday, then the reversal. Chart markups, 4 May 2026.
10 min read
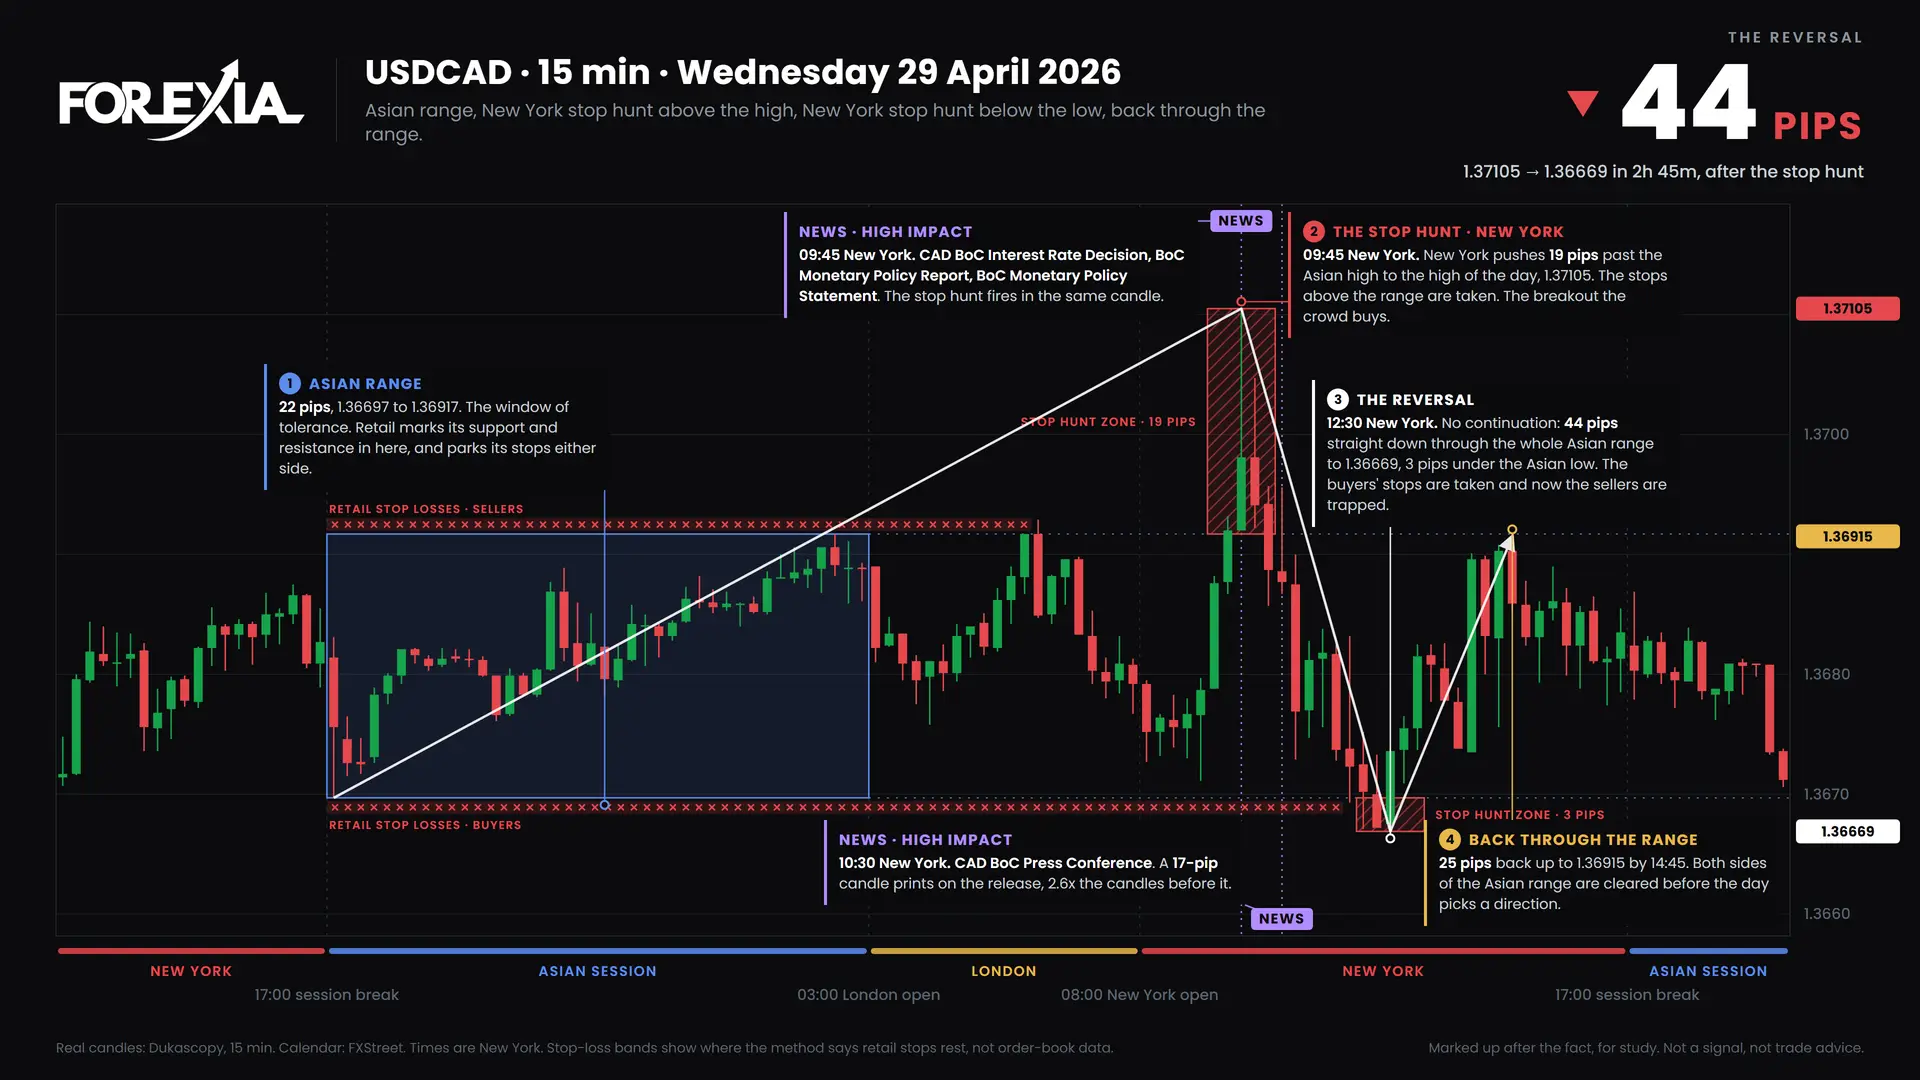
The USDCAD BoC stop hunt set the high of the week on the rate decision, then fell 161 pips. Real chart markups for the week of 27 April 2026.
16 min read
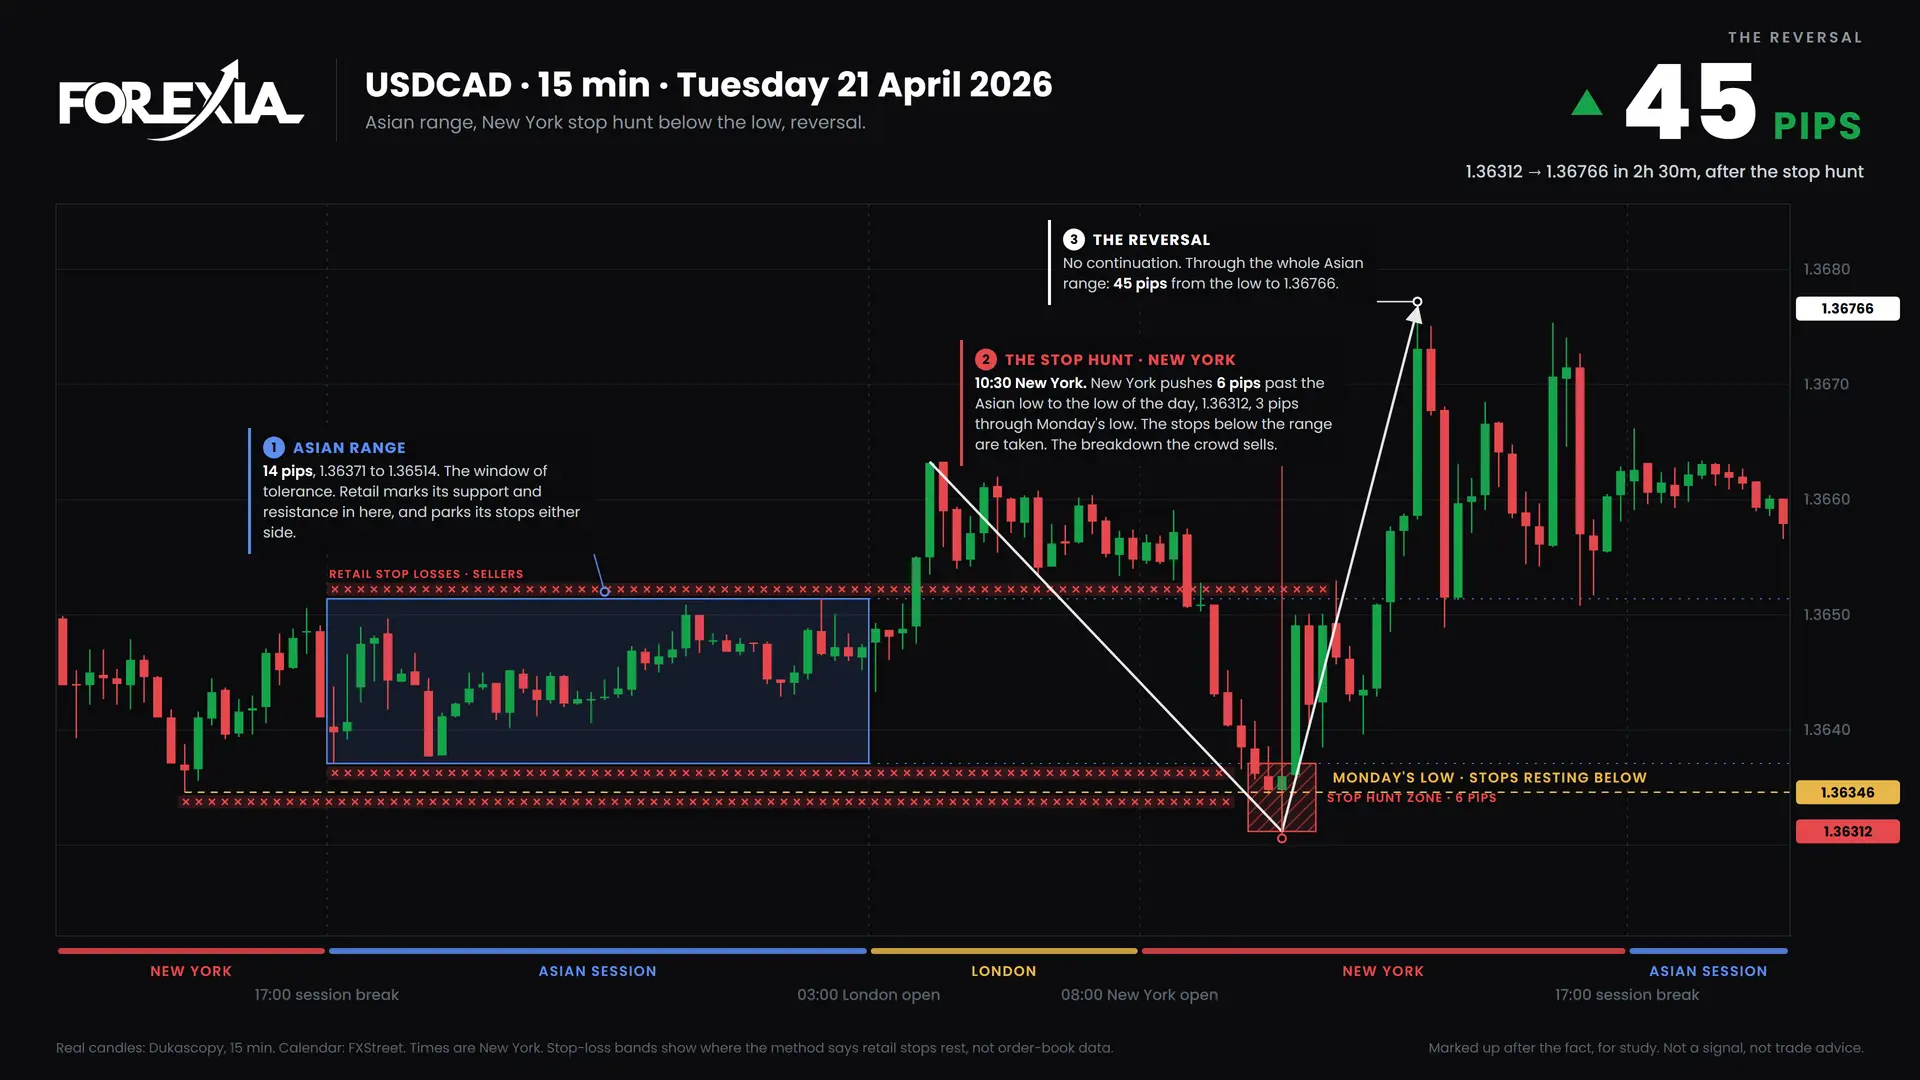
A USDCAD stop hunt under Monday's low set the low of the week, then price reversed 83 pips. Real chart markups for the week of 20 April 2026.
11 min read
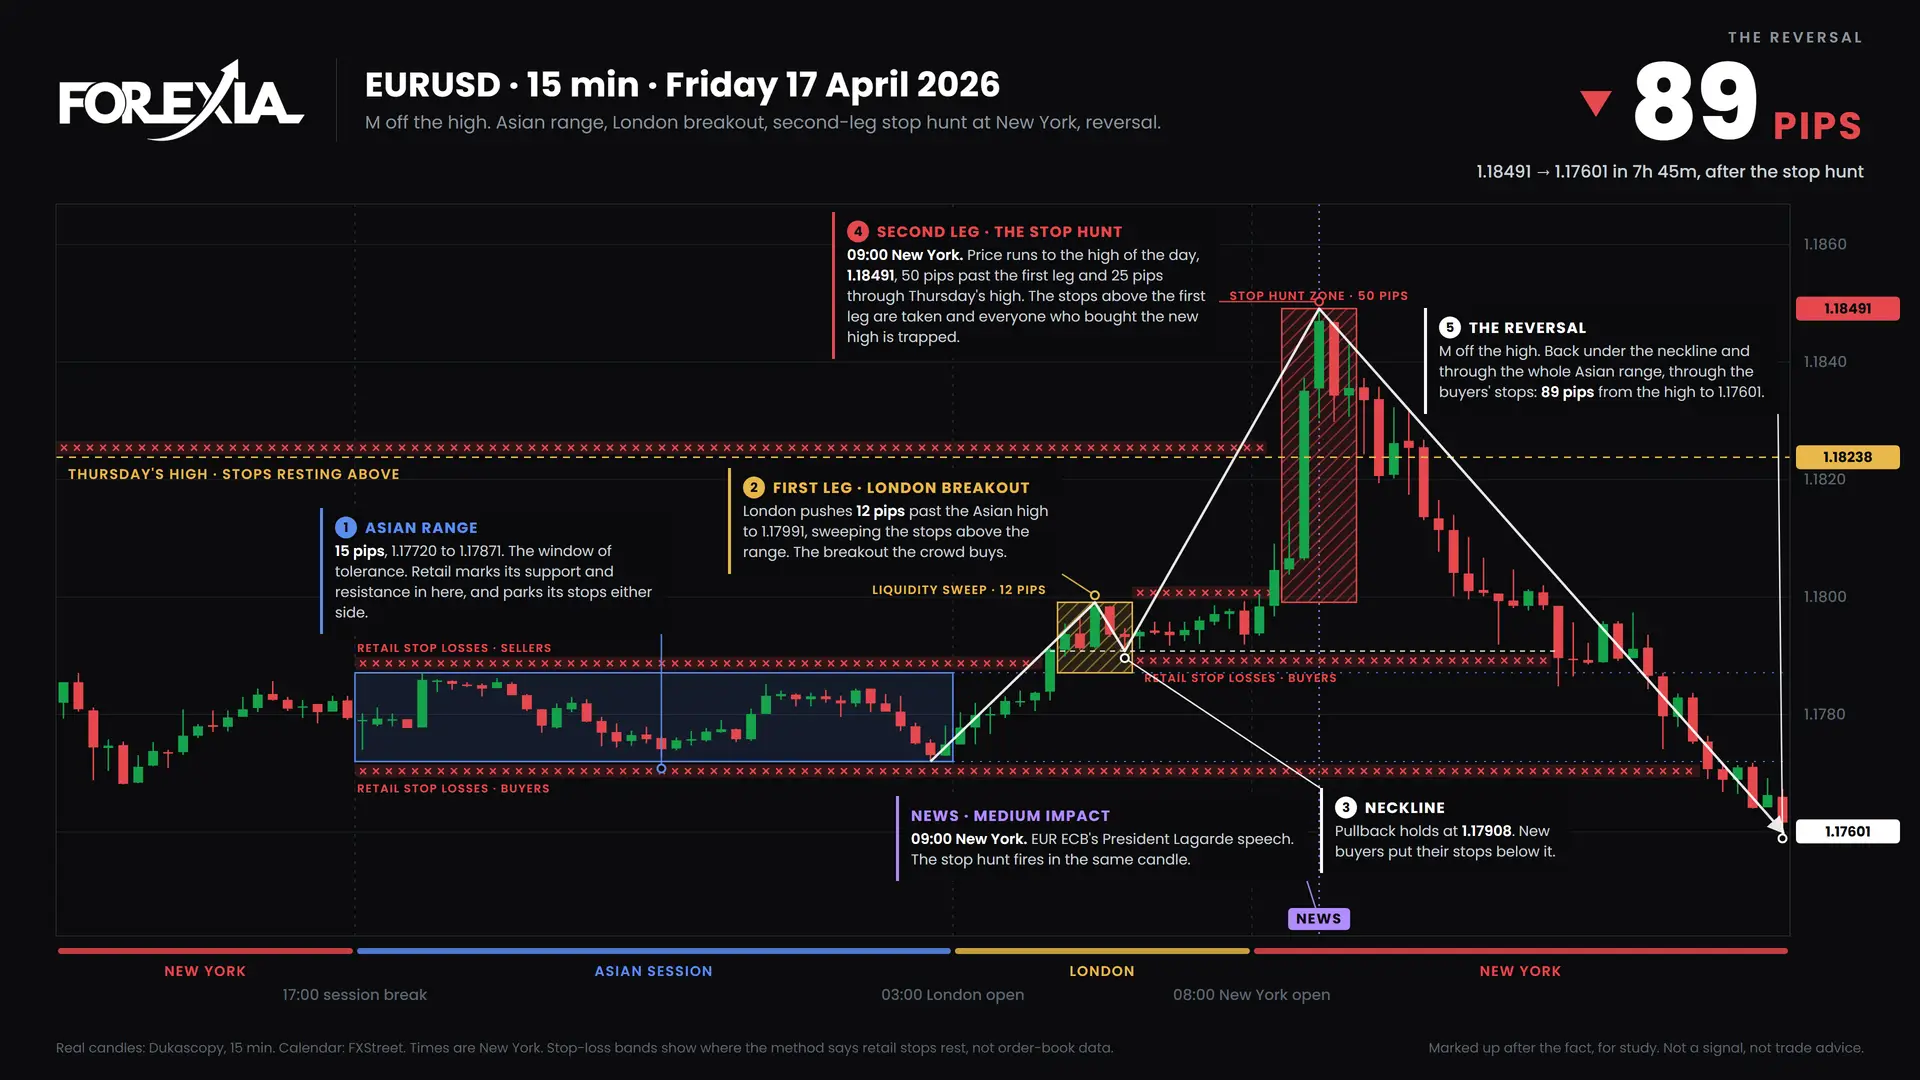
An EURUSD M formation at the New York open marked the high of the week and fell 89 pips. Real chart markups for the week of 13 April 2026.
11 min read
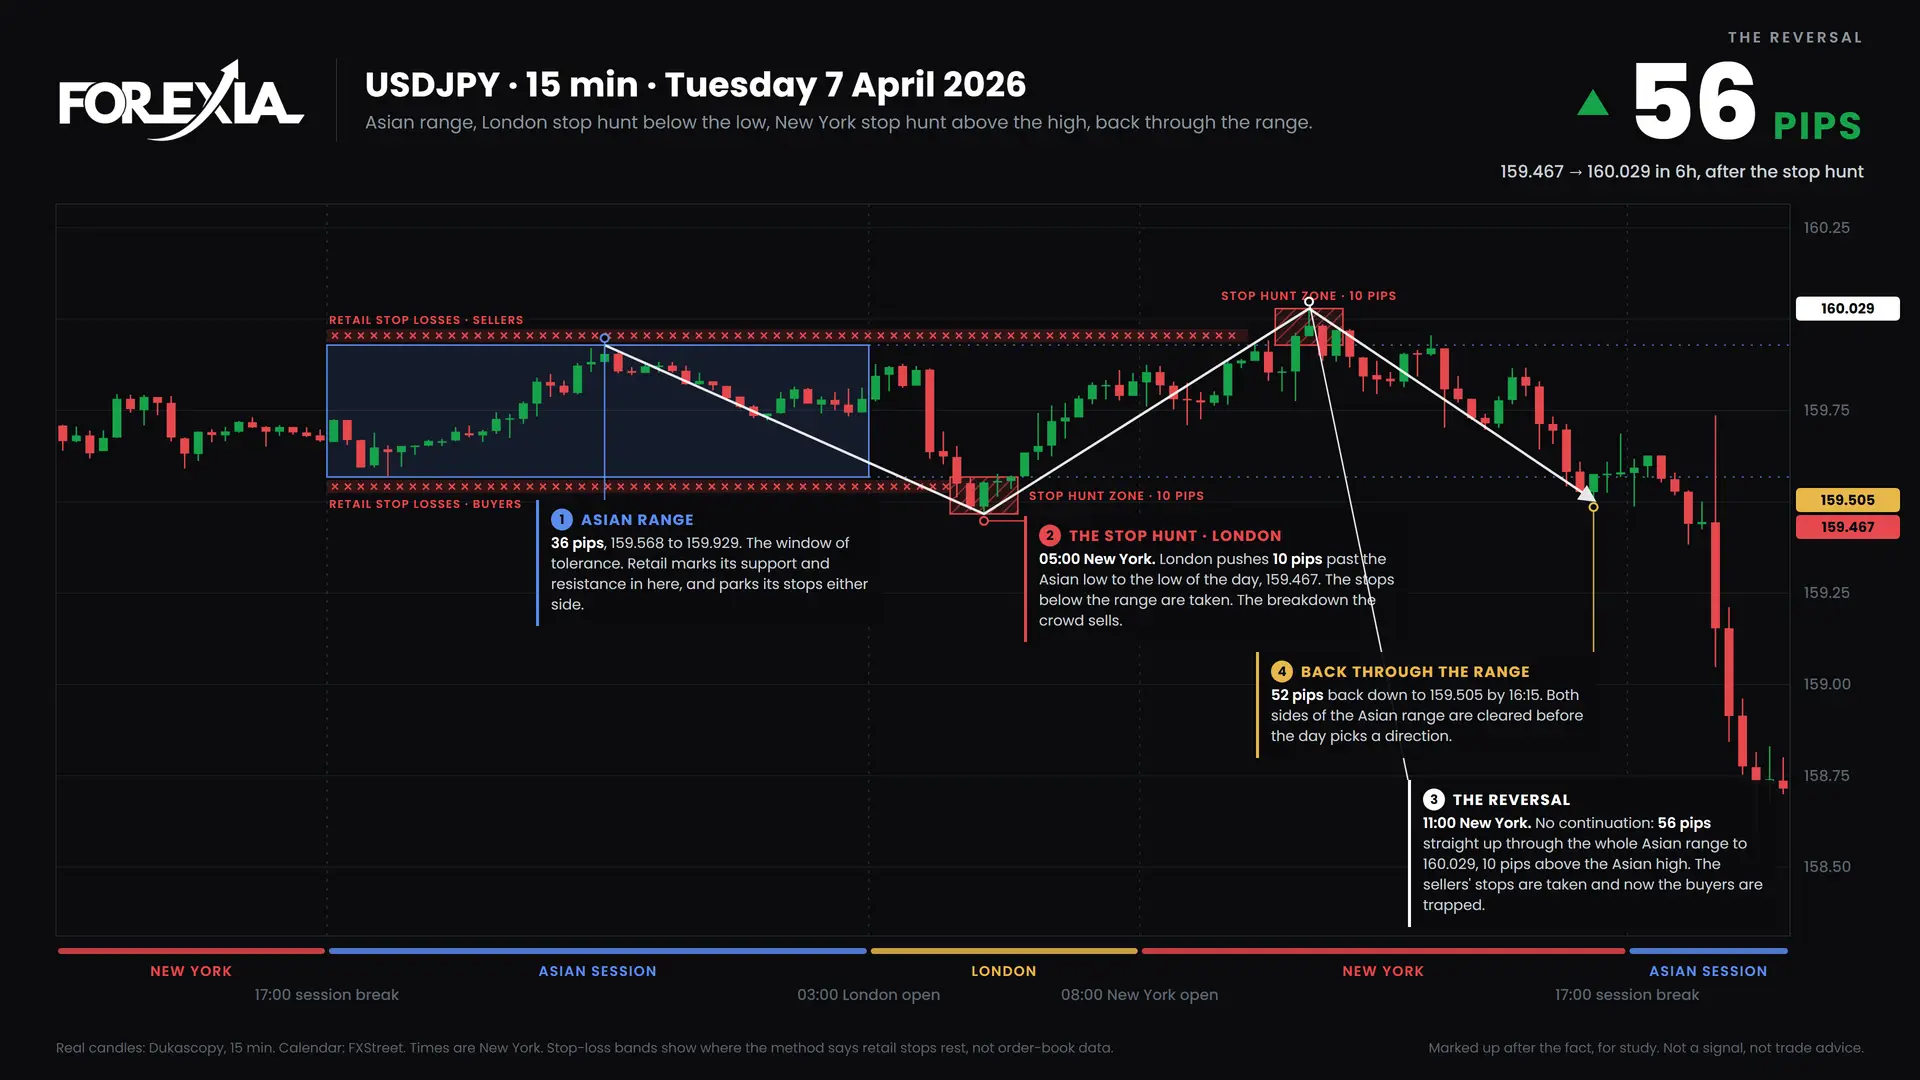
A USDJPY stop hunt took both sides of the Asian range, then price fell 215 pips. Real chart markups for the week of 6 April 2026, explained.
13 min read
Every week we scan the seven majors and gold on real candles and mark up each setup that follows the method: stop hunts, M and W formations and midweek reversals, with the reasoning written out beside the chart.
No. The markups are made after the fact, for study. They are not signals and not trade advice.
No. The blog and the weekly chart markups are free to read without signing in.