Stop Hunt vs Fakeout vs False Breakout: Three Names, One Test
Dylan Forexia8 min read
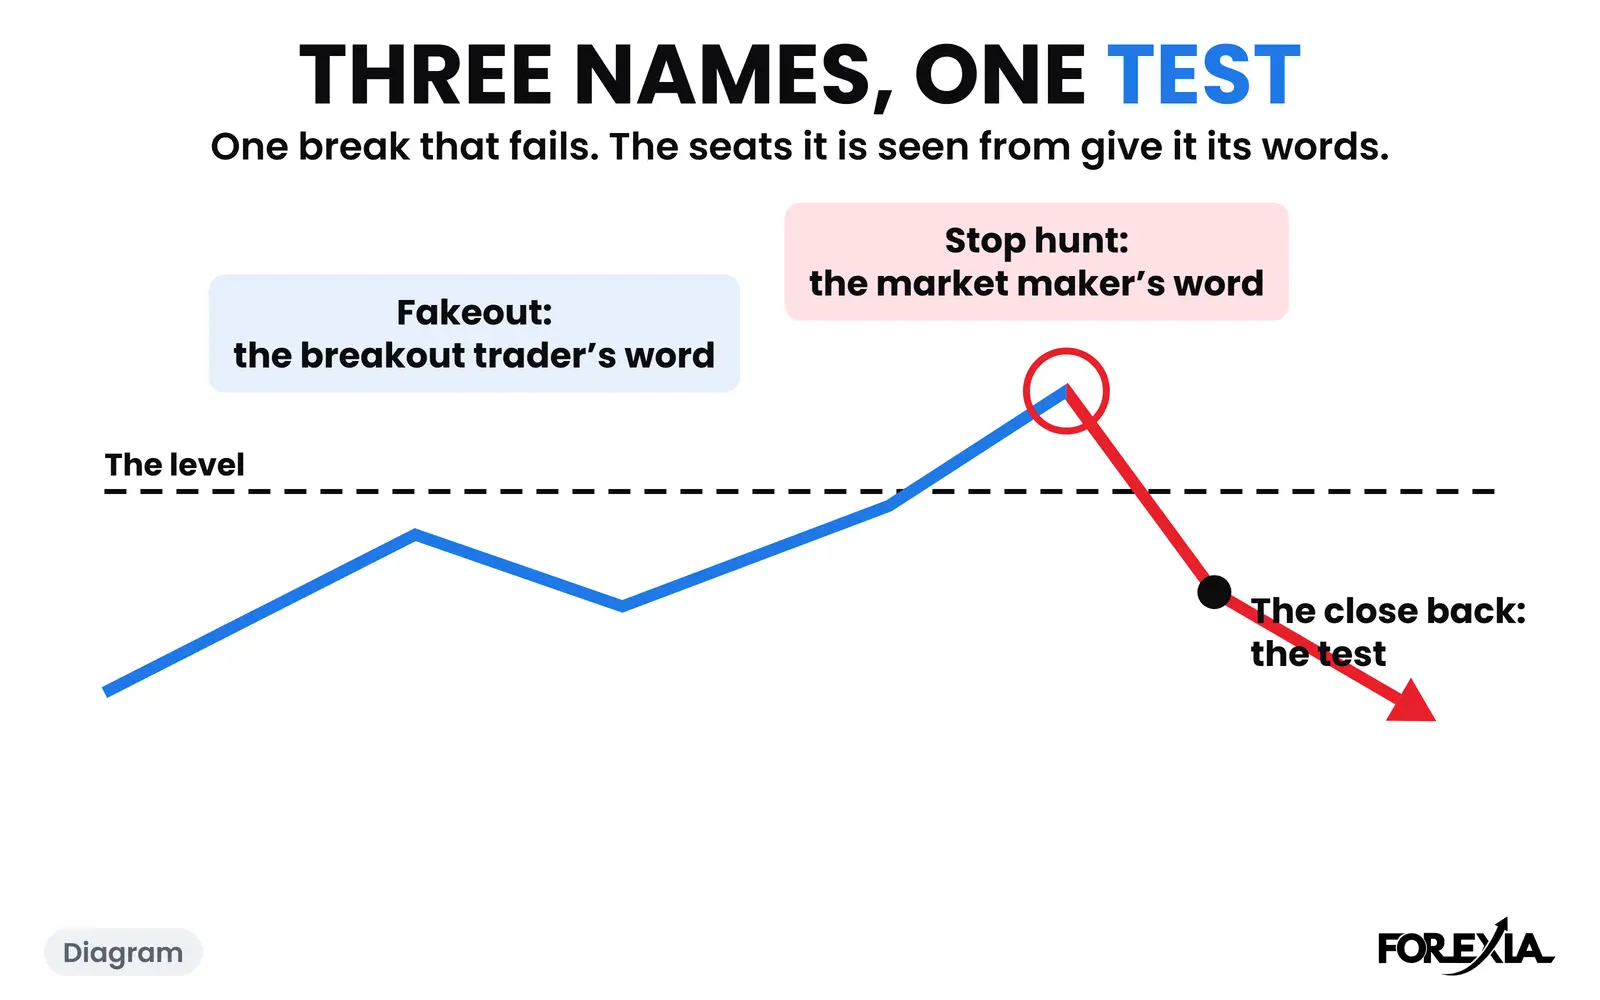
Stop hunt, fakeout and false breakout are three words for one event: a break of a level that does not hold. The same test separates all three from a real break, which is whether a candle closes back inside the level. The words differ in who is speaking and what they claim.
Most pages treat the words as synonyms and move on. In everyday use they are. But the choice of word changes what you think happened to your trade, so it helps to sort them. Here is the sort, then two days in one week on GBP/USD: one where the close back came late, and one where it never came.
Stop hunt vs fakeout: what does each word claim?
Each word describes the same candles from a different seat, and only one of them makes a claim about purpose. We use The Stop Hunt as our own word, and the table says what each of the others means by it.
| Word | Whose seat | What it says | What would prove it |
|---|---|---|---|
| Fakeout, fake breakout | The breakout trader | The break I bought failed | A candle closed back inside the level |
| False breakout, failed break | The chart reader | The level did not break | The same close back |
| Liquidity sweep | The chart reader, from the other side | Price took the orders resting past the level | The same close back, plus a view of the orders, which no chart gives |
| Stop hunt | The market maker's seat | Price went there for those orders | Records of who did what, which only a regulator can demand |
| Bull trap, bear trap | The trader who got caught | Buyers, or sellers, were pulled in just before it turned | The same close back, afterwards |
So the honest answer has two parts. On the chart they are the same thing. In meaning, one of them has a motive in it, and a candle cannot show a motive. Stop hunt vs liquidity sweep takes that line further, with the industry's own wording. The traps have a page of their own in the bull trap and its mirror.
We read a failed break as a stop hunt: the crowd bought the break, and the sellers' stops and the buyers' entries past the level gave a large order something to fill against. That is our read, and we write "we read this as" every time. A breakout can also fail because the buying behind it ran out, with nobody aiming at anything, and the candle looks the same.
How do you tell a fakeout from a real break?
You often cannot until later, and the way to test it is the close. A candle that closes back inside the level is the sign the break failed. A level that keeps closing beyond it was a breakout, whatever anyone called the first spike. The Close Back is the name we give that test.
Volume is the filter most pages suggest. Spot forex has no central exchange, so the volume on a retail chart is a broker's count of price changes, and it is a weak guide. The close is the test we can read from the candles.
Two things make the close back harder than it sounds. It can come late, and it can fail. The two days below show both.
A break that closed back, an hour late: GBP/USD, Monday 17 August 2026
On Monday 17 August 2026, GBP/USD left a 33-pip Asian range from 1.35272 to 1.35601. The 03:30 New York candle ran 11 pips past the top, to 1.35710, and closed at 1.35674, 7 pips over it. Friday's high at 1.35616 sat just above the range, so one push took both.
That candle was not the end. The 04:15 candle closed at 1.35704, 10 pips over the Asian high. The 04:30 candle closed at 1.35604, a third of a pip over. The first close back came at 04:45, 75 minutes after the first candle, at 1.35535, 7 pips under the line. Anyone who called a fakeout at 03:30 was early and sat through an hour of closes above it. Our calendar shows no sterling or dollar release in that window.
Even then price kept testing the level. The 06:15 candle closed at 1.35633 and the 10:00 candle at 1.35648, both back over it. The 36-pip fall to 1.35354 only came in the afternoon, by 14:45.
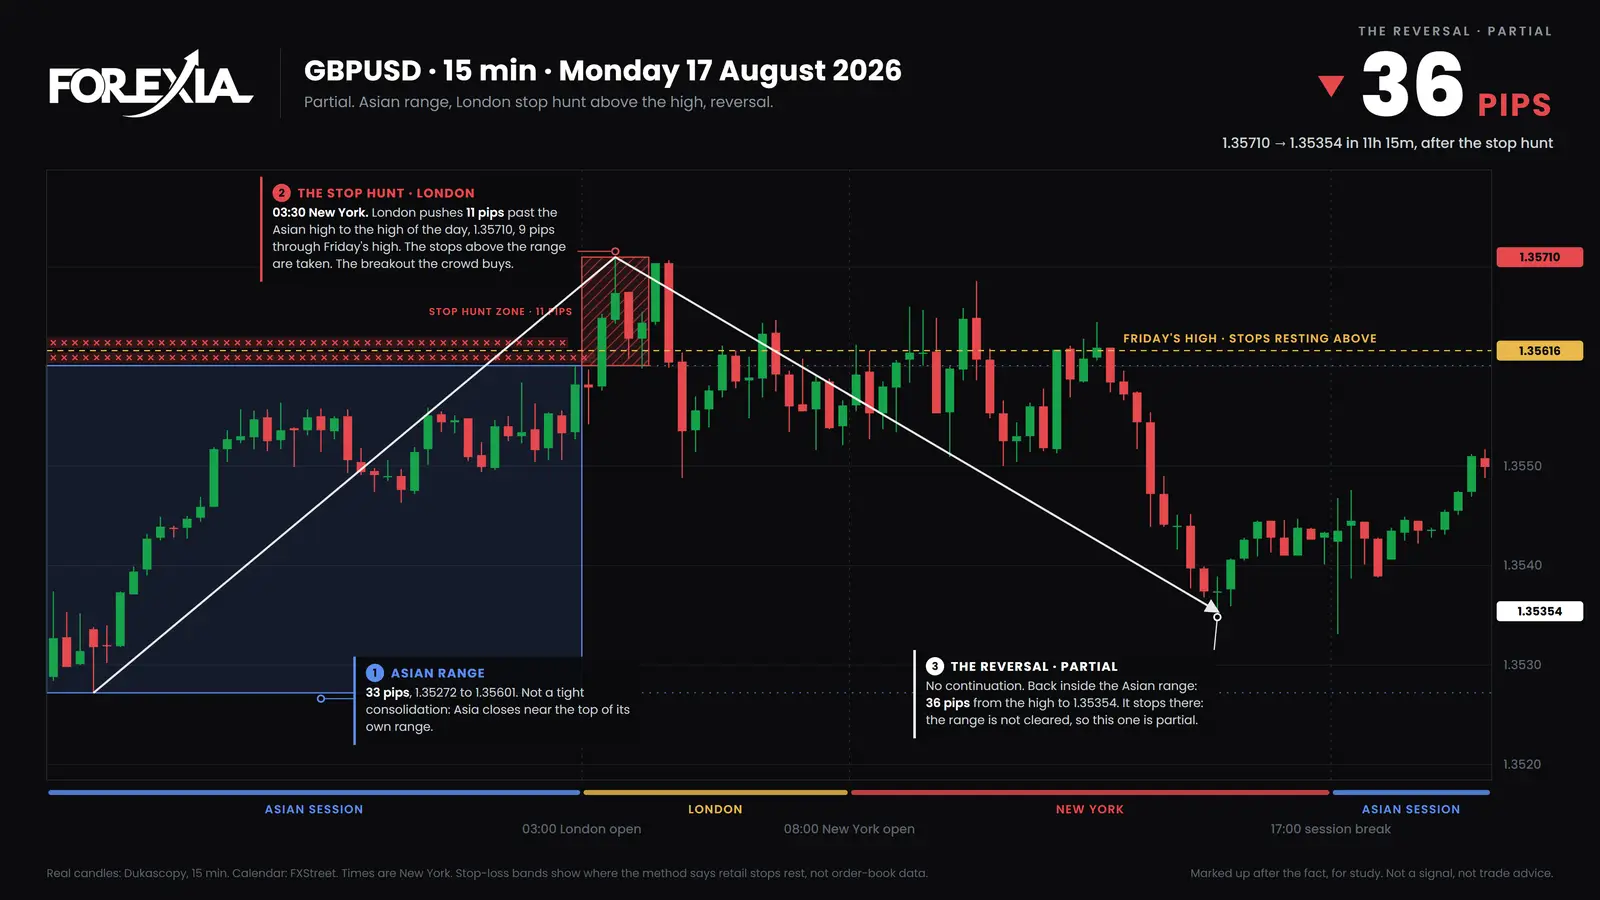
That is a stop hunt by our read, and a fakeout from the breakout buyer's seat. It is also a day where the label arrived an hour after the move, and where the reversal was partial. We picked it because it reversed.
A break that stayed: GBP/USD, Thursday 20 August 2026
Three days later the same pair did the opposite. On Thursday 20 August 2026 the Asian range ran from 1.35937 to a high of 1.36166. The 03:30 candle ran to 1.36308, 14 pips over the high, and closed at 1.36272, 11 pips over it. Anyone expecting a hunt of that high had a good-looking spike to sell.
No candle closed back. Not one 15-minute candle closed at or under 1.36166 for the rest of the day, through the 16:45 candle's close at 1.36300. Price went on to 1.36593 at 06:00, 43 pips over the line. Our calendar has no sterling or dollar release before 08:30 that day, and the only releases at 08:30 were medium impact.
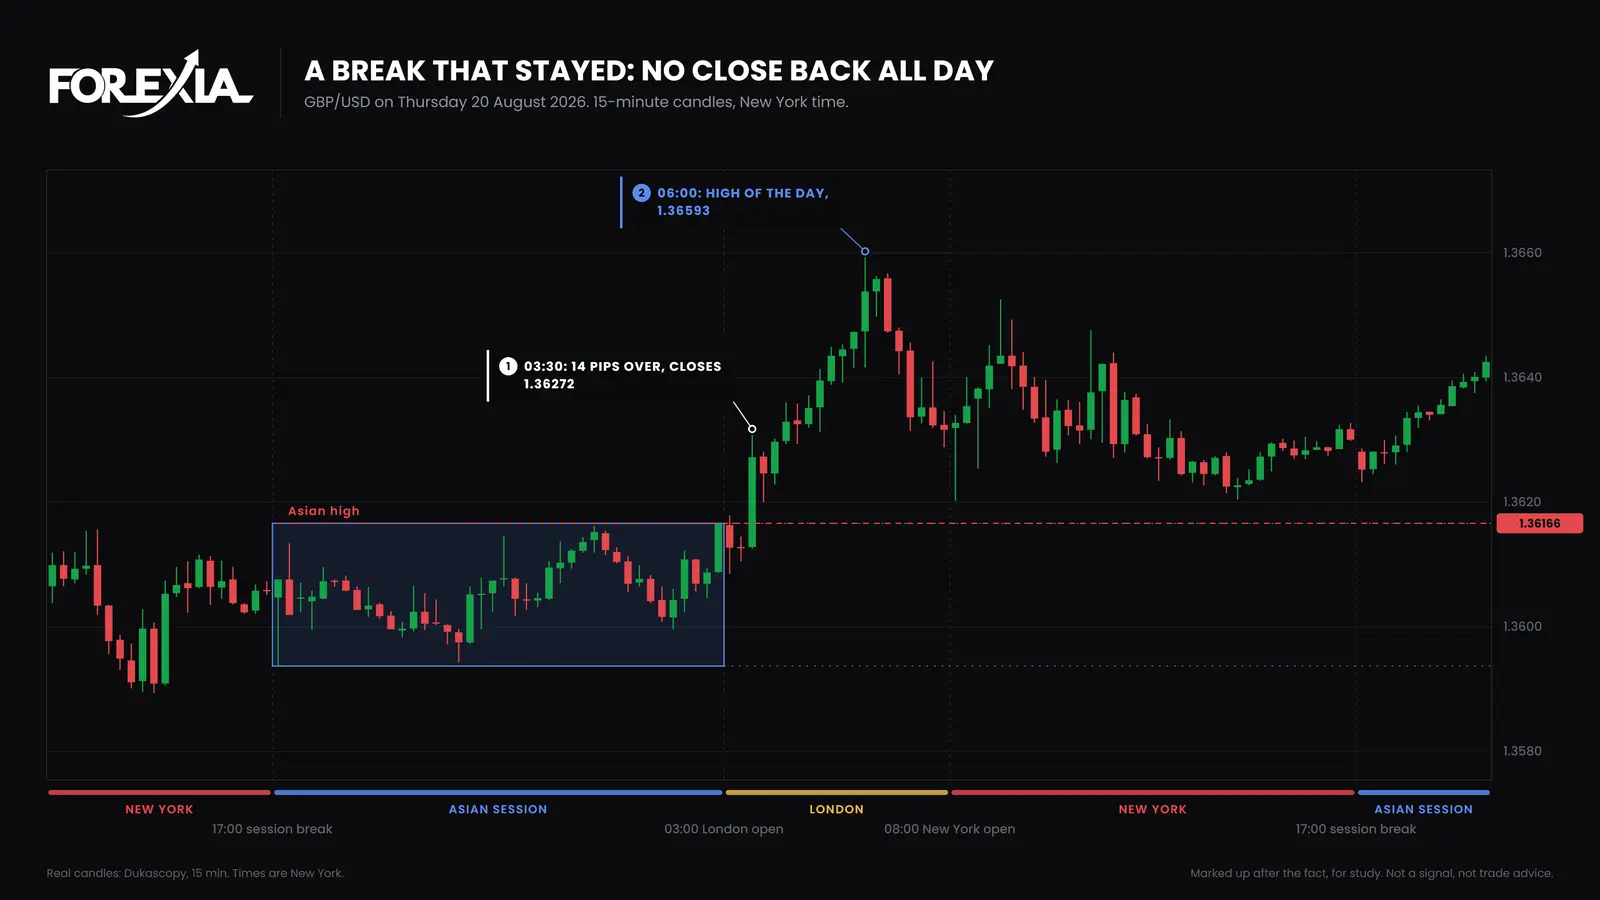
The two days had the same pair, the same level and the same kind of morning. Size did not separate them: the first spike ran 11 pips past the level and the second 14. What separated them is the close, and the second day could only be called a break afterwards too. The buyers of the break were right on the 20th and wrong on the 17th.
How often does a break close back, and how late?
Most breaks of these levels close back the same day, and the close back often comes within the hour. We counted every time an edge of the Asian range, or the previous day's high or low, was traded through after the London open by at least 3% of the average daily range, on seven dollar majors and gold, from 6 April to 1 October 2026. A level Asia had already passed is left out.
| First close back | Levels |
|---|---|
| On the same candle | 397 |
| Within the next hour | 595 |
| Later that day | 318 |
| None by 17:00 New York | 291 |
| Total taken | 1,601 |
So 1,310 of the 1,601 levels taken closed back, and 291 never did. After 825 of the 1,310 close backs, a later candle traded past the wick again the same day. A close back is a read and not a promise. On 17 August price did not pass the wick, but it did close back over the Asian high more than once before the afternoon fall.
These count candles and not trades. A close back does not make the trade the other way pay, and our own test of that setup as a mechanical rule did not make money. The script is scripts/seo-counts.mjs, and it ends on 1 October.
What does each seat see?
The three seats read the 17 August morning differently.
- Retail saw a breakout. Sterling pushed through the Asian high and Friday's high together, and the textbook says buy it, with a stop just back inside.
- The market maker, as we read it, saw orders. Sellers' stops over the range and breakout buyers entering are all buys past one level. We cannot see them, and this is a reading of the structure.
- The observer saw only the order of events. A level, a push through it, and no close back for 75 minutes.
What should you take from it?
Three habits follow from the two days.
- Name the break after the close, not the spike. On the 17th the first spike looked like a break for an hour, and on the 20th it was one.
- Use the word that fits the claim you can make. "The break closed back" is a fact. "The stop hunt" is our read. "Rigged" is not something a chart can say, and is forex rigged separates what can be shown.
- Know where your own stop sat. If it sat just past an obvious level, it sat with everyone else's. How to avoid stop hunts covers placement, and stop too tight or stop hunt runs the check on your last loss.
The page on false breakout forex asks a different question, who the pattern was built for, and shows three days of it. For the wider picture of stop hunting in forex, start at the hub.
What this does not tell you
Two days are examples and not a sample. We chose them because the same pair did both in one week, and the counts above are the larger picture. We have no count of how many breaks fail for want of buyers and how many for any other cause, and no chart could produce one.
Neither word makes the next trade pay. Traded against each flagged hunt on seven dollar majors and gold, our own fixed rule lost money after costs in every year from 2021 to 2026, between -0.10R and -0.23R a trade. That is one rule on one data source, and it says nothing either way about who moved a candle.
Course 3 of ForexiaPRO, Reverse Price Action, teaches this read step by step from lesson 3.1.
Frequently asked questions
What is the difference between a stop hunt and a fakeout?
Nothing on the chart. Both describe a break of a level that does not hold. Fakeout names it from the breakout trader's seat, because the break they bought failed. Stop hunt names it from the market maker's seat and adds a purpose: price went there for the stops. The chart can show the first and cannot show the second.
Is a fakeout the same as a false breakout?
Yes. Fakeout, fake breakout, false breakout and failed break are different names for a move through a level that closes back on the side it came from. Some writers use fakeout for a short-lived one and false breakout for one that lasts hours, but no standard separates them.
How do you tell a stop hunt from a real breakout?
Not while the candle is open. The test we use is whether a candle closes back inside the level, and even that can come late or fail. In our count of 1,601 levels taken, 1,310 closed back by 17:00 New York the same day and 291 did not, so a break that stays is common too.
Can a fakeout happen with no stop hunt?
Yes. A breakout can fail simply because the buying behind it ran out, with nobody aiming at any stop. The candle looks the same. That is why we say we read a failed break as a stop hunt, and why no chart can prove it.
Should you trade a fakeout the other way?
A reversal seen afterwards is not a setup. Our own test, which traded against each flagged hunt on seven dollar majors and gold, lost money after costs in every year from 2021 to 2026, between -0.10R and -0.23R a trade, where R is the amount risked on one trade. That test cannot say what a trader reading the chart would do.