False Breakout in Forex: Who Built the Pattern You Just Traded, and Why Right There?
Dylan Forexia7 min read
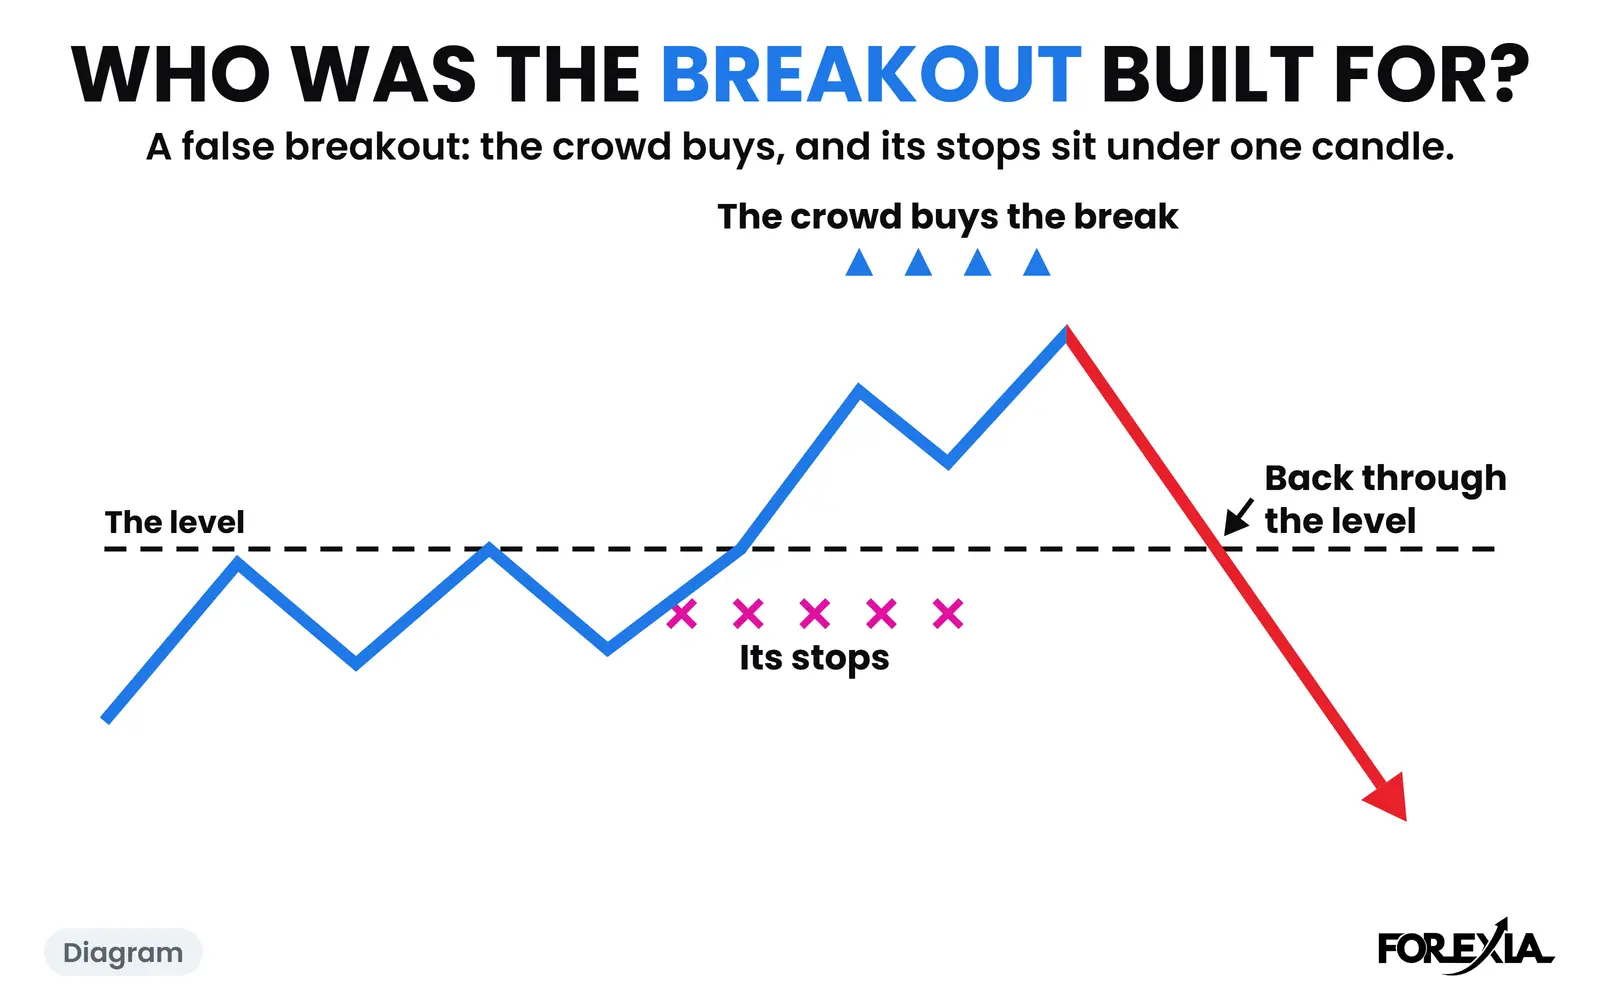
A false breakout in forex is a move through a level that cannot stay there: price trades past it and closes back on the side it came from. We read it from behind. A clean pattern tells a crowd where to buy and where to put its stops, and those stops are orders price can go and use.
The usual page on this search asks whether a break is real. Reverse Price Action asks an earlier question: who was this pattern built for? Here is that question on three patterns and three real days: a trendline, a triangle and one plain level. Times are New York, candles are 15-minute Dukascopy, and your broker's feed may differ by a pip or so.
What is a false breakout in forex, and what do the usual filters do?
A false breakout, also called a fakeout, is a break of support or resistance that closes back inside. The people hurt are the ones the textbook sent in on the break, and the ones who sold the level with a stop just past it. That second group gets stopped and then watches price go their way.
Most guides offer filters to avoid one, and each has a limit:
- Volume. Spot forex has no central exchange, so the volume on a retail chart is a broker's count of price changes.
- Wait for the close. This is the useful one, and it costs you the first part of the move. It can also reverse later in the day.
- A retest of the level. Plenty of false breaks retest first and fail after.
- ADX, MACD or ATR. These are calculations on the same candles, and they arrive after them.
Filters ask about the candle. The next question is about the crowd.
Why did two textbook trades put their stops in one place?
USD/JPY on Tuesday 4 August 2026 printed two patterns on one chart, and no medium or high-impact release for the dollar or the yen was due before 08:30.
The first was a rising trendline. Lows at 157.430 (23:30), 157.474 (00:30), 157.557 (02:15) and 157.611 (03:30) step up through Asia into London. The book says buy each touch, with a stop under the line.
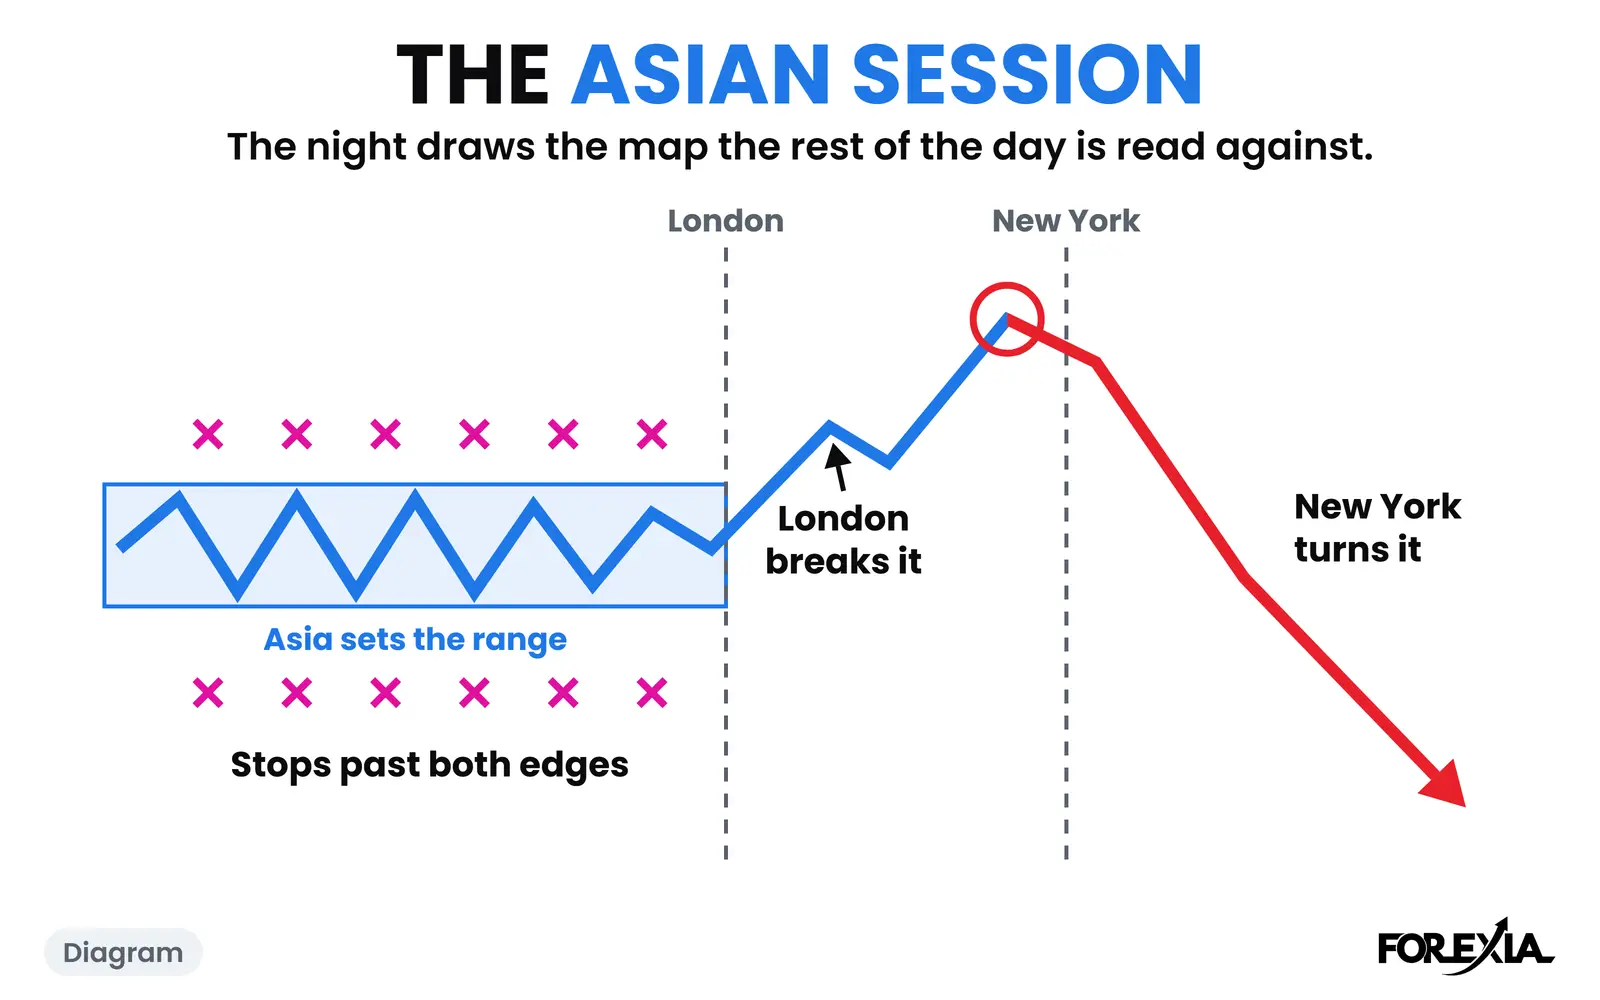
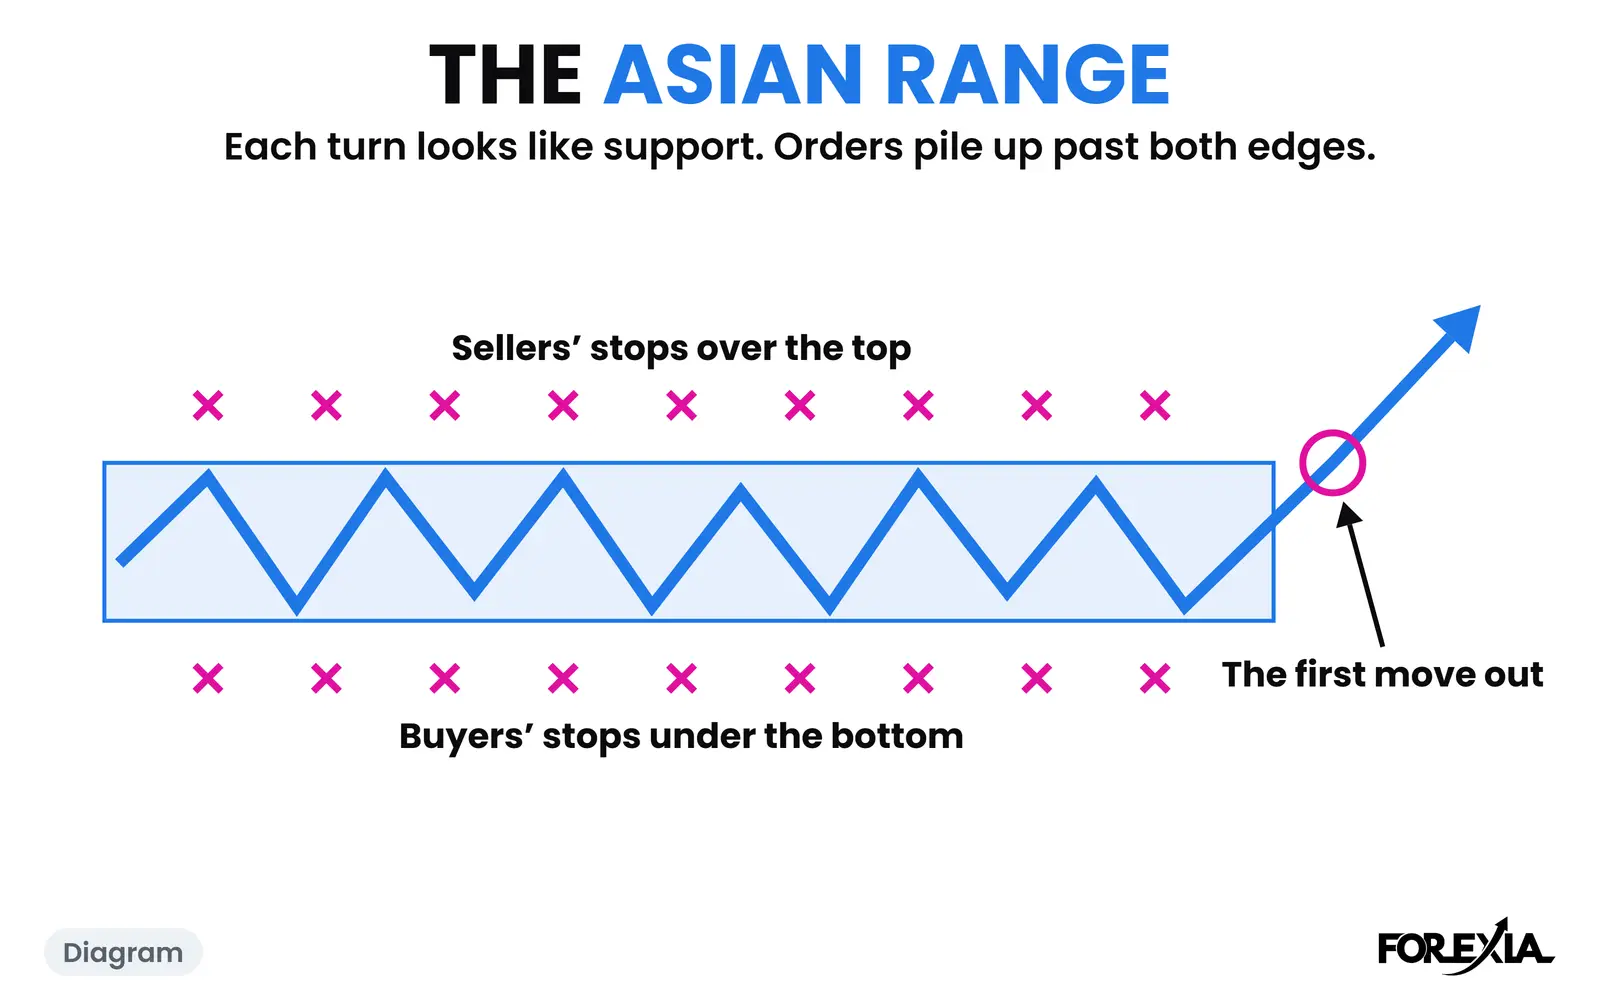
The second was the London breakout. The Asian box had a top of 157.769 that three candles had reached within a pip. The 03:30 candle closed at 157.816, 5 pips over it. The book says buy that close, with a stop under the candle.
Now read it backwards. The breakout candle's low, 157.611, is also the trendline's fourth touch. Two different traders, using two different lessons, were told to hide their stops under the same price. That is what the crowd we call Dumb Money looks like in practice: nobody did anything unusual, and everyone landed in one place.
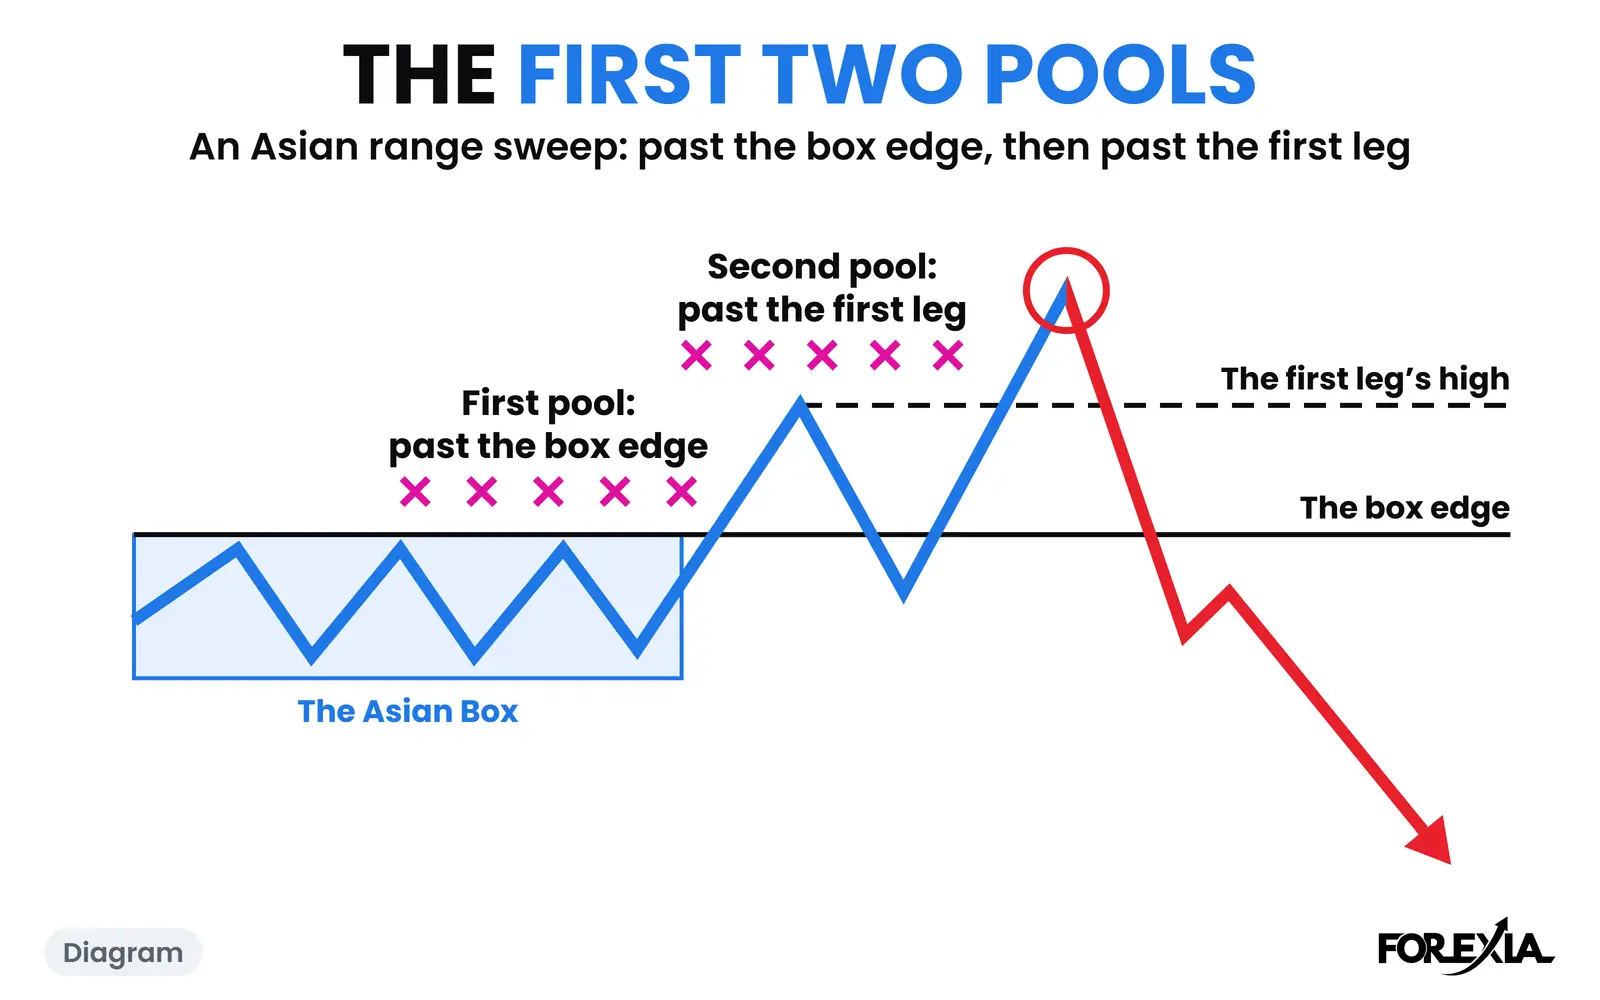
Price went the other way first. At 05:45 it reached 157.957, 7 pips through Monday's high of 157.883. Anyone who had sold that high lost a stop there. We read that as the stop hunt, the liquidity sweep of the nearest pool. Then came the pool under both trades. The 07:30 candle traded to 157.527, 8 pips under 157.611, and the 07:45 candle reached 157.353, under the trendline's first touch.
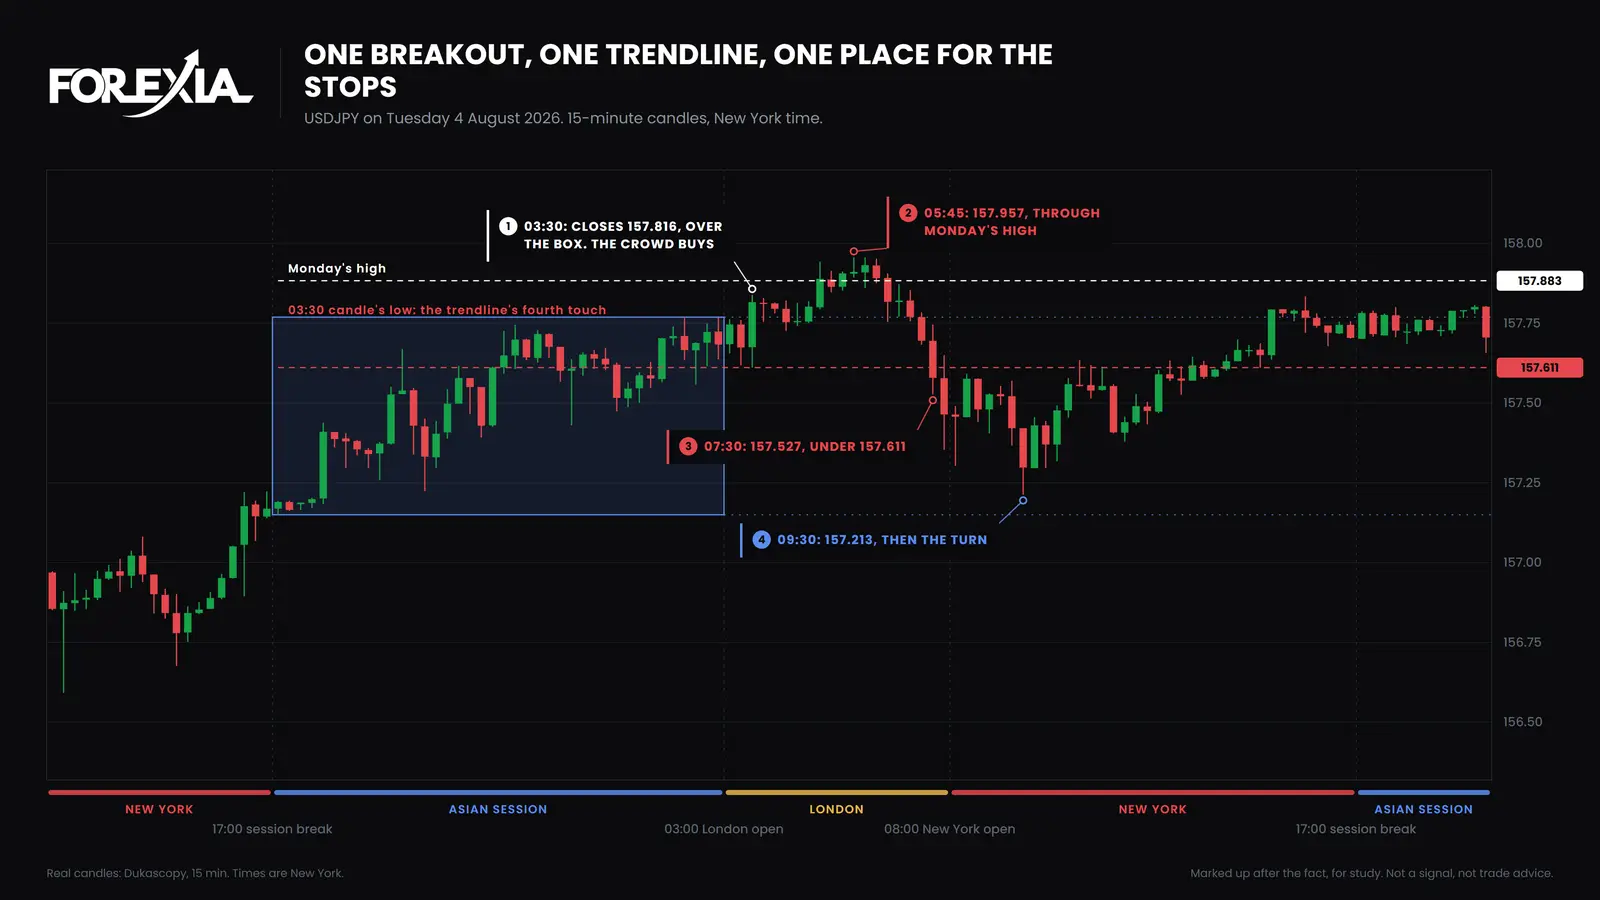
The low came at 09:30, 157.213, 74 pips off the high. The day did not keep falling, and it ended at 157.704. So the read was never that the pair would fall. It was where the stops sat. The glossary page takes the same day from the breakout's side, and the trendline is what this page adds.
Can both sides of one pattern be false?
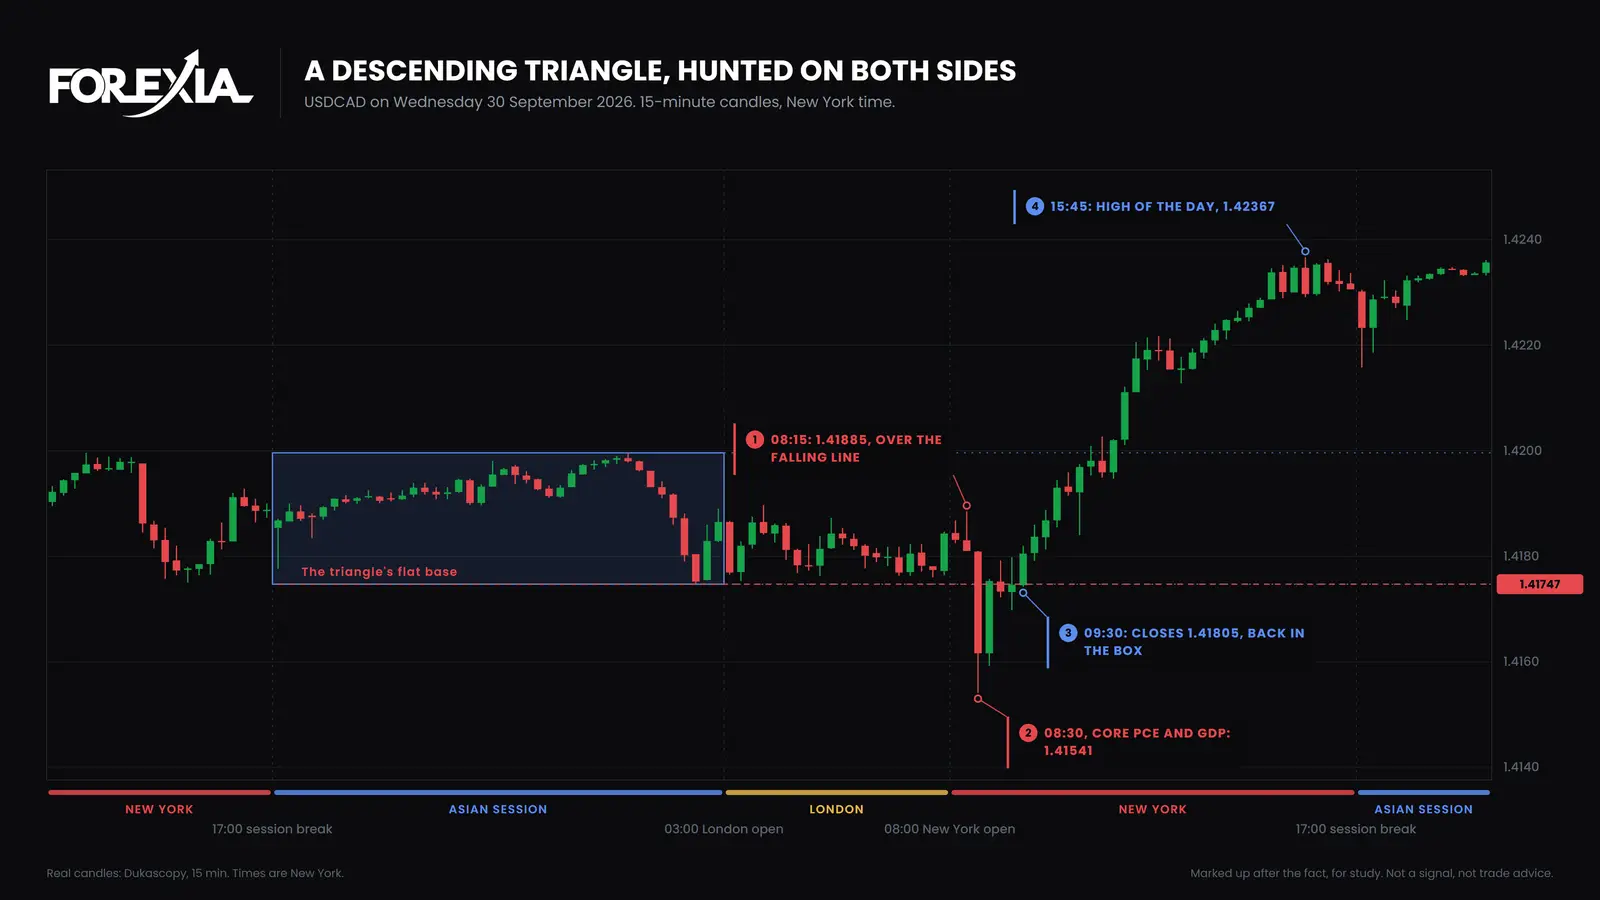
Yes, and a triangle shows it best, because it leaves a crowd on each side. On USD/CAD on Wednesday 30 September 2026 the Asian box grew into a descending triangle through London. A falling line ran through the highs at 1.41996 (00:45) and 1.41823 (07:00). A flat base sat underneath, with lows at 1.41747, 1.41753 and 1.41760. The book says sell a break of that base, with a stop over the falling line.
The top went first. At 08:15, with the medium-impact ADP figure out, price ran to 1.41885, about 10 pips over that line, and whoever had sold early lost their stop. Then came core PCE and GDP at 08:30. That candle opened at 1.41809, fell to 1.41541, 21 pips under the base, and closed at 1.41616. It looked like the break the book promised. We call one huge candle like that the Reversal Candle.
It took an hour to come back. The 08:45 candle closed at 1.41753, less than a pip over the base, and the next two closed under it again. The 09:30 candle closed at 1.41805, back inside the box, and price went on to 1.42367 by 15:45, 83 pips off the low.
How small can a false breakout be?
One pip. EUR/USD on Friday 21 August 2026 had no trendline and no triangle, only Thursday's high at 1.17105. The euro's PMI releases had come at 03:30 and 04:00, and price climbed through London towards that line. Nothing was on the calendar for 05:00. That candle ran to 1.17115, 1 pip past, and closed at 1.17093, 1 pip back under.
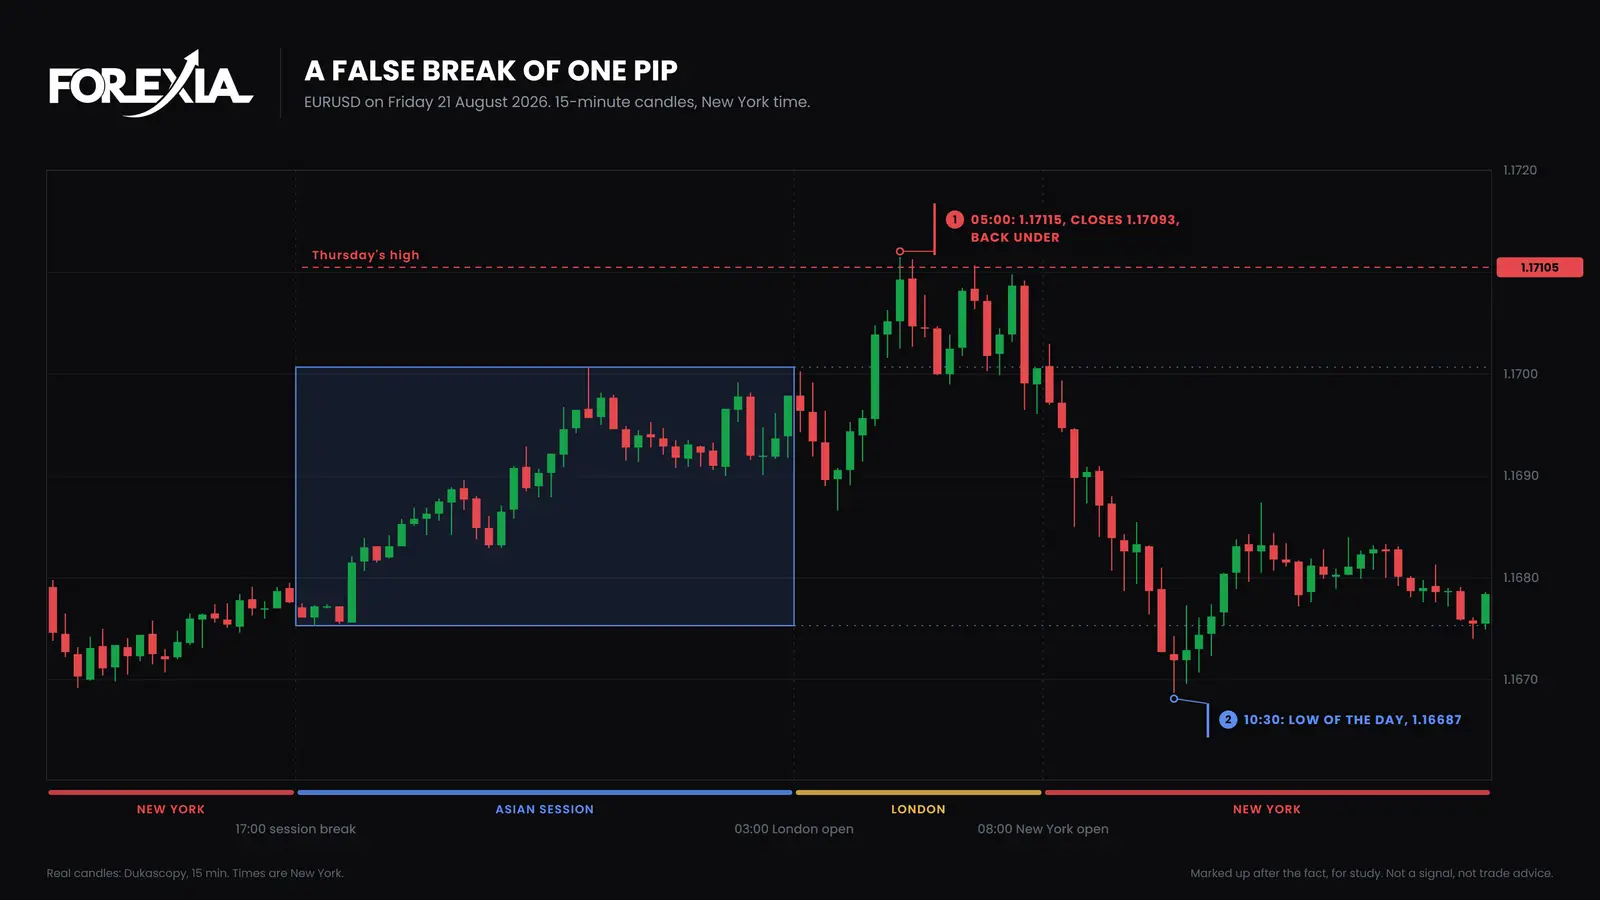
At 10:30 price reached 1.16687, 43 pips under the high and just past Thursday's low. The day ended at 1.16784.
So the three days ran 7 pips, 21 pips and 1 pip past their levels. The depth said nothing in advance.
What did each seat see?
The three seats split that euro morning like this:
- Retail saw a new high. A break of yesterday's high is the textbook's strength. The buy goes in on the break, and the stop goes under the pullback.
- The market maker, as we read it, saw orders. Sellers' stops over 1.17105 and breakout buyers arrive together, in the same pip. Anyone with size to sell has buyers at last. Nobody outside can see those orders, so this is our reading of the structure and not a fact about that candle.
- The observer saw only the order of events. A line everyone could see, a push just past it, a close back in the same candle.
How do you tell a false breakout from a real one?
You often cannot until the close, and sometimes not then. We counted seven dollar majors and gold on 15-minute candles from 6 April to 1 October 2026. Of 1,601 levels taken, meaning an edge of the Asian box or the previous day's high or low traded through after the London open by at least 3% of the average daily range, 1,310 closed back the same day and 291 did not. Those 291 were real breaks. And after 825 of the 1,310 close backs, price traded past the wick again later that day.
That counts candles, not trades. Liquidity grab vs breakout takes the two apart on real days, and how to spot reverse price action walks through a whole gold day. The same logic explains why double tops and double bottoms fail. For the wider picture of price action trading, start at the hub.
We picked these three days because they reversed. A reversal seen afterwards is not a setup, and our own test of the setup as a mechanical rule did not make money. For more dated charts, read how to read a forex chart markup.
Common mistakes
All four come from reading the break and not the crowd behind it.
- Believing the neat version. On USD/JPY two lessons said buy, and their stops shared one candle's low.
- Thinking a triangle has one crowd. On USD/CAD the sellers under the falling line went first, and the sellers of the base looked right for an hour.
- Expecting the turn to run all day. On USD/JPY the afternoon gave most of the fall back.
- Treating every break as false. Those 291 levels ran, and they ran far.
Course 3 of ForexiaPRO, Reverse Price Action, teaches this read step by step, from lesson 3.1.1, Every Pattern Is an Invitation.
Frequently asked questions
What is a false breakout in forex?
It is a move through a support or resistance level that does not stay there: price trades past the level and closes back on the side it came from. Anyone who traded the break now holds a loser. Traders also call it a fakeout or a fake breakout.
How do you spot a fake breakout?
Not while the candle is open. On our charts the test is where the candle closes against the level, and even that can change later in the day. Before the break, you can mark where a pattern has told its traders to put their stops. That tells you where a false break would go, not whether one will come.
How far past a level does a false breakout go?
There is no fixed distance. On EUR/USD on 21 August 2026 it went 1 pip past Thursday's high. On USD/JPY on 4 August 2026 it went 7 pips past Monday's high. On USD/CAD on 30 September 2026, on a data release, it went 21 pips under the base of a triangle.
Are most breakouts in forex false?
In our count of 1,601 levels taken on seven dollar majors and gold, from 6 April to 1 October 2026, 1,310 closed back the same day and 291 did not. That counts candles, not trades, and it is one six-month sample. A close back does not mean the trade the other way pays: our own test of that as a mechanical rule did not make money.