Asian Range Liquidity Sweep: The First Two Pools of Stops
Dylan Forexia7 min read
An Asian range liquidity sweep is price running just past the high or low of the Asian session to take the stops resting beyond it. Those edges are pools of stops because every textbook gives the same trades on them. On the two real days below, a first move out of the range took one edge, the extreme it left drew stops of its own, and a second move went to those.
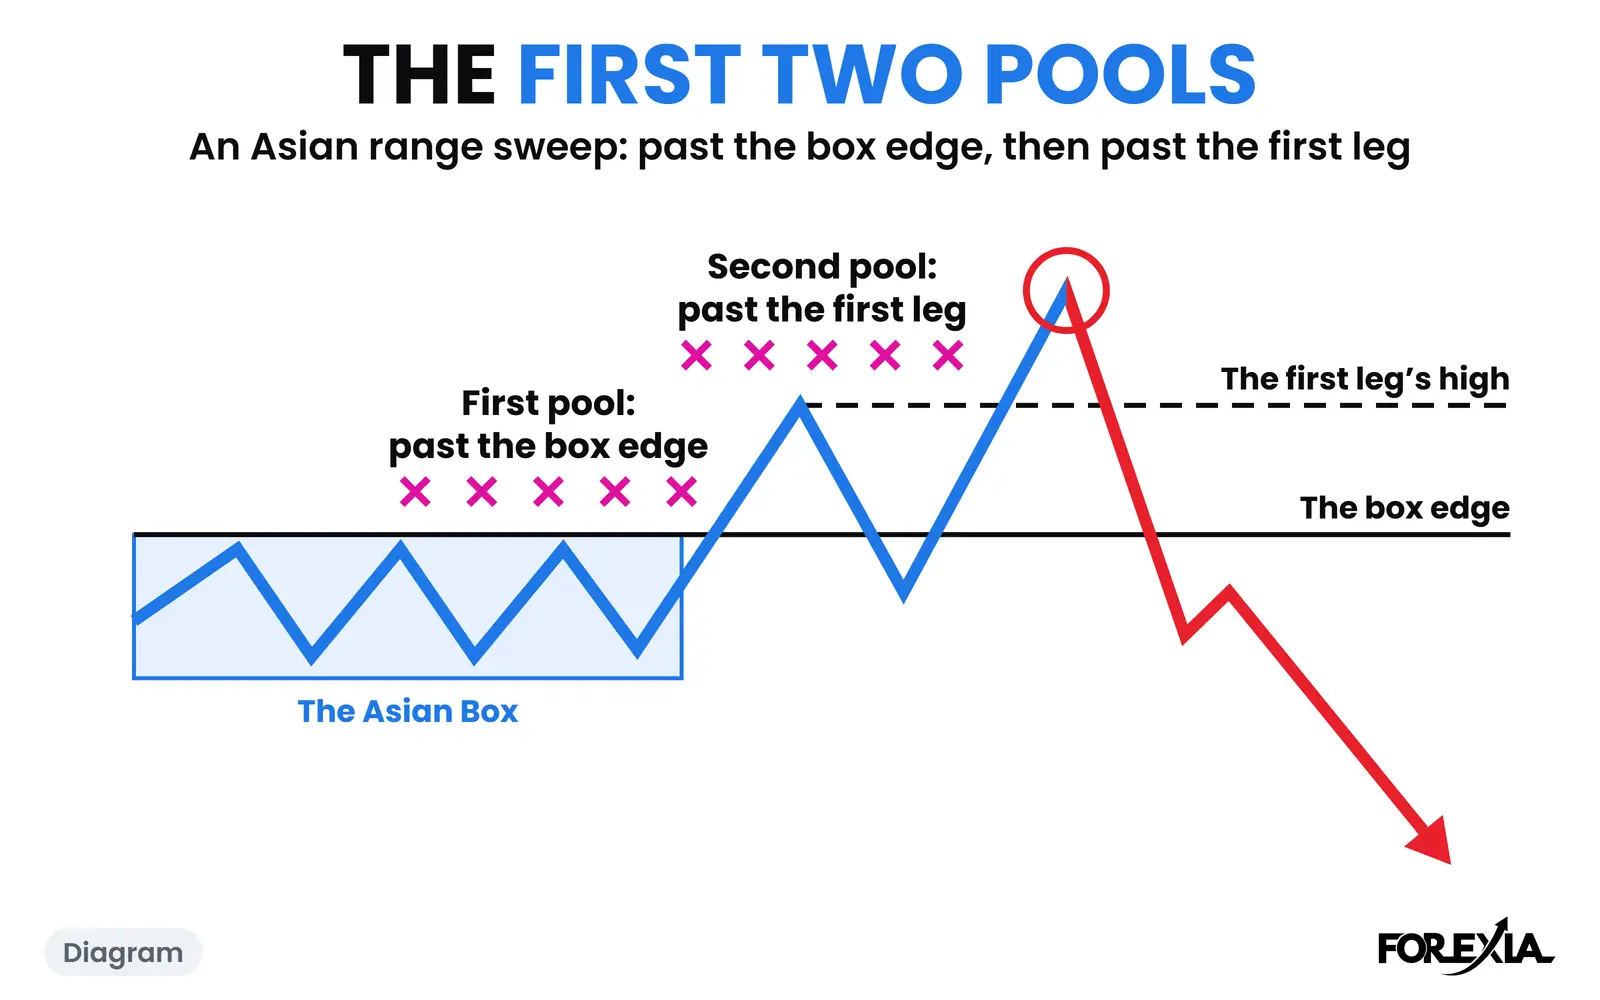
Drawn on the chart, the range is the Asian box. An extreme like that is the high or low of the day. One of the two days turned off a high and the other off a low.
What is an Asian range liquidity sweep, and why do stops pool there?
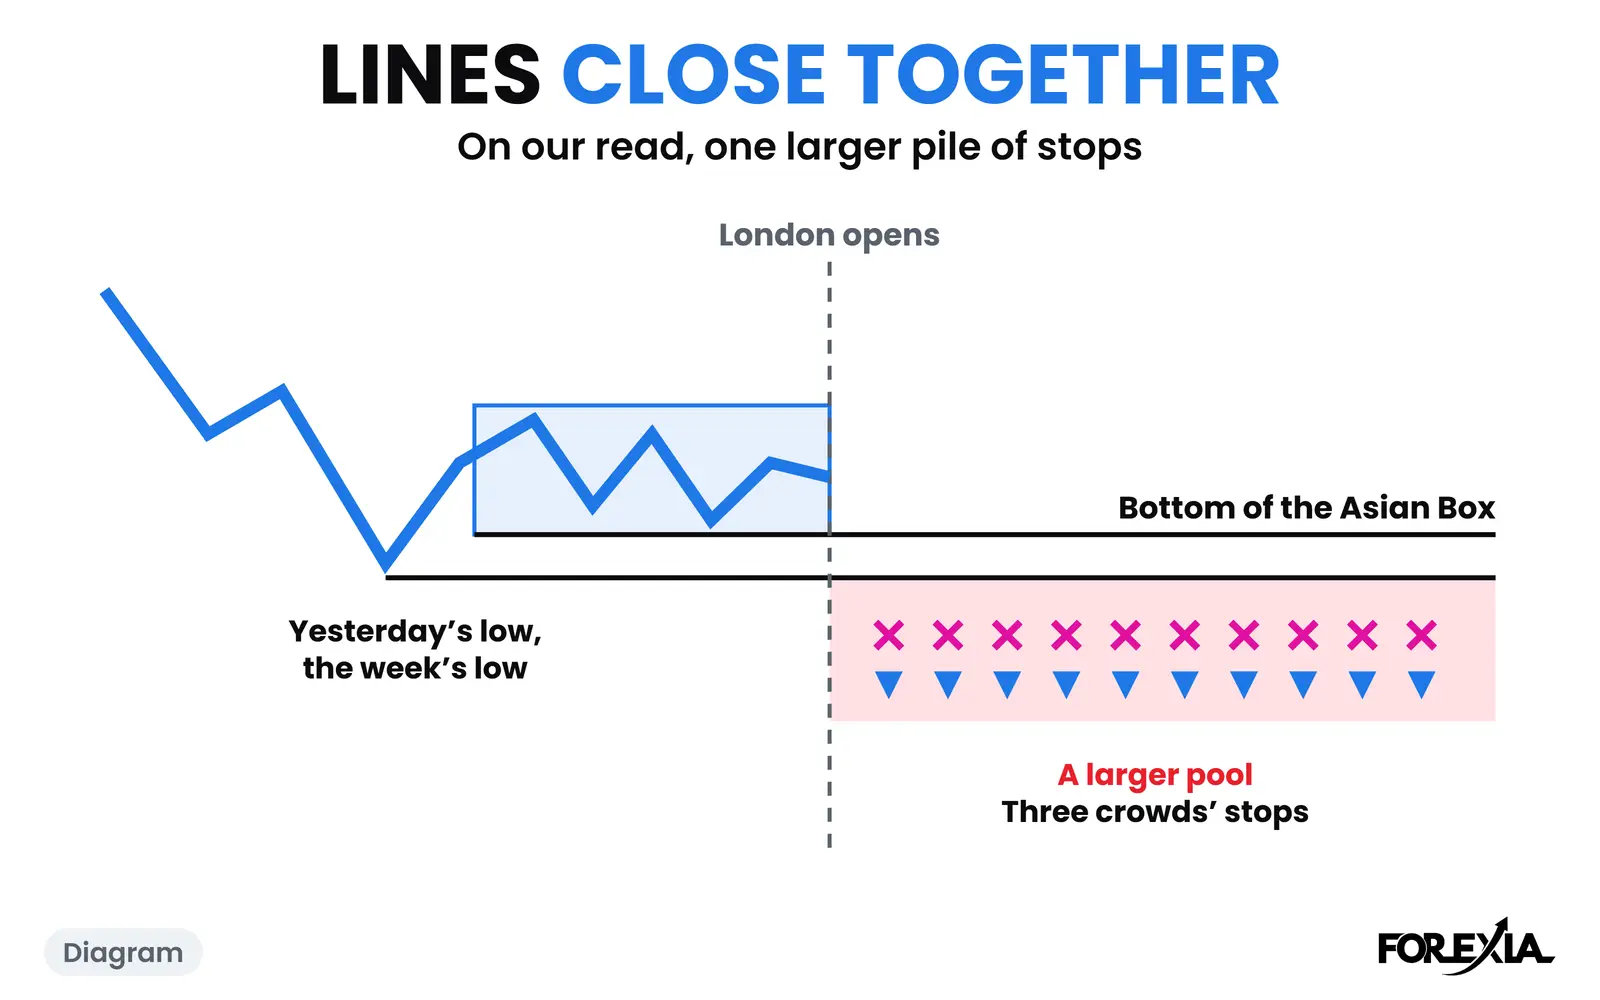
A liquidity sweep is price going through a level where stops rest. They pool past the Asian range because by the time London wakes up, every trader can see the same box and the textbook gives the same three trades on it: buy the bottom, sell the top, or trade the break. Buyers' stops go under the low and sellers' stops go over the high. The calm of Asia, the window of tolerance, gives them hours to settle there.
Then London arrives. The UK is the largest FX trading location in the world, and its open comes with those stops sitting a few pips from the market. We read what follows as price going where the orders are. Marking those orders before the session is Liquidity Mapping, and where liquidity sits on a chart covers the rest of the map.
How do you mark the Asian range?
Draw it on the wicks, from the 17:00 New York session break to the London open at 03:00 New York. The sessions and when each one opens have their own page. Two details change where your lines go.
Use the whole window. Several guides stop the range at midnight New York. On USD/CAD on Monday 17 August 2026 that would have put the bottom of the box at 1.38630. The real low came at 02:45, at 1.38573, 6 pips lower.
Use the wicks, not the closes. Stops go past the wick. On NZD/USD on Monday 21 September 2026 the wicks give 0.57151 to 0.57275, 12 pips. The closes give 0.57160 to 0.57253, 9 pips. A box drawn on the closes is a quarter too small, and so is your map. An indicator can draw the box for you, as long as its window and its wick setting match these.
One thing to watch: the first candle after 17:00 is the daily rollover, when spreads often widen. A chart of the bid can print a wick there that the rest of the market never saw, as a 13-pip wick on USD/CAD shows. If an edge of your box is that wick, treat it with suspicion.
A sweep off the high: NZD/USD, Monday 21 September 2026
NZD/USD's box was tight and clear: 12 pips, 26% of the pair's 48-pip average daily range. London's first candle dipped to 0.57130, 2 pips under it, and then price turned up. At 04:45 the first leg reached 0.57319, 4 pips over the top of the box. That was the sweep of the Asian high, and the break the crowd buys: the London Breakout. It also left the high of the day, with fresh stops just over it.
By 06:45 price was back at 0.57239, the neck. At 08:00 a second leg ran to 0.57380, 6 pips past the first leg. It did not go back for the box, which was already behind it. It went for the newest pool. We call that the stop hunt, and on an M or a W it is the Second Leg Climax.
The next candle closed at 0.57316, back under the first leg's high. By 14:30 price was at 0.57133, 25 pips under the top and through the bottom of the box. No high-impact release lined up with any of it.
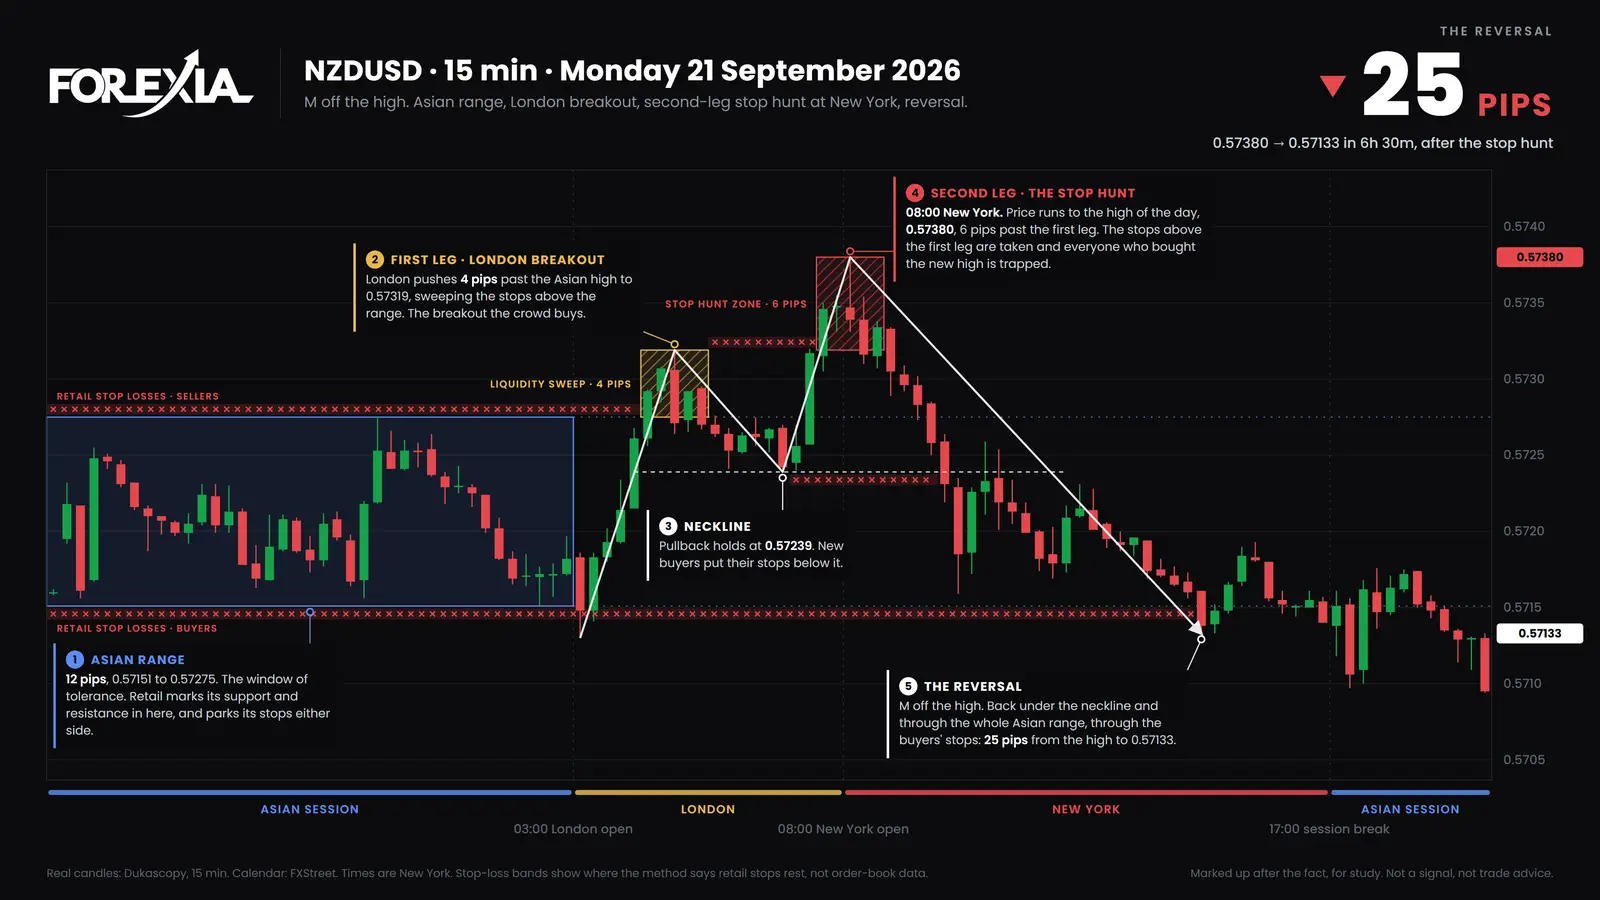
That shape is an M off the high, one half of M & W Reversals.
A sweep off the low: USD/CAD, Monday 17 August 2026
This is the same order the other way up, on a messier box. USD/CAD's range was 17 pips, 1.38573 to 1.38742. It drifted lower all night and closed near its own bottom, and our chart marks it as no tight range. London dipped under it early, as low as 1.38518, and drifted back inside without a clean turn.
Canada's inflation figures came out at 08:30. By 08:45 the first leg had reached 1.38503, 7 pips under the box and the low of the day so far. Breakdown sellers got in. Price bounced to 1.38584 by 09:00, the neck.
At 10:15 the second leg reached 1.38443, 6 pips past the first leg and 13 under the box, and that candle closed at 1.38512, back above the first leg's low. By 15:00 price was at 1.38774, 33 pips off the low and through the whole box.
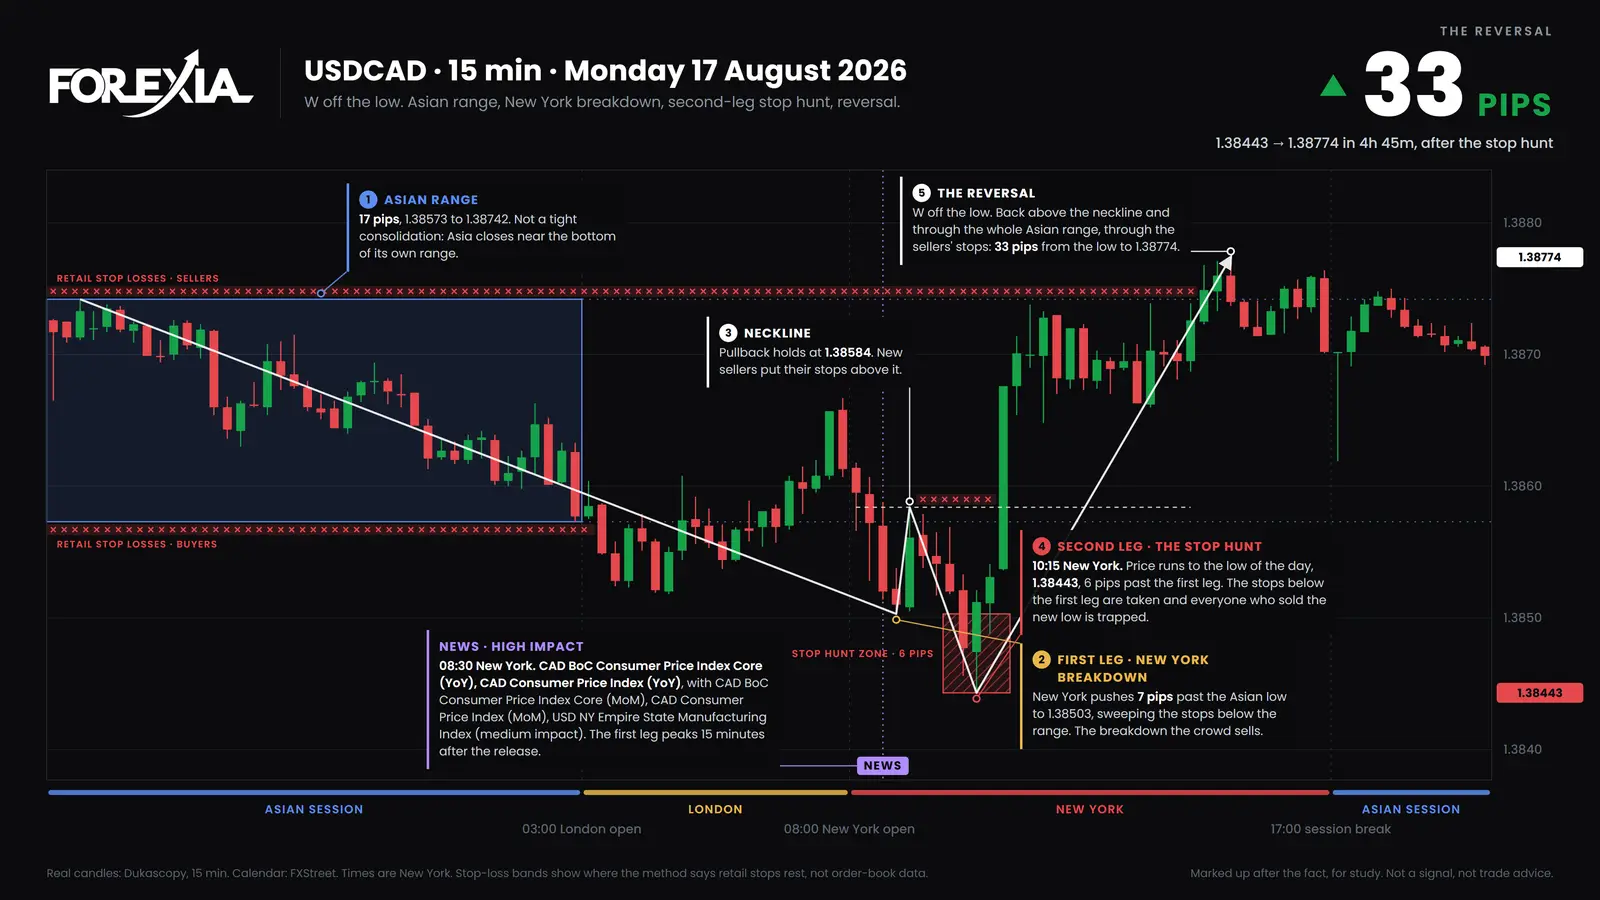
What did each seat see on these two days?
The three seats read the same candles as a break, a pool and an order of events.
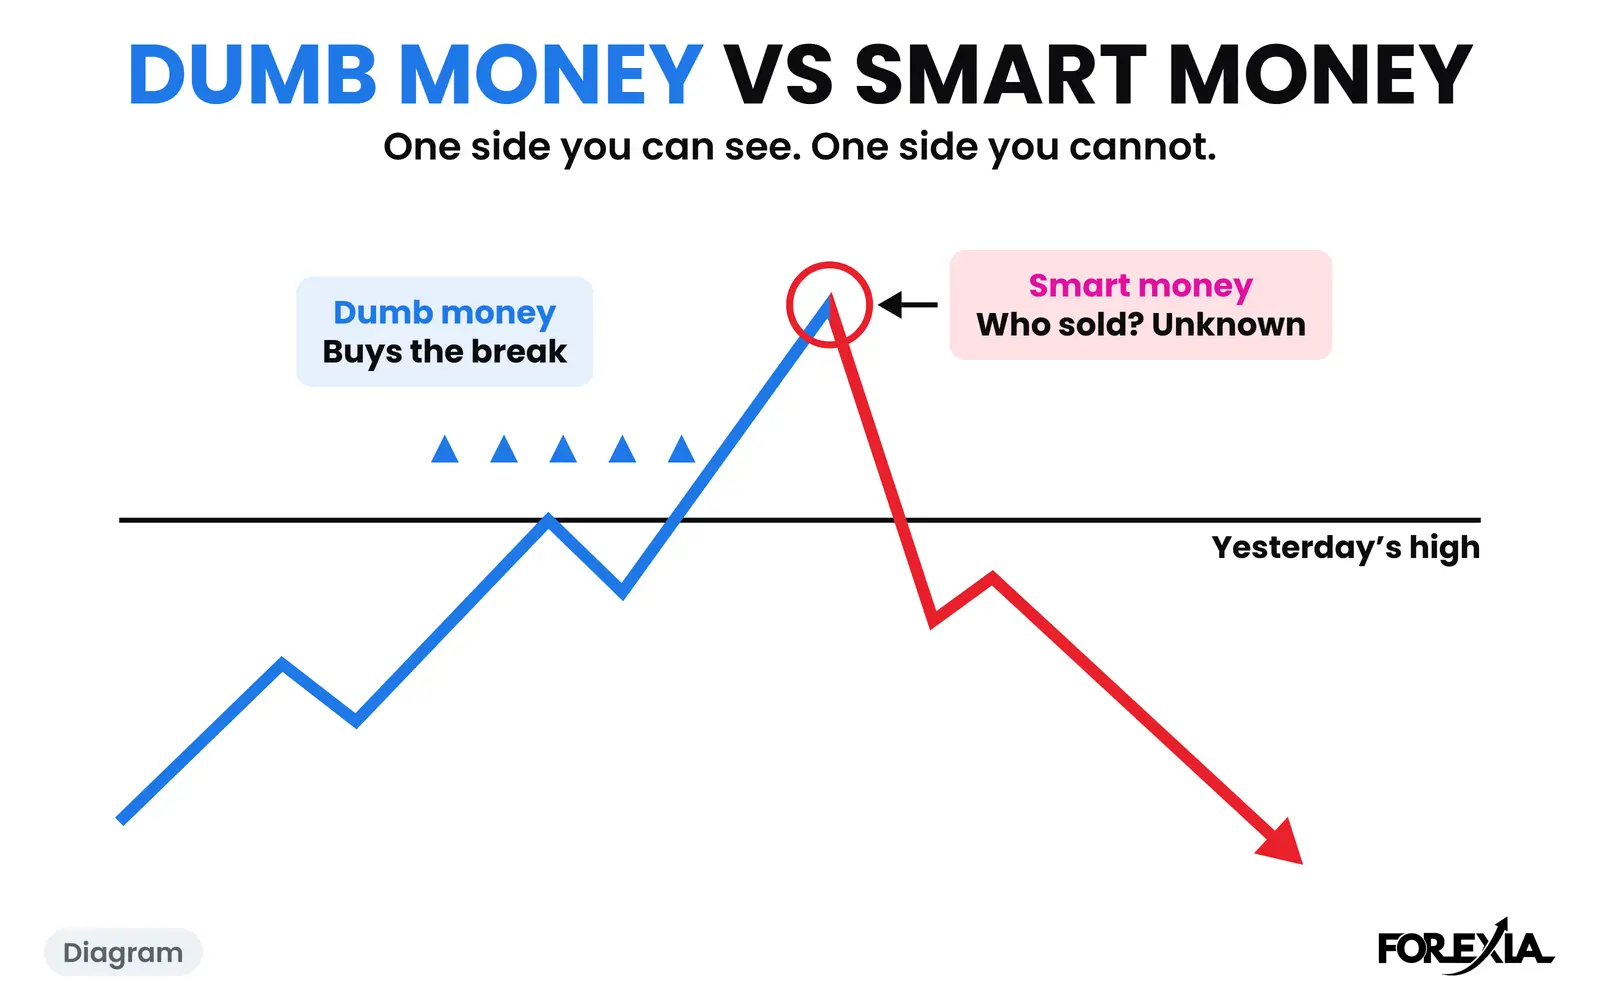
- Retail saw a break. The textbook buys NZD/USD over 0.57275 and sells USD/CAD under 1.38573, then does the same again at each new extreme.
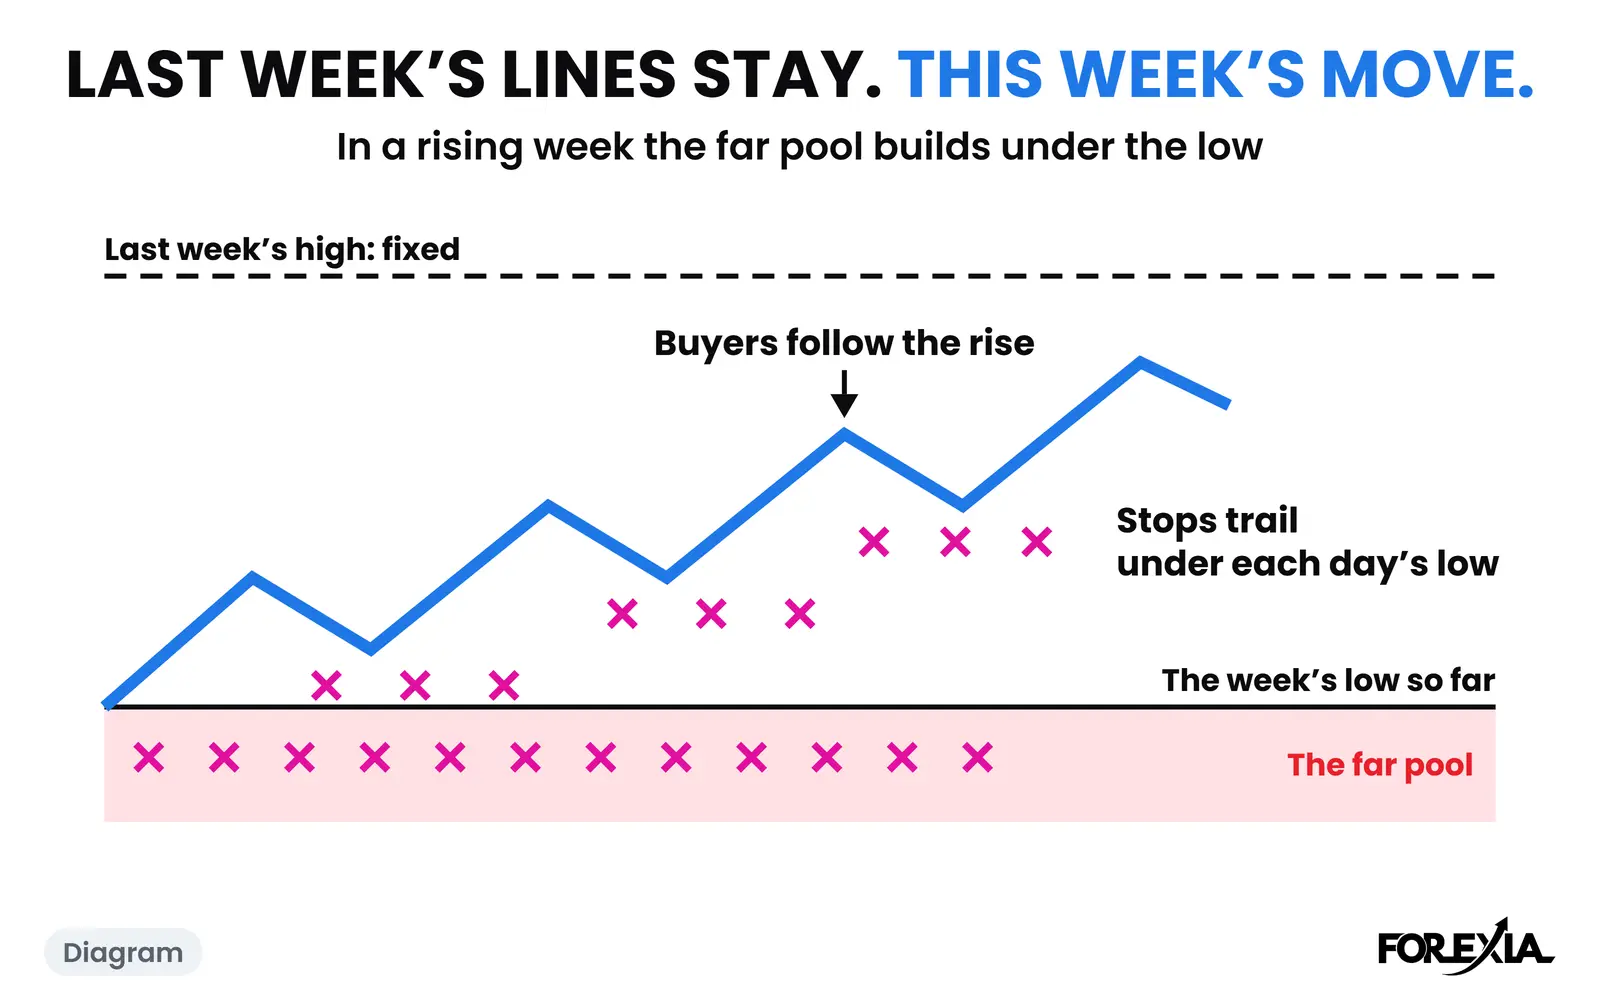
- The market maker, as we read it, saw two pools. One sat past the box. The other grew past each new extreme, as the break invited trades and each trade put a stop just beyond it.
- The observer saw what came first. On both days a box, a move out of it, a pullback, a second push past the first, then the close back. On both days the second leg went 6 pips past the first. That is a coincidence of these two days and not a number to rely on.
Which edge gets swept first?
You do not know in advance, and NZD/USD shows why. London took the low first, by 2 pips, in its first candle, and then went on to take the high. Many guides tie the side to a daily bias, and none we read shows a test of that. Both edges are pools until price goes to one of them.
Does London always sweep the Asian range?
No. Some days the first break is the real one. On AUD/USD on Thursday 3 September 2026 the box ran 14 pips, and London closed above it at 03:45. Price never traded back inside and ran 35 pips past it. A seller's stop over that box was a wrong read doing its job, not a hunt.
Most pages on this search imply a sweep every morning, and none shows a count. This page does not either. Two days show what a sweep looks like, not how often it happens.
Does it look different on other pairs?
The shape does not, only the size. In our own testing, hunts past the Asian range were very different in pips from pair to pair and nearly identical as a share of each pair's own daily range. So a fixed pip count tells you little, and how big a normal box runs on each pair has its own page. Both charts here are 15-minute charts.
Is an Asian session liquidity sweep strategy worth trading?
Not by itself, on our evidence. The strategy most pages describe is to mark the range, wait for a sweep of one edge, look for a confirmation and trade the other way. We ran that kind of setup as a mechanical rule and it did not make money. What we found when the hunt kept going has the detail.
A sweep is a map. It tells you where stops were taken and who may be trapped. The charts here were marked up after the fact, and their red stop bands are a reading of the structure, not order-book data. Treat them as study.
Common mistakes
All three come from treating the box as the whole map.
- Calling the first leg the hunt. On USD/CAD the first leg broke the box by 7 pips and the second went 6 pips further. Anyone who took the first as the end of it was early.
- Watching only the box. On both days the second leg did not go back to the box, which was already behind price. It went past the high or low of the day, where the newest stops were.
- Treating every box alike. NZD/USD's box sat flat and USD/CAD's drifted lower all night. Those lines were not equally clear, and a chart cannot show how many traders relied on either.
Course 1 of ForexiaPRO, Reading the Map, teaches this daily map step by step in lesson 1.2.2.
Frequently asked questions
What time is the Asian range?
We draw it from the 17:00 New York session break to the London open at 03:00 New York. Some guides stop at midnight New York, which can miss the real edge: on USD/CAD on 17 August 2026 the low of the range came at 02:45.
Should I draw the Asian range on wicks or closes?
On the wicks, because stops go past the wick. On NZD/USD on 21 September 2026 the wicks give a 12-pip box and the closes give 9 pips, which puts both edges in the wrong place.
Does the Asian range always get swept?
No. Some days the first break is the real one. On AUD/USD on 3 September 2026 London closed above the range at 03:45 and price never traded back inside, running 35 pips past it. This page shows what a sweep looks like, not how often it happens.
Why do stops pool past the Asian range?
Because by the time London opens every trader can see the same two lines, and the textbook puts buyers' stops under the low and sellers' stops over the high. Nobody outside can see those orders, so this is a reading of the structure. On the two days on this page, price went past an edge and then past the extreme it left.