
Liquidity Mapping: How to Mark the Pools of Stops Before the Session
Liquidity Mapping is marking the pools of stops on the chart before the session: where the textbook trader enters, and where their stop sits. The chart becomes a map of orders. It is the preparation behind any talk of stop loss hunting in forex: you mark where a hunt could go before it goes, then read what price does when it gets there.
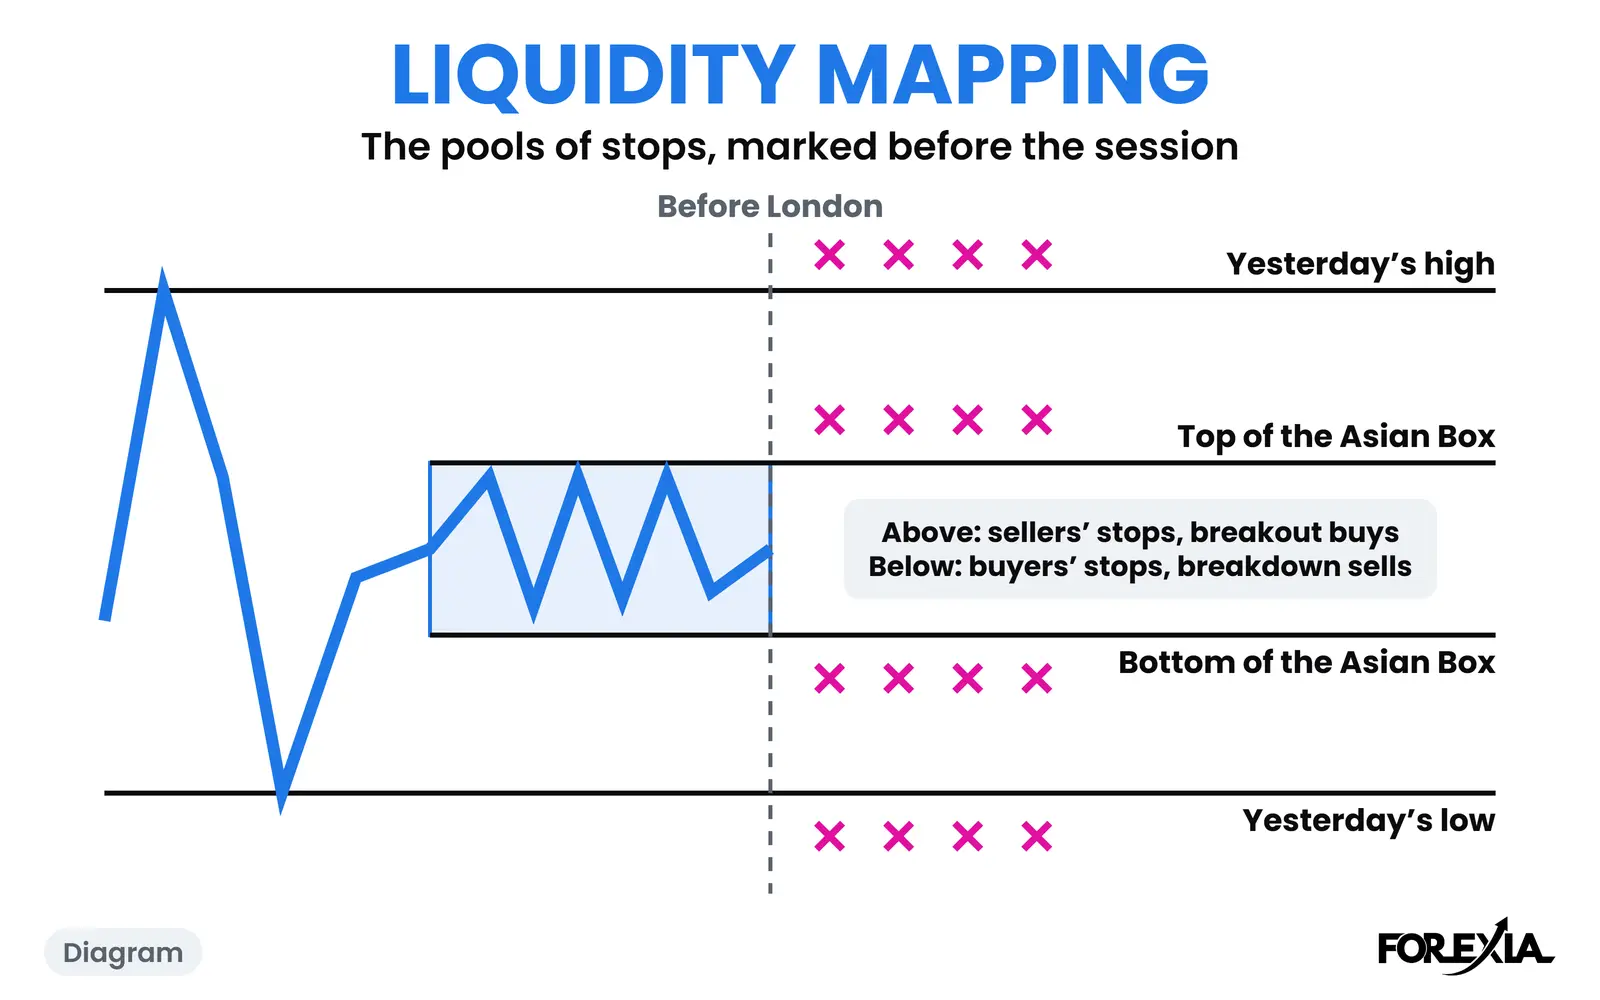
What does Liquidity Mapping look like on a chart?
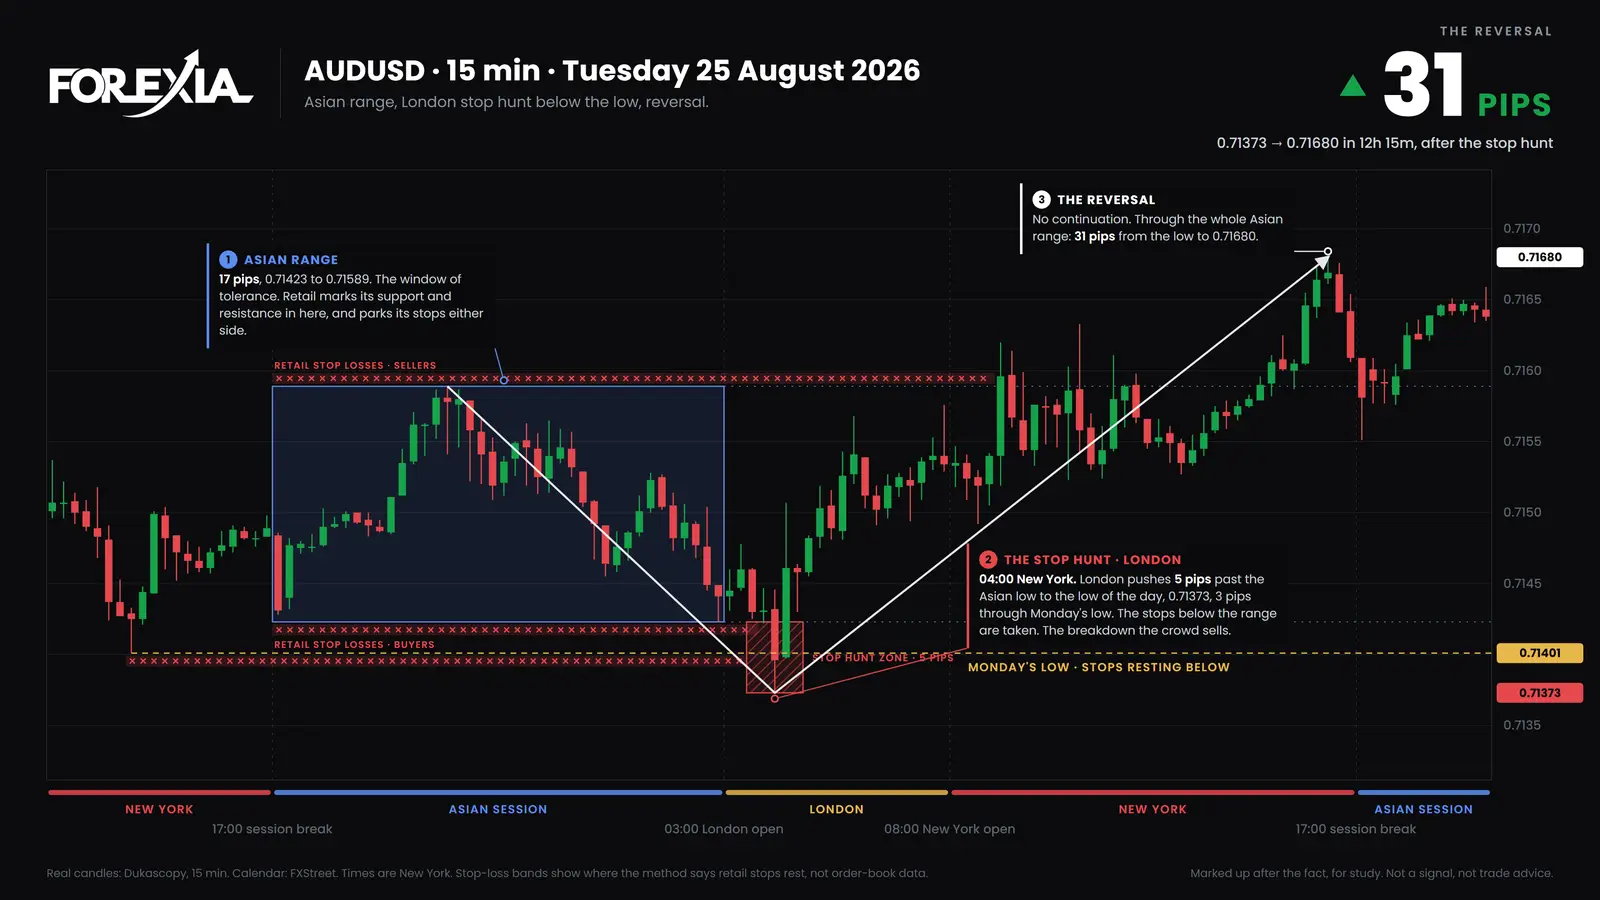
It looks like a few lines, with a note of whose orders rest past each one. This is the map for AUD/USD on Tuesday 25 August 2026, as it stood before the London open, with the last column filled in afterwards.
| Line | Price | What rests past it | What price did |
|---|---|---|---|
| Monday's high | 0.71764 | Sellers' stops, breakout buys | Not reached that day |
| Top of the Asian Box | 0.71589 | Sellers' stops, breakout buys | Taken later that day |
| Bottom of the Asian Box | 0.71423 | Buyers' stops, breakdown sells | Taken at 04:00 New York |
| Monday's low | 0.71401 | Buyers' stops, breakdown sells | Taken at 04:00, by 3 pips |
The bottom of the box and Monday's low sat 2 pips apart, so we read them as one pool. At 04:00 New York a candle fell to 0.71373, 5 pips under the box and 3 under Monday's low. The next candle closed at 0.71461, back inside the box: the Close Back. By 16:15 price was at 0.71680, 31 pips off that low.
Nobody outside can see those stops. Spot forex trades over the counter, so no public book shows them. A map is a reading of where the textbook puts a stop order, and what price did at each line is the only part anyone can check.
Liquidity Mapping and stop loss hunting in forex: what is the difference?
Stop loss hunting is a claim about what happened. Liquidity Mapping is the work done beforehand, and it claims nothing about who moves price. Most people search the first phrase after a loss. A map shows, before the session, whether a stop would have sat in a pool. When price takes a marked pool and comes back, that is a liquidity sweep. The guide to stop hunting in forex takes up whether it is real and whether brokers do it.
Search for a liquidity map and you will mostly find indicators that draw a line at every swing high and low. A tool can place a line. Which lines the whole crowd shares, and which two are really one pool, is the read.
Liquidity Mapping and Liquidity Visualization: how do they differ?
Liquidity Visualization is the seeing, and Liquidity Mapping is the marking. The first works out why orders rest at a level, from what the crowd's pattern tells it to do. The second puts the answer on today's chart, before the session, as lines you can check afterwards. Lines copied from someone else's chart have no reasons behind them. A read never written down gets revised once the day is over. That page owns the reasoning; this one owns what goes on the chart.
How do you read a liquidity map?
Read it by scale, smallest first: the Asian Box and the high and low of the day, then the previous day's high and low, then the week's high and low. We read entries at each line, and the stops and breakout orders beyond it. Where liquidity sits on a chart and how to find liquidity pools go further.
How far past? We counted the edges of the Asian Box and the previous day's high and low on seven majors and gold, from 6 April to 1 October 2026. Take the levels traded through by at least 3% of the average daily range after the London open, leaving out any Asia had already passed, that closed back the same day. The median trip past the line was 4.1 pips on USD/CHF, 6.5 on EUR/USD, 7.4 on USD/JPY and 10.1 on gold. These are counts of candles, not trades.
What do traders get wrong about Liquidity Mapping?
Three readings cost the most.
- Expecting the orders on the line itself. We read them beyond it. On 25 August the line was 0.71423, and price went 5 pips under before it turned.
- Through the line means the level failed. The bottom of that box broke by 5 pips, and the day rose 31 from there. A line going through its stops is the map at work.
- The map is a forecast. It says where the stops are, not that price will go there or turn there. Monday's high was on the map and not reached that day. Seen afterwards, 25 August looks like a setup, and it is not one: our own test of this setup as a mechanical rule did not make money.
Which words does Liquidity Mapping lead into?
Five sit next to it.
- Liquidity Visualization: reverse engineering the retail trader's mindset to see where their orders rest.
- High and Low of the Day: the first pool the second leg hunts.
- Previous Day's High and Low: the last trading day's extremes, and the stops past them.
- The Stop Hunt: price driven into clustered stops, commonly called a liquidity sweep.
- The Asian Box: the Asian range drawn on the chart.
Where is Liquidity Mapping taught?
Course 1 of ForexiaPRO, Reading the Map, teaches this read step by step in lesson 1.2.1, The Chart Is a Map of Orders.
Related words
- Liquidity Visualization: Seeing Where the Crowd's Orders Rest Before a Sweep
- The High and Low of the Day: the First Pool the Second Leg Hunts
- The Previous Day's High and Low: What Rests There, and How Often Price Closes Back
- The Stop Hunt: What It Means, and How It Relates to a Liquidity Sweep
- The Asian Box: How to Draw the Asian Range, and What Its Breakout Really Is
Frequently asked questions
What is Liquidity Mapping?
It is marking the pools of stops on the chart before the session: where the textbook trader enters, and where their stop sits. The result is a chart with a few lines on it, and a note of whose orders rest past each one.
Does a liquidity map show real stop orders?
No. Spot forex trades over the counter, so no public book shows where stops rest. A map is a reading of where the textbook puts them. You can check what price did at each line afterwards, but not what was sitting there.
Is Liquidity Mapping the same as a liquidity heatmap?
No. A heatmap or liquidity indicator is a tool that draws lines or colours by its own rule, often at every swing high and low. Liquidity Mapping is done by hand before the session, and it keeps only the levels the whole crowd can see.
What is the difference between Liquidity Mapping and Liquidity Visualization?
Liquidity Visualization is the seeing: working out from the crowd's pattern why orders rest at a level. Liquidity Mapping is the marking: putting those levels on today's chart before the session, where they can be checked afterwards.