
The COT Report: How to Read the Commitment of Traders Report for Forex
What is the Commitment of Traders report, and who files it?
The Commitment of Traders report, or COT report, is the weekly count by the US Commodity Futures Trading Commission of who is long and who is short in each futures market. Positions are counted on Tuesday and published on Friday at 15:30 New York time. For forex, it shows where the large speculators stand.
Nobody volunteers this. The firms that carry the accounts report positions to the regulator every day, for any trader at or above the reporting level the CFTC sets for that market. A market appears in the CFTC's COT report once 20 or more traders hold positions at those levels. COT data has been published since 1962, and weekly since 2000.
It matters because it is the one regular, official count of how big traders are placed in currency and gold futures. What it does not count matters just as much: the spot forex market, your broker's clients, and any bank's own book are all outside it. It is a large sample of one market, and it describes positions. It forecasts nothing.
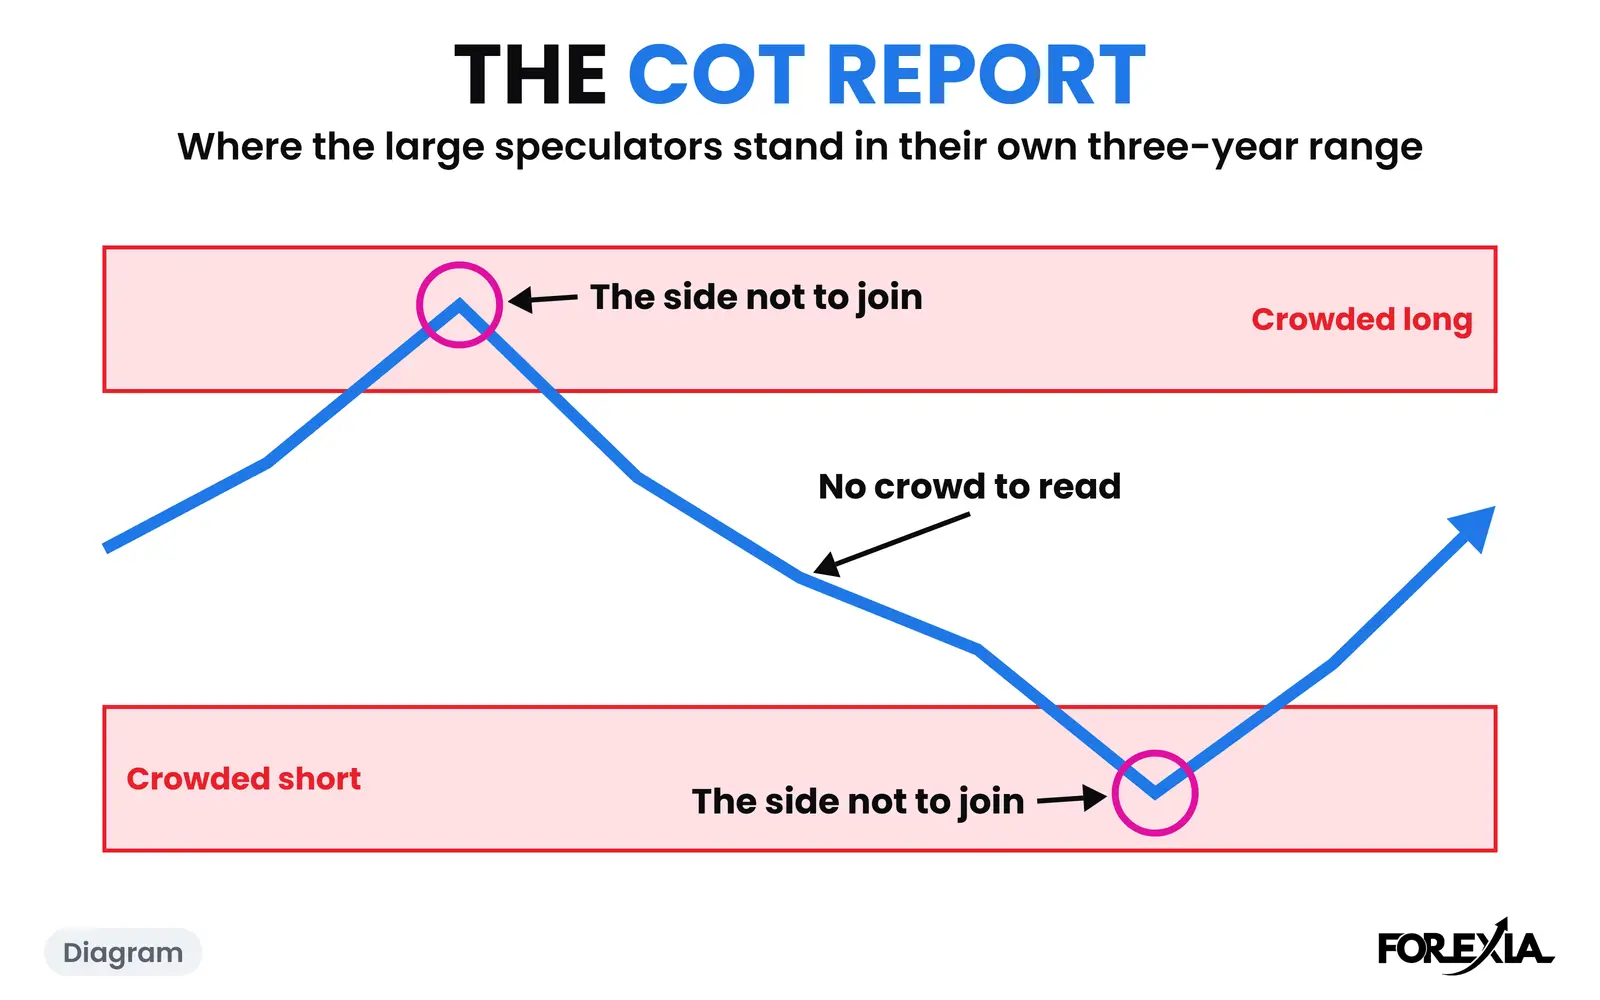
Our page sorts it for one purpose. The large speculators are the crowd, and at the ends of their range we read that crowd as the thing not to join. That read has a name, Fade the Crowd, and the rest of this page explains the report first and the read second. If you want the short version on its own, start with what the COT report is in forex.
Which COT report should you use for forex: legacy, disaggregated or TFF?
Use legacy or Traders in Financial Futures (TFF), because the disaggregated report does not cover currencies. The CFTC publishes four main reports, and each sorts the same market's holders differently. The fourth, the supplemental, covers 13 agricultural contracts and does not matter here.
| Report | Covers | Its groups | Our plain words |
|---|---|---|---|
| Legacy | Every market, currencies and gold included | Non-commercial; commercial; nonreportable | Large speculators; hedgers; small traders |
| TFF | Financial futures, currencies included, not gold | Dealer/intermediary; asset manager/institutional; leveraged funds; other reportables | Banks making the market; pension funds, insurers and mutual funds; hedge funds and trading advisers; the rest |
| Disaggregated | Physical commodities, gold included, not currencies | Producer/merchant/processor/user; swap dealers; managed money; other reportables | Businesses hedging real goods; swap desks; commodity funds and trading advisers; the rest |
We use legacy's large speculators, because that one group means the same thing on all eight markets, gold included. TFF is more exact where it exists, and we read it beside legacy for the other side of the crowd.
The labels do not line up, and one real Tuesday shows it. On the euro, on 27 October 2026, legacy has commercials net long 114,484 contracts and non-commercials net short 143,894. TFF, on the same contract and the same day, has dealers net short 138,016, leveraged funds net short 71,574 and asset managers net long 173,249. Legacy sorts a trader by whether it hedges, and TFF sorts by the kind of business it is. So "commercials" and "dealers" are not two names for one group, and neither report's speculators can be swapped for the other's.
On gold the difference is one of width. On that same Tuesday legacy's non-commercials held 223,724 long and 37,273 short, while disaggregated's managed money held 122,508 and 16,946.
Each report also comes as futures-only or futures and options combined. Our numbers are futures-only. For a full comparison of the groups, see legacy vs disaggregated vs TFF.
How do you read net positions and the COT index?
You read a net position by subtracting shorts from longs, and you read the index by setting that net against its own past. The first says what a group holds. The second says whether that is a lot for them.
Take the euro's large speculators in the report counted on 27 October 2026. They held 230,646 contracts long and 374,540 short, so the net position was 143,894 short. There is a third column, spreading: traders holding equal long and short futures, which we leave out of the net. Each row also prints the week's change, each group's percentage of open interest and the number of traders. Then the share: open interest was 868,188 contracts, the total not yet closed, so that net was 16.6% of it. We use the share because open interest grows and shrinks, and the same net means less in a bigger market.
On its own, 16.6% says little. So the index asks where it sits in that market's own three years:
Index = (this week's share − lowest share in 156 weeks) ÷ (highest share − lowest share) × 100
The euro's share ran from 16.6% short to 20.1% long over those 156 weeks. This week is the low, so the index is 0: the most short in three years. An index of 100 is the most long, and 50 is the middle of their range.
Gold shows why you need it. That same week large speculators were net long gold by 186,451 contracts, 47.0% of open interest, which looks like a lot. Their range was 31.2% to 57.7%, all of it long, so the index was 60: ordinary.
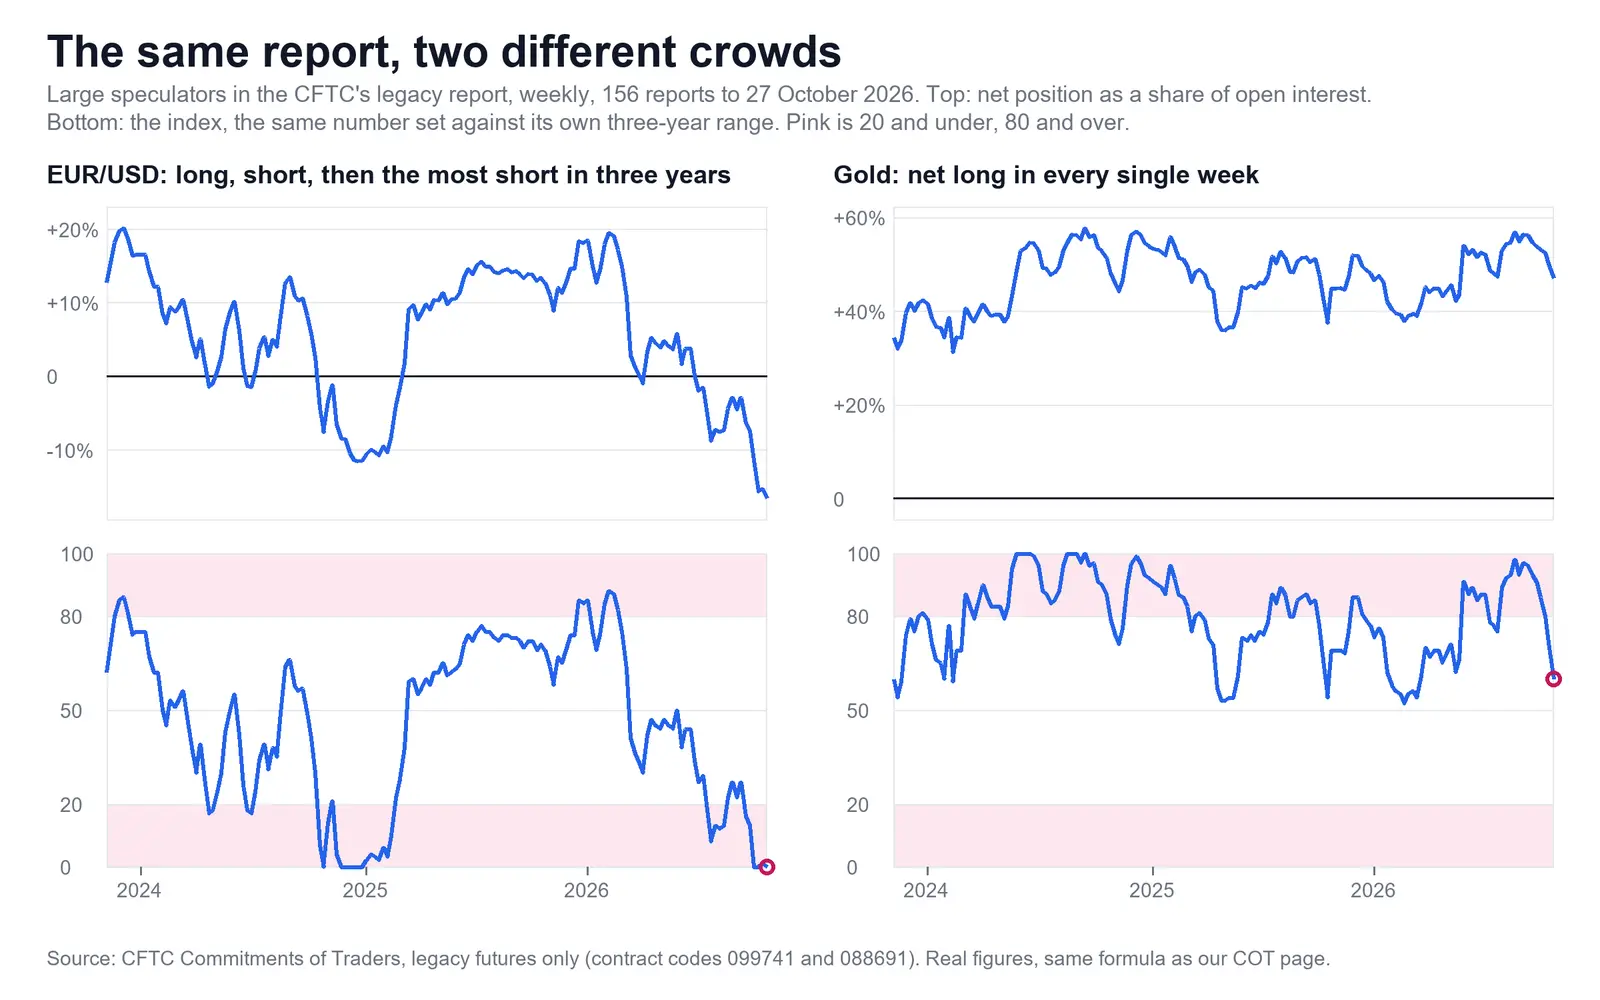
The index is not official. The CFTC publishes no such number. Other tools use raw contracts instead of a share, or a window of six months or a year, so two sites can print different numbers for one week and both be right by their own formula. Always check which one you are reading. Our three-year window is a choice, and the COT index meaning page goes through it, with a COT index calculator beside it. The whole routine, column by column, is on how to read the COT report.
One thing the index cannot tell you: direction. USD/CHF's crowd has an index of 17 this week and is still net long the pair. It is close to the least long it has been, not short.
Why does the yen look backwards, and how old is the data?
The yen looks backwards because the future is quoted the opposite way to the pair, and the data is three days old on the day you get it. These are the two ways the report most often misleads a forex trader.
The inversion trap. Currency futures are priced in dollars per unit of the foreign currency. So long yen futures means short USD/JPY. The Swiss franc and the Canadian dollar work the same way, while the euro, pound, Australian and New Zealand dollars and gold need no turning.
On 28 July 2026 the CFTC's yen row showed large speculators with 101,271 long and 264,683 short: a net short of 163,412 contracts. In the pair's terms that is long USD/JPY by 163,412, which was 37.8% of open interest and an index of 85. A reader who sees "funds short" and sells USD/JPY has joined them, believing he has done the opposite. Every net position and index on this page is already in the pair's terms, and why the yen COT looks backwards sets out all three.
The lag. Friday's report describes Tuesday. On most weeks that gap is quiet, and on some it is everything.
USD/JPY closed that Tuesday, 28 July, at 163.792. On Thursday 30 July it traded a high of 163.738 at 03:45 New York. The 09:30 candle opened at 162.778 and reached 160.279, and the 10:15 candle printed the day's low, 157.963, which was 578 pips under the high. The day closed at 159.514. Our calendar lists no high- or medium-impact release between 08:30 and 18:00 that day, and the Bank of Japan's decision came that night. A chart cannot show who sold or why.
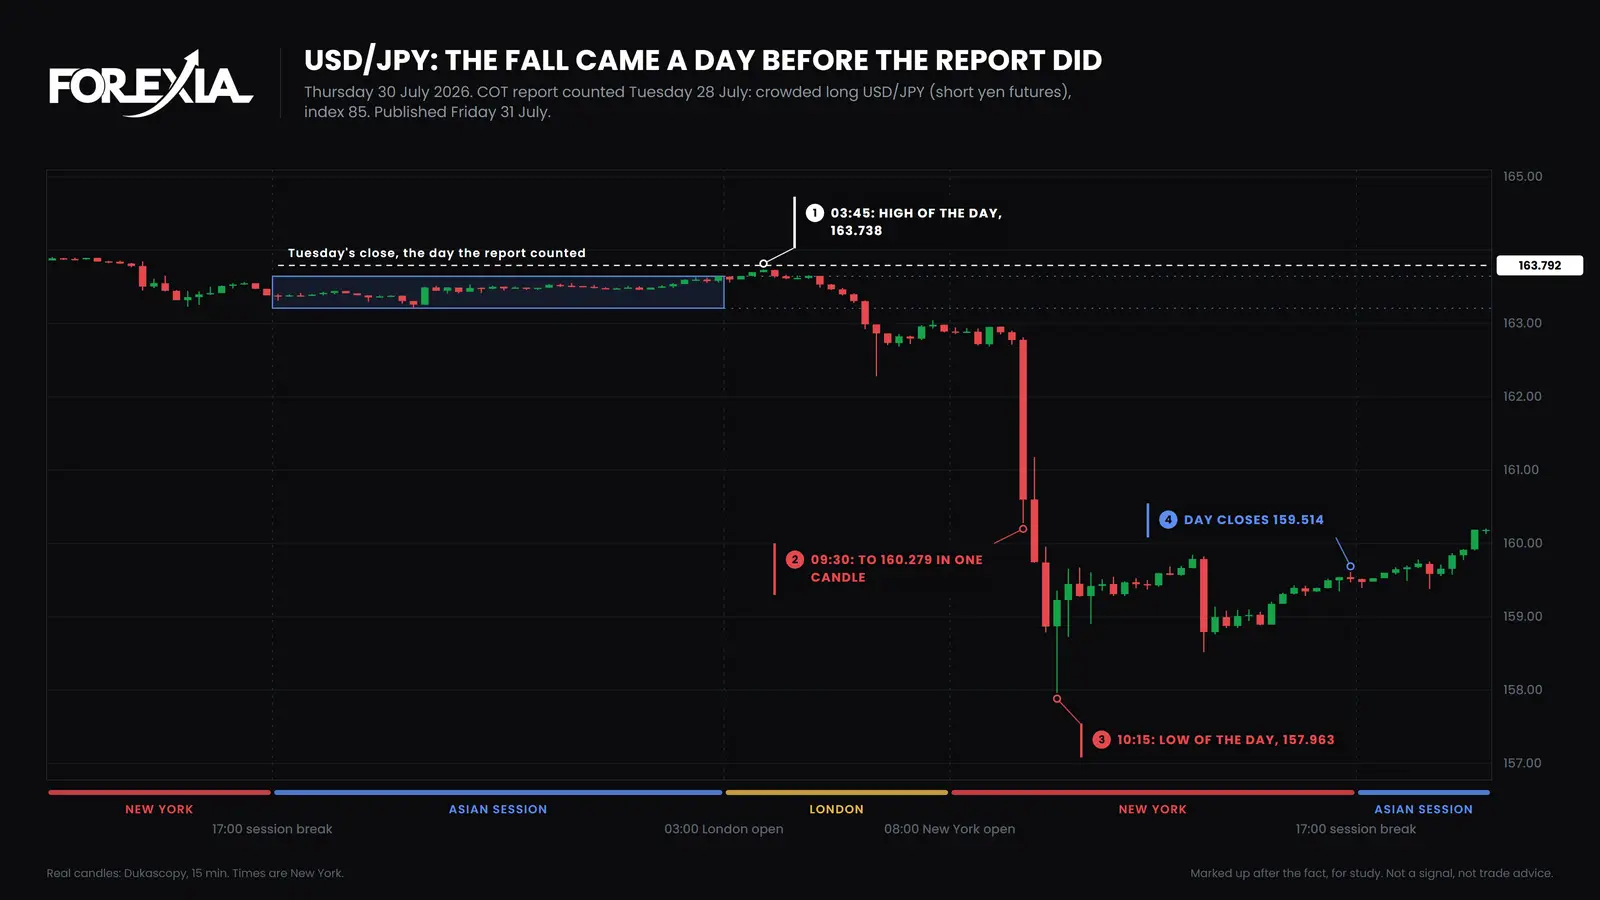
The report came out on Friday 31 July at 15:30, with USD/JPY near 159.04, about 475 pips under Tuesday's close. It said crowded long, index 85. That was true of Tuesday. The next report, counted on 4 August and published on 7 August, showed the net long down to 45,473 contracts, 10.8% of open interest, an index of 59. Almost 118,000 contracts of net position had gone, and readers learned it eight days after the fall.
Nor did the crowded reading say when. The index had been 81 on 23 June, with USD/JPY at 161.544, and price went on rising for five weeks. Both our spokes go further: when the COT report is released has the schedule and is the COT report lagging what the delay costs. A federal holiday can move a release to the following Monday, as with 16 November, 30 November and 28 December in 2026.
What did the COT report show on the seven majors and gold? A real week
This is the report counted on Tuesday 27 October 2026 and published on Friday 30 October. The long and short columns are as the CFTC prints them, in the futures. The net, the share and the index are in the pair's terms.
| Market | Long (futures) | Short (futures) | Net, pair's terms | Share of open interest | Index | Our call |
|---|---|---|---|---|---|---|
| EUR/USD | 230,646 | 374,540 | −143,894 | −16.6% | 0 | Crowded short |
| GBP/USD | 56,645 | 136,059 | −79,414 | −31.3% | 10 | Crowded short |
| USD/JPY (yen futures) | 225,516 | 123,925 | −101,591 | −27.2% | 23 | Not crowded |
| USD/CHF (franc futures) | 26,254 | 46,303 | +20,049 | +14.8% | 17 | Crowded short, still net long |
| AUD/USD | 101,057 | 229,372 | −128,315 | −39.5% | 16 | Crowded short |
| USD/CAD (Canadian dollar futures) | 89,942 | 156,366 | +66,424 | +18.4% | 45 | Not crowded |
| NZD/USD | 18,062 | 75,752 | −57,690 | −44.7% | 14 | Crowded short |
| Gold | 223,724 | 37,273 | +186,451 | +47.0% | 60 | Not crowded |
Read down the index column rather than the net column. The biggest share short is the kiwi at 44.7%, yet the euro at 16.6% is further into its own range. USD/JPY at 23 is near the line and not on it. Gold, at 98 on 25 August, has come back to 60 with most of its long position still held.
Read this as one dated week, not as today's position. The numbers come straight from the CFTC's public feed, so you can check any row. Members read the report week by week, worked out the same way, on our COT Report page, which sits behind sign-in.
What do 20 and 80 mean? Crowded markets on the COT index
At 20 or under, or 80 or over, we call the large speculators crowded, and we read that as the side not to join. Those lines are our choice and no law: other readers use 10 and 90, and the COT extreme page compares them.
From the three seats, the same index reads three ways:
- Retail sees a consensus. If the big traders are that short, price must be going lower.
- The market maker sees orders to come. Our read is that market makers build the chart, and that a short has to be bought back one day, often from a stop above the highs.
- The observer sees a side we would not join, and does not know when, or whether, anything will happen.
Large speculators are funds, not retail, and that is the big difference from Dumb Money. Our reading is that at the ends of their range they behave much the same: they sell after the fall, buy after the rise and sit in the position. Here are two markets, one each way. Both days were picked afterwards, on 15-minute Dukascopy candles in New York time, so your broker may differ by a pip or so. The levels below are the week's high and low, which we read as the biggest pool of stops on the chart.
Crowded short: GBP/USD, Wednesday 14 October 2026
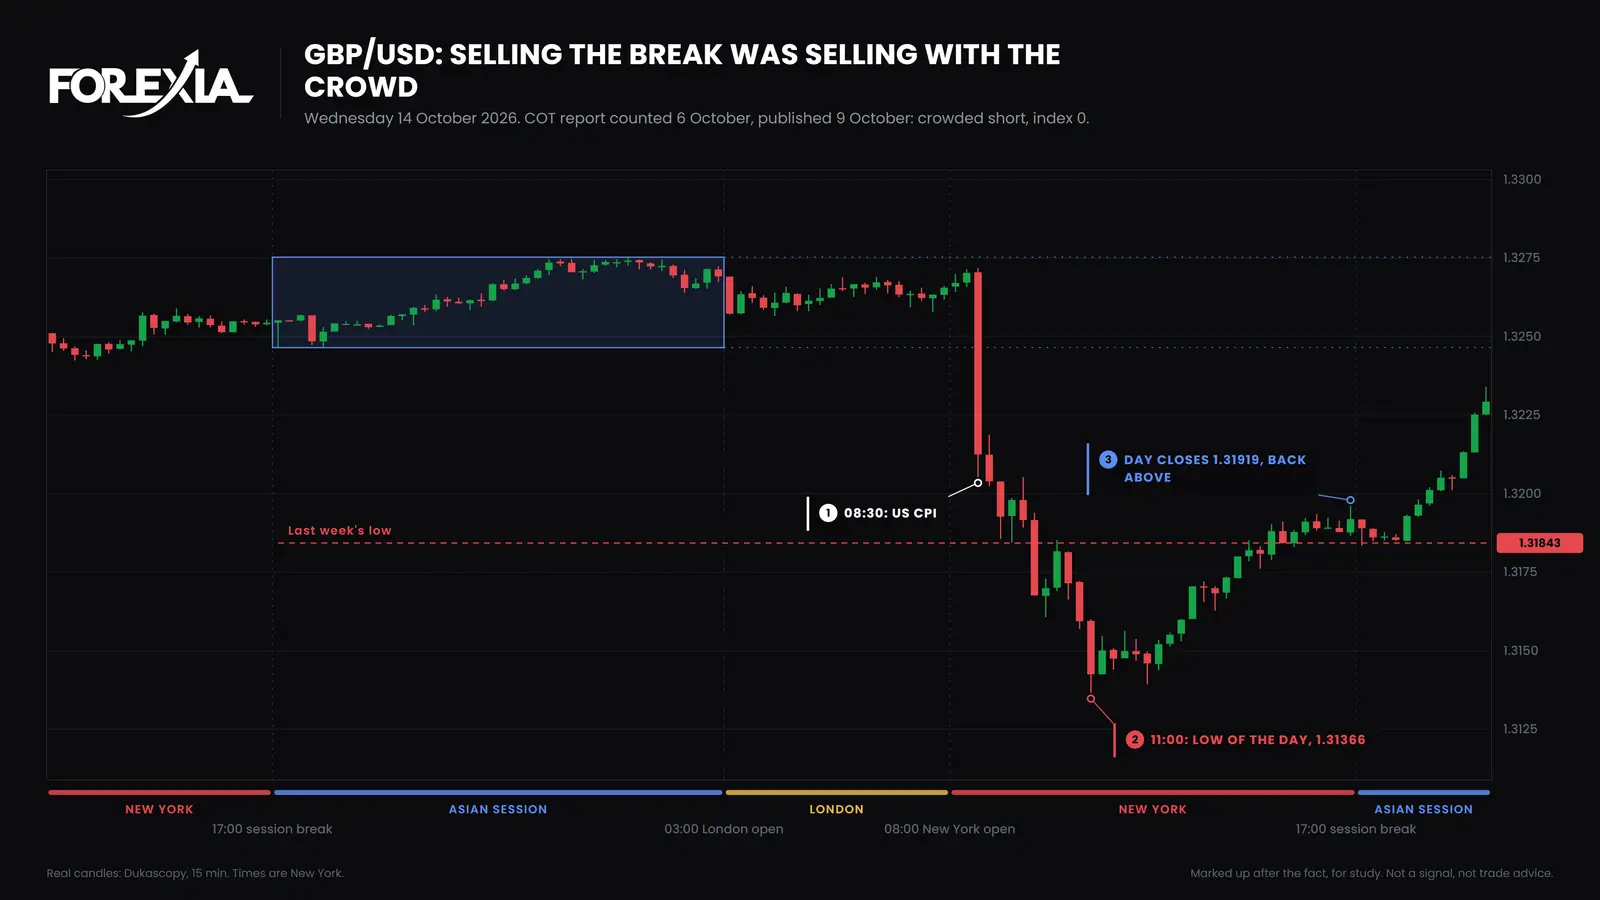
The report counted on 6 October and published on 9 October had large speculators net short the pound by 97,611 contracts, 36.7% of open interest, an index of 0. Last week's low was 1.31843.
US inflation came out at 08:30 on 14 October, and the pound fell from 1.32705. The 09:45 candle went through last week's low, and the 11:00 candle printed the low of the day, 1.31366, 48 pips under it. To a seller that was the breakdown. We read it as the stop hunt, a liquidity sweep of the stops under the level. The day closed at 1.31919, 8 pips back above it: the Close Back.
Whoever sold that break sold with a crowded side, near the low of the week. On Friday 16 October the pound reached 1.33714, 235 pips from the low.
Now the other half of that story. The index was back at 20 on 8 September, with the pound closing at 1.35399. By 6 October it closed at 1.32738, 266 pips lower. For four weeks the crowded side was right, and anyone who bought because the crowd was short was simply early.
Crowded long: gold, Wednesday 26 August 2026
On gold we count $1 as 1 pip. The report counted on 18 August and published on 21 August had large speculators net long 222,189 contracts, 54.7% of open interest, an index of 93. Last week's high was 4631.94.
On Monday 24 August gold reached 4680.65, $49 over it. By Tuesday it had reached 4696.64, $65 over. Anyone buying those new highs was buying alongside a crowded side. US inflation and growth figures came at 08:30 on Wednesday 26 August, and the low of that day, 4582.78, came in the 11:15 candle. The day closed at 4589.97, $42 back under last week's high.
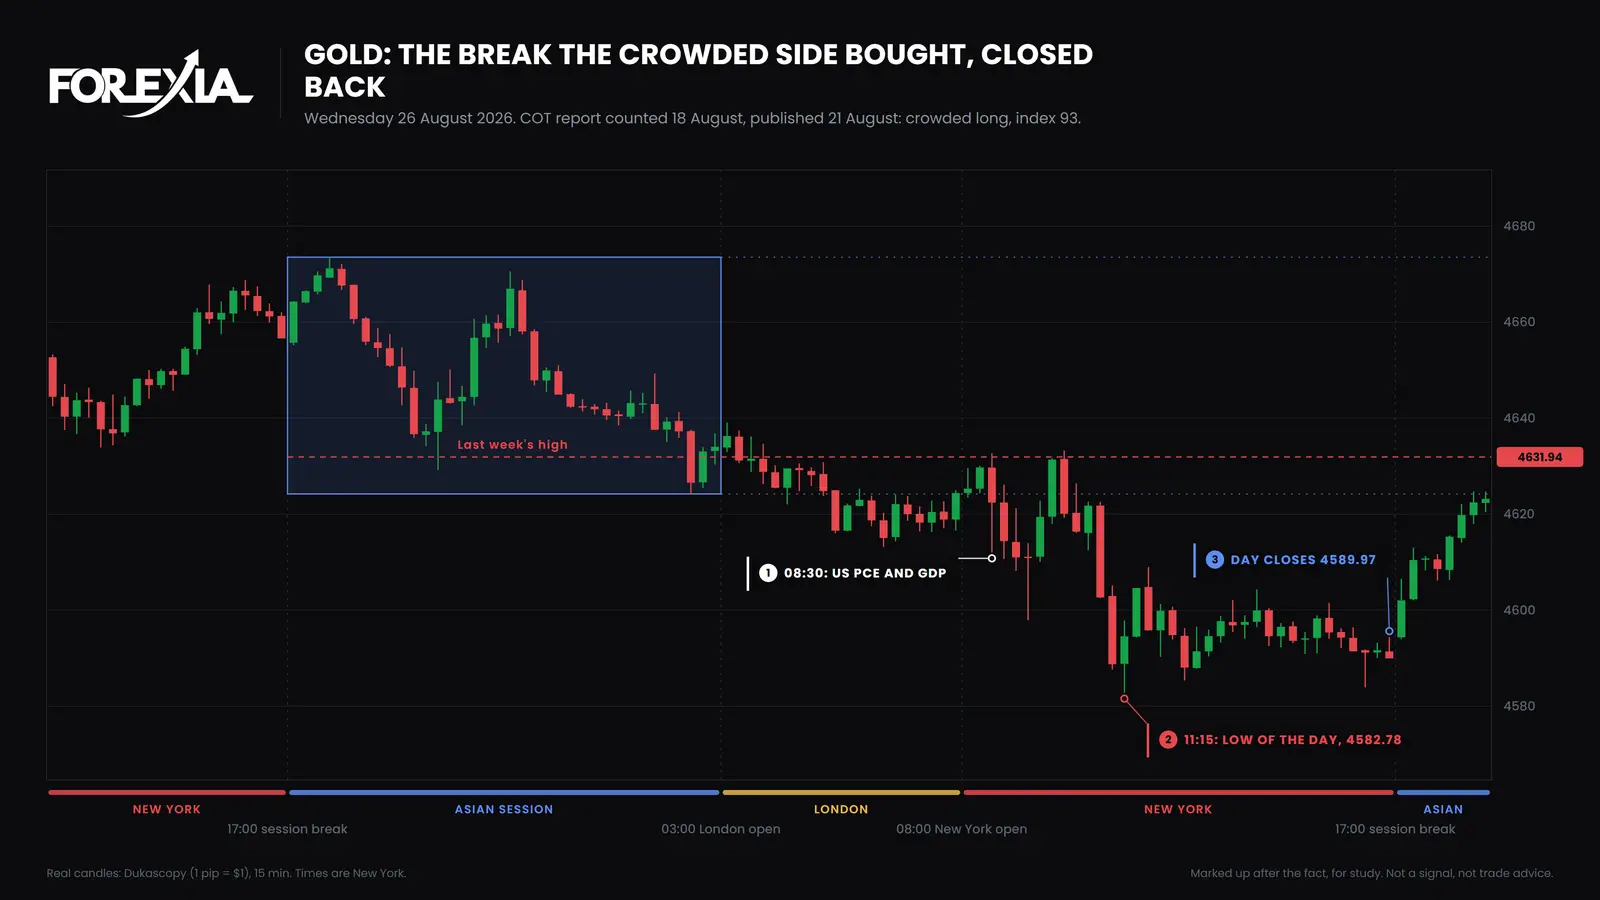
Price went further. Gold printed 4445.20 on Friday 28 August and 4282.03 at 23:30 New York on Tuesday 1 September, $415 under the top. The crowd barely moved. The report counted on 25 August showed 243,334 contracts net long, an index of 98, with gold closing at 4656.63. The one counted on 1 September showed 228,124 net long, an index of 93, with gold closing at 4327.43, $329 lower. So a crowd can stay in a position through a large move against it, and the report says nothing about when that ends.
What crowded does not tell you
These are stories chosen after the fact. A reversal seen afterwards is not a setup, and most weeks nothing like this comes. Crowded is also not rare. Over the 156 reports to 29 September 2026, the eight markets were crowded for between 25% and 58% of the weeks, depending on the market. Those weeks fell into 82 separate runs on the same side, and the median run was 5 weeks. Of those runs, 22 lasted 10 weeks or more, and the longest was 27, on the pound from 17 February 2026. A few are cut short by the edges of the sample.
So a crowded reading rules a side out for you, and that is as far as it goes. It does not say when. Why the crowd's lean is not a trade takes that further.
Does the COT report work? What we tested, and where the figures are
As a description of who holds what, yes. As a trading signal it is thin, and we say how thin on a page of its own. We ran the report as fixed rules over many years of data, once taking trades with the crowd and once against it. In words: trades taken with the crowd mostly lost, and fading it on a level hunt showed a small effect that is promising and not proven.
The figures, sample, costs and caveats are on does the COT report work, and they are kept there so that nobody lifts one number out of its sentence. The stance on this page is a reading of positions. It is not a claim of results.
What the report cannot tell you, whichever way you use it:
- When. It has no clock, as the pound's four weeks and gold's week above both show.
- Why. It counts positions and does not say what they hedge against or what anyone intends.
- The whole market. It covers US futures, not the far larger spot market, so it is a sample and may not represent everyone.
- Today. By the time you read it the count is three days old, and by the next report it is ten.
- Any one person's stops. We read a crowded position as stops resting past the levels. That is an inference. The report holds no stop orders.
COT report by market: EUR, GBP, JPY, AUD, NZD, CAD, CHF and gold
Each market has its own contract and its own habits, and for some of them crowded is close to the normal state. This table counts the large speculators over the 156 reports to 29 September 2026, in the pair's terms, by the formula above. Crowded short is an index of 20 or under, and crowded long is 80 or over.
| Market | CFTC contract and code | Weeks crowded short | Weeks crowded long | Longest run, weeks | Weeks net long the pair |
|---|---|---|---|---|---|
| EUR/USD | Euro FX, 099741 | 28 | 11 | 14 | 118 |
| GBP/USD | British pound, 096742 | 50 | 29 | 27 | 77 |
| USD/JPY | Japanese yen, 097741 | 35 | 31 | 24 | 87 |
| USD/CHF | Swiss franc, 092741 | 0 | 57 | 17 | 156 |
| AUD/USD | Australian dollar, 232741 | 44 | 34 | 17 | 33 |
| USD/CAD | Canadian dollar, 090741 | 9 | 82 | 22 | 149 |
| NZD/USD | New Zealand dollar, 112741 | 74 | 5 | 23 | 23 |
| Gold | Gold, COMEX, 088691 | 1 | 80 | 24 | 156 |
Three things stand out, and they change how far you can lean on the read:
- Gold and USD/CHF never changed sides. The crowd was net long both in all 156 weeks. On a market like that a crowded long is close to its normal state, so we treat the read as weaker there.
- USD/CAD spent 82 of 156 weeks crowded long and was net long in 149. An 80 on the Canadian dollar says less than an 80 on the euro.
- The kiwi leans the other way, crowded short in 74 of 156 weeks and net long in only 23.
Most crosses have no COT report, because most currency contracts are quoted against the dollar. Two do, at the CME: EUR/JPY, code 399741, and EUR/GBP, code 299741. Both were in the report of 27 October 2026, with open interest of 20,282 and 44,966 contracts against 868,188 on the euro, and we do not read them. The US Dollar Index has a contract of its own, code 098662, and it is not the sum of the others.
Course 1 of ForexiaPRO, Reading the Map, teaches this read step by step in its module named Fade the Crowd.
Start here
- What Is the COT Report in Forex, and What It Is Not
What is the COT report in forex? Who it counts, one real week on the euro and gold, why it rests on futures, and the four things it cannot tell you.
How it works
- COT Report Strategy: Why the Crowd's Lean Is Not a Trade
A COT report strategy starts by not joining a crowded side. What an extreme tells you and what it cannot, on two real reports: EUR/USD and gold in 2026.
- COT Index Meaning: What a Crowded Side at 20 or 80 Tells You
COT index meaning: where large speculators stand in their own range, 0 to 100. One week worked four ways, and gold at 80 on one formula, 42 on another.
Real days
- COT Report Gold: Reading the Week Published 16 October 2026
The COT report for gold, counted 13 October 2026: legacy against managed money, the crowd's stance, the levels, and what gold did in the next two weeks.
- COT Report EUR/USD: The Crowd at Index 0 and One Level Under It
The COT report EUR/USD counted 13 October 2026: the crowd at index 0, who sat on the other side, one level under the market, and what the euro did next.
Questions
- How to Read the COT Report: One Real Row, From the Feed to the Index
How to read the COT report on one real row: every column, the sums, the 0 to 100 index, how many traders the crowd really is, and what price did next.
The words
- Fade the Crowd: What the COT Report for Forex Rules Out, and What It Cannot Tell You
Fade the Crowd is the COT read that you never trade with crowded large speculators. EUR/USD at index 18, July 2026, and what the report cannot say.
Frequently asked questions
What is the Commitment of Traders report?
The Commitment of Traders report, or COT report, is the weekly count by the US Commodity Futures Trading Commission of who holds long and short positions in each futures market. It sorts the holders into groups. It covers regulated US futures, not the spot forex market or your broker's clients, and it describes positions rather than predicting price.
When is the COT report released?
Usually on Friday at 15:30 New York time, with positions counted on the Tuesday of that week. A federal holiday can delay it, and for that reason the CFTC's schedule for 2026 moves three reports to a Monday: 16 November, 30 November and 28 December.
How do you read the COT report for forex?
Find the currency's futures contract, take the large speculators' long and short columns, and subtract to get the net position. Divide by open interest, then compare that share with its own range over a set period. We use three years. Turn the yen, franc and Canadian dollar round first, because those futures are quoted the opposite way to the pair.
What is the COT index?
It is where a group's position sits in its own past range, from 0, the most short in that period, to 100, the most long. There is no official version: the CFTC does not publish one. We use net position as a share of open interest over 156 weeks. Other tools use raw contracts or a shorter period, so their numbers differ from ours.
Which COT report is best for forex: legacy, disaggregated or TFF?
Disaggregated does not cover currencies, so the choice is legacy or Traders in Financial Futures. TFF names the groups more precisely: dealers, asset managers and leveraged funds. Legacy has simple groups and covers gold as well, which TFF does not. We use legacy's large speculators so that one group means the same thing on all eight markets.
Why does the yen COT look backwards?
Because yen futures are priced as dollars per yen, the opposite of USD/JPY. Long yen futures is short USD/JPY. So on 28 July 2026 the report showed large speculators net short 163,412 yen contracts, and that was a long position on the pair. The Swiss franc and Canadian dollar futures have the same trap.
Does the COT report work for trading forex?
It works as a description of who holds what. As a trading signal it is much weaker than most guides imply, and a crowded reading can last for months. We tested trading with the crowd and against it, and the figures and their caveats are on our research page, Does the COT Report Work. Fading the crowd was promising, not proven.
Is the COT report lagging?
Yes. By publication the positions are three days old, and by the next release they are ten days old. On 30 July 2026 USD/JPY fell 578 pips from its high in one day, between the Tuesday count and the Friday release. So the report that came out that Friday showed the position before the fall.
Where can I find COT data?
At the source: the CFTC publishes every report on its Commitments of Traders page, and its public reporting site serves the same data as a feed that a script can read, with one dataset for each report type. Reports come in futures-only and combined versions, in short and long formats. Charting sites and brokers republish the same numbers.
What is a non-commercial trader in the COT report?
Non-commercial is the legacy report's label for a reportable trader who is not using those futures to hedge. Traders call the group large speculators: hedge funds and other big traders betting on direction. They are not retail. Positions too small to report, which is where most retail futures traders sit, fall in the nonreportable group.
What does spreading mean in the COT report?
Spreading measures how far each non-commercial trader holds equal long and short futures positions in the same market. A trader long and short in different contract months has little bet on direction, so it is kept in its own column. We leave spreading out of the net position, which is long minus short.
Is there a COT report for gold or for forex crosses?
Gold has one: contract code 088691 on COMEX, in the legacy and disaggregated reports but not in TFF. In the 156 reports to 29 September 2026, large speculators were net long gold every single week. Most crosses have no report, because most currency futures are quoted against the dollar. The CFTC does list two at the CME, EUR/JPY and EUR/GBP. Both were in the report of 27 October 2026, and both are thin: open interest of 20,282 and 44,966 contracts, against 868,188 on the euro.
The latest chart markups
- Reverse Price Action: How to Read a Forex Chart Markup
Reverse price action reads a chart from the side of the crowd: where retail orders and stop losses sit, and how price collects them. A visual guide.
- Forex Chart Markups: Weekly Stop Hunt & Reversal Archive
Forex chart markups, week by week: stop hunts, M and W formations and midweek reversals on the majors and gold, drawn on real candles.
- EURUSD Stop Hunt: Forex Chart Markups, 28 September 2026
An EURUSD stop hunt through Tuesday's high on US PCE data completed an M formation and fell 165 pips. Chart markups, 28 September 2026.