What Is the COT Report in Forex, and What It Is Not
Dylan Forexia8 min read
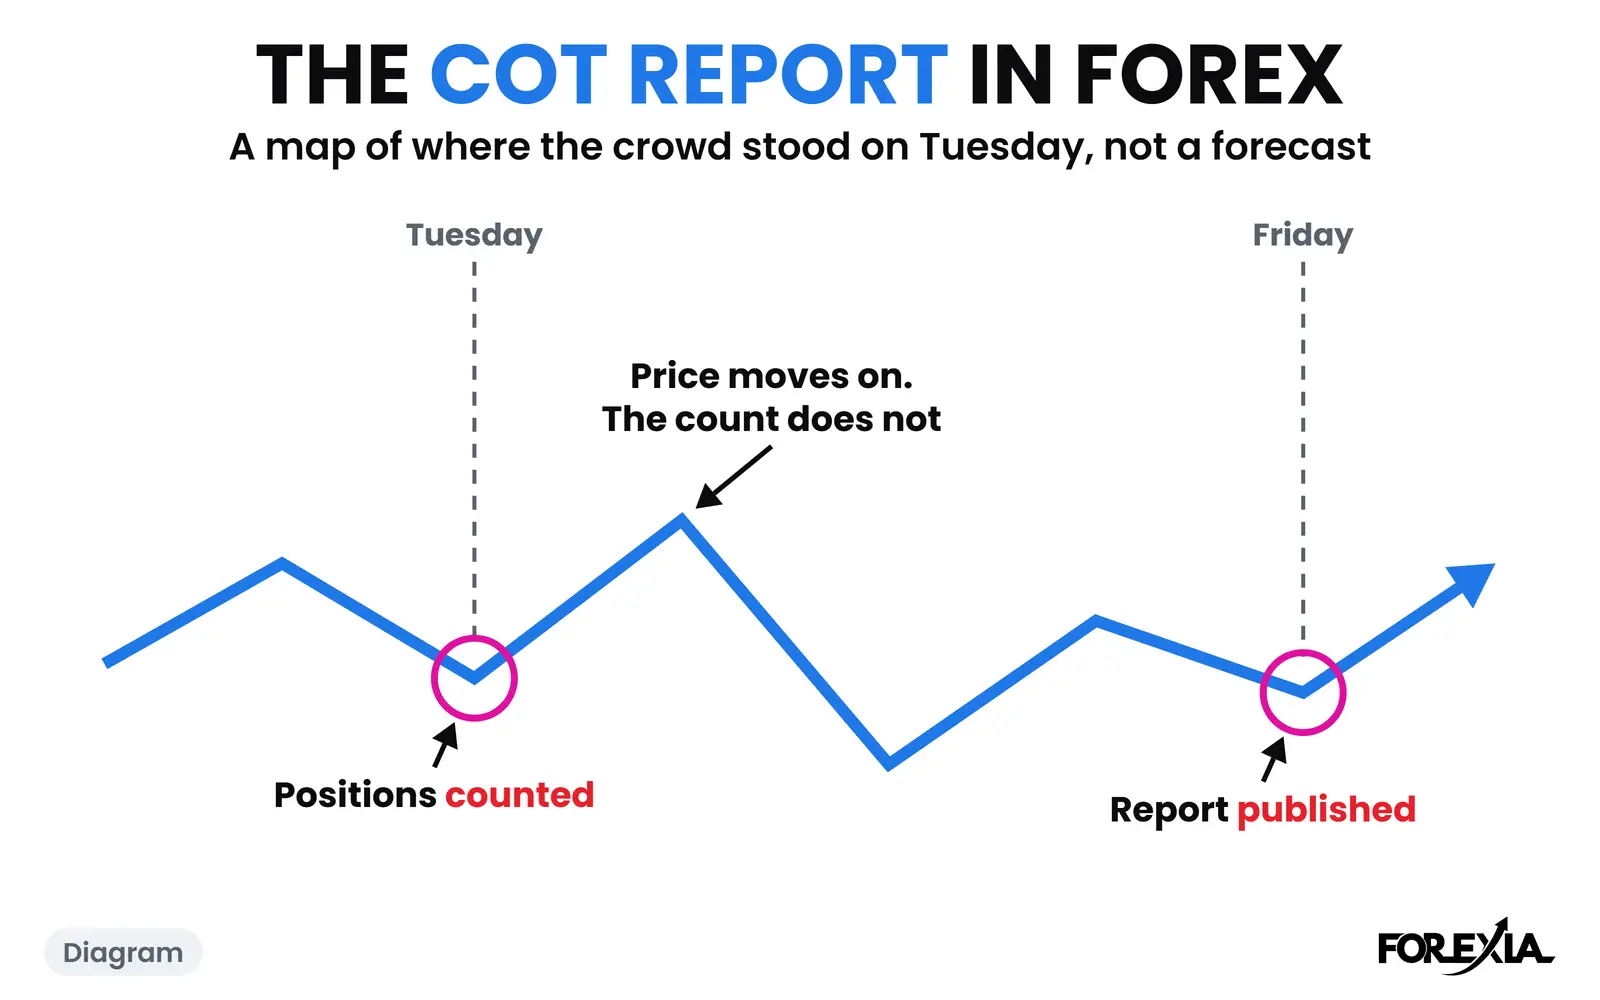
The COT report in forex is a weekly count by the US Commodity Futures Trading Commission of who holds currency and gold futures. Positions are counted on Tuesday and published on Friday at 15:30 New York time. Forex traders read it for one group, the large speculators. It records how they stood on that Tuesday, and nothing about the days after.
This page is the short version, on one real week. The full guide to the Commitment of Traders report covers the report types and the history of the numbers.
What is the COT report in forex, exactly?
It is a table of positions in US futures, sorted by type of trader, and it covers a spot trader only by inference. There is no COT report for spot EUR/USD or for your broker's clients. What exists is the CFTC's report on Euro FX futures at the Chicago Mercantile Exchange, and on the other currency contracts and gold.
So keep the size in mind. A Euro FX contract is 125,000 euros. On 13 October 2026 open interest, every contract not yet closed, was 874,541, which is about 109 billion euros at face value. The BIS's April 2025 survey put spot foreign exchange at $3 trillion a day across all currencies. The report is a large and regular sample of big traders. It is a sample of a different market from the one on your chart.
Each row sorts the holders into groups, and there are two ways it does this for currencies. We use the older legacy report, because its groups mean the same on every market, gold included. Legacy, disaggregated and TFF has the comparison.
Who are the large speculators in the COT report?
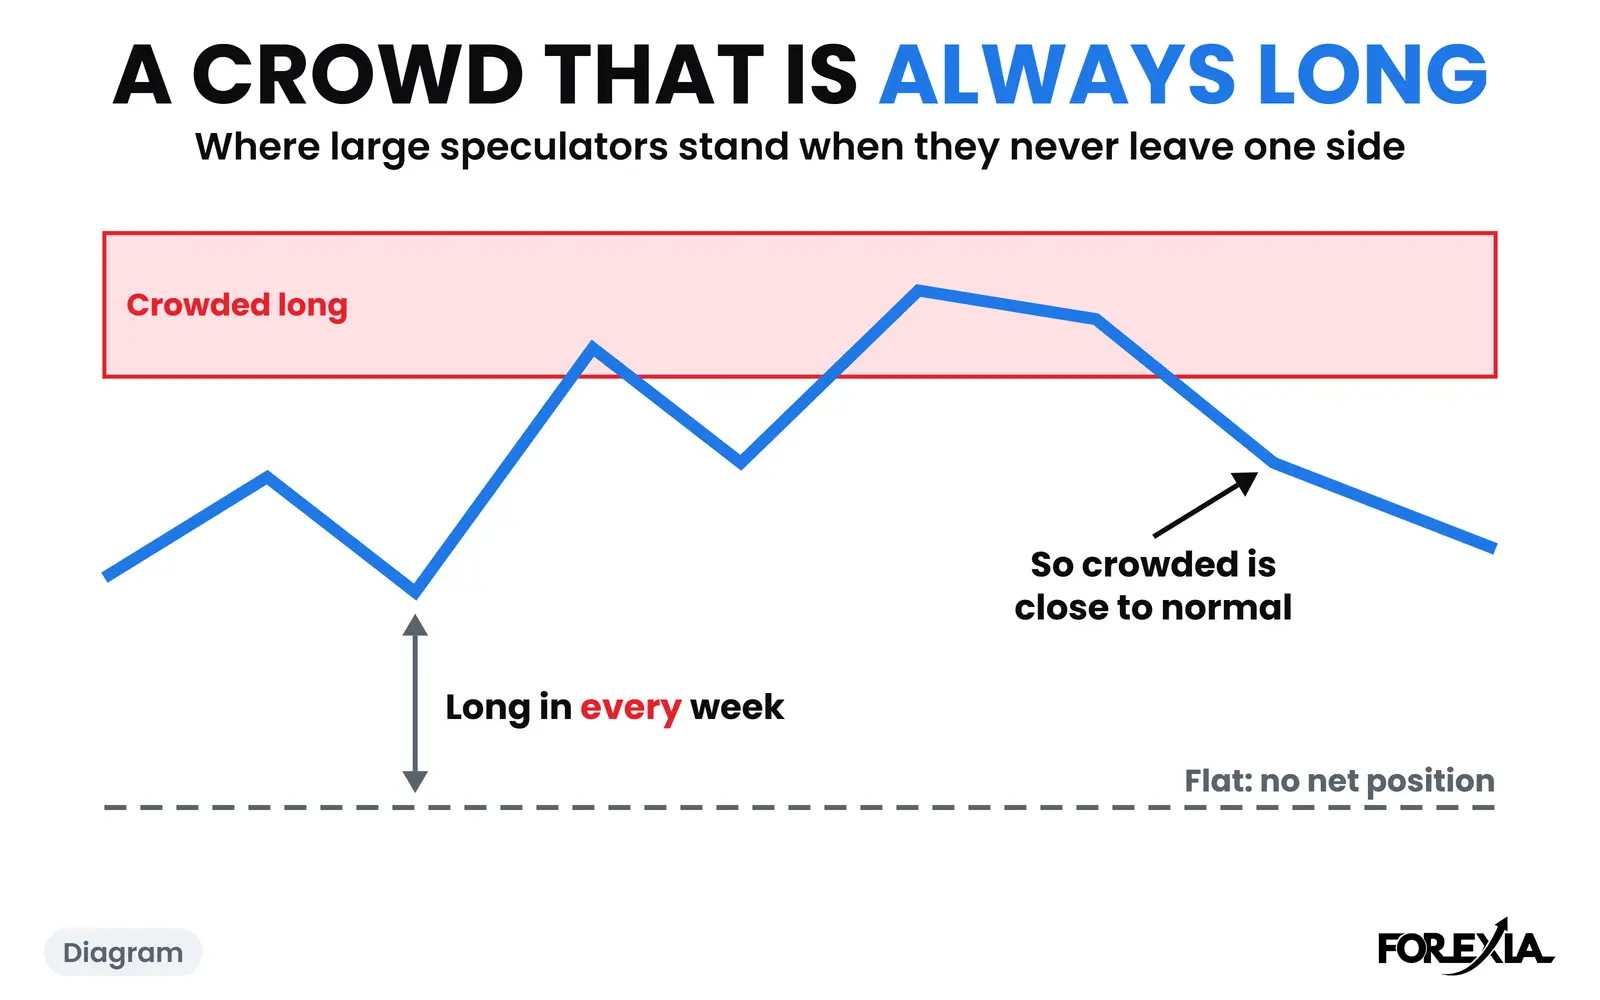
They are the traders the legacy report labels non-commercial: hedge funds and other big traders betting on direction. On our page they are the crowd. They are not retail, and that is the first thing most guides leave blurred. At the ends of their own range, our reading is that they behave the way retail does: they sell after the fall, buy after the rise and sit in the position.
Here are all three legacy groups on the euro, counted on Tuesday 13 October 2026.
| Group | What it is | Net position, contracts |
|---|---|---|
| Non-commercial | Large speculators, the crowd | −137,573 |
| Commercial | Hedgers | +111,225 |
| Nonreportable | Traders too small to report | +26,348 |
Add the column up and you get zero. Every long has a short, so a crowd can only be short if somebody else is long. That is why a position is worth reading at all: it tells you who is on which side, and how far each has gone.
The speculators' net came from two legs, 222,929 contracts long and 360,502 short. A third column, spreading, is traders holding equal long and short futures, and we leave it out.
What did one real report say? The week of 13 October 2026
It said two different things about two markets, which is the reason to read more than a headline. This report was counted on Tuesday 13 October and published on Friday 16 October.
| Market | Long | Short | Net | Share of open interest | Index |
|---|---|---|---|---|---|
| EUR/USD | 222,929 | 360,502 | −137,573 | −15.7% | 0 |
| Gold | 245,300 | 37,421 | +207,879 | +52.4% | 80 |
Gold's crowd looks like the extreme one. More than half of all gold contracts open sits on its net position. Yet it has been net long gold in every one of the last 156 reports, so being long says nothing new. The euro's 15.7% looks small, and it is the most short that crowd has been in three years.
The last column settles it. The index sets each share against that market's own 156 weeks: 0 is the most short, 100 the most long. What the COT index means goes through the sum and where it can mislead. At 20 or under, or 80 or over, we call the crowd crowded, and we read that as the side not to join. That read has a name, Fade the Crowd.
So the two rows read: the euro's crowd is all the way to one side, having added 124,509 short contracts in four weeks while the euro fell 3.0%. Gold's is near the long end, and was at 96 four weeks earlier.
When is the COT report released, and what happens in between?
It comes out on Friday at 15:30 New York time, describing Tuesday, and a holiday can push it back. The release schedule has the dates. What matters for reading it is what those three days can hold.
The count was taken at the end of Tuesday 13 October, with the euro closing at 1.11983. On Wednesday, US inflation data came at 08:30, and that one candle ran from 1.11973 down to 1.11324. By 11:00 the euro was at 1.11128, 48 pips under the low of the week before. It ended the day at 1.11556.
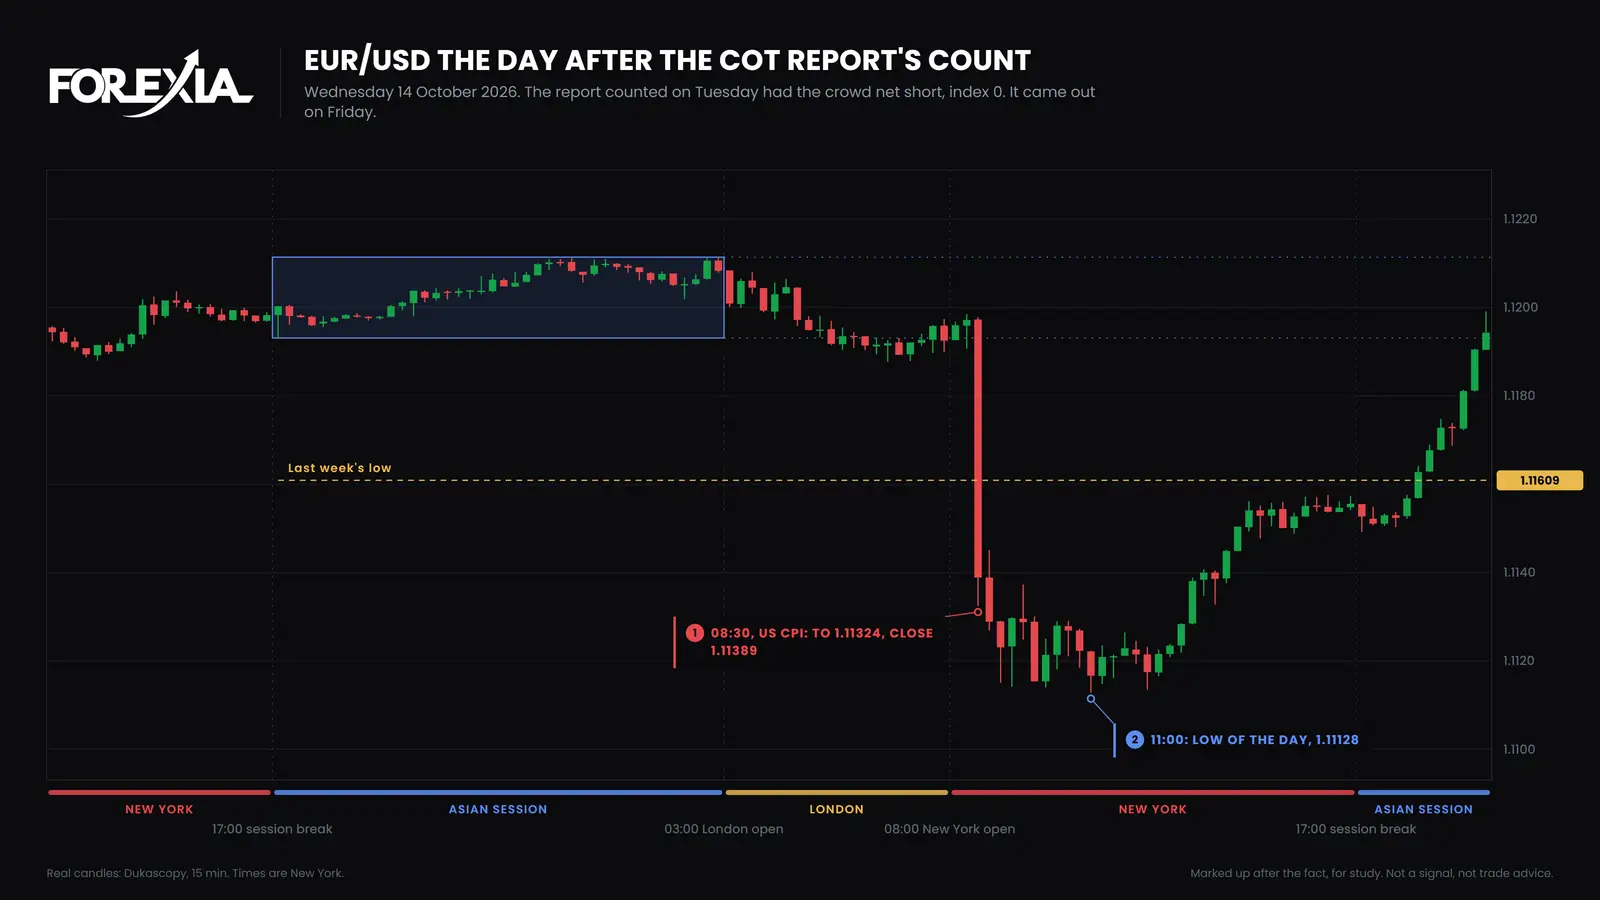
Friday's report knew none of that. It showed the crowd short as of Tuesday, and a reader on Friday evening was looking at a map of a morning already gone. Is the COT report lagging sets out what that delay can cost.
Publication itself is no event on the chart. On Friday 16 October gold traded a $52 range, from 4147.05 to 4198.82. The candle holding the 15:30 release had a range of $4, and closed at 4168.81.
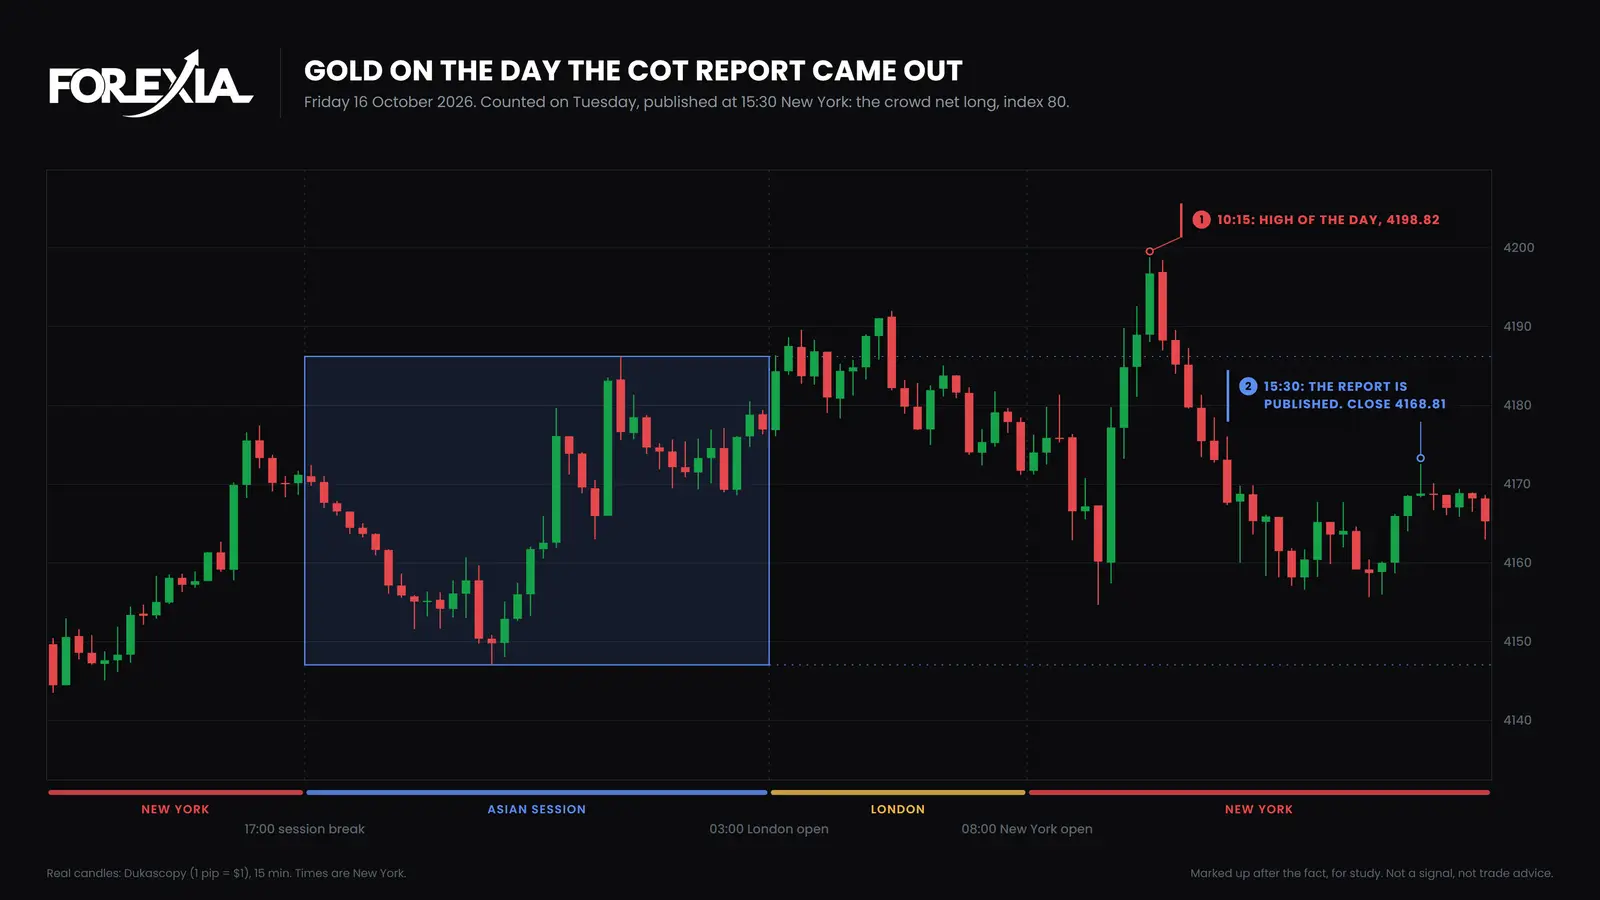
That is one Friday on one market, so it proves nothing general. It does show what kind of thing this is: something to read over a weekend, not a release to trade like the inflation figure.
What is the COT report not?
It is a description of positions, and four things people ask of it are outside what it can do.
- Not a forecast. Funds short does not mean price falls, or rises. Through the summer of 2026 the euro's crowd stayed short while price went first against it, then with it, and Fade the Crowd has that run on the chart.
- Not a clock. A crowded side can stay crowded for months. The full guide counts how long those runs last.
- Not today. The count is three days old when you get it and ten days old when the next one arrives.
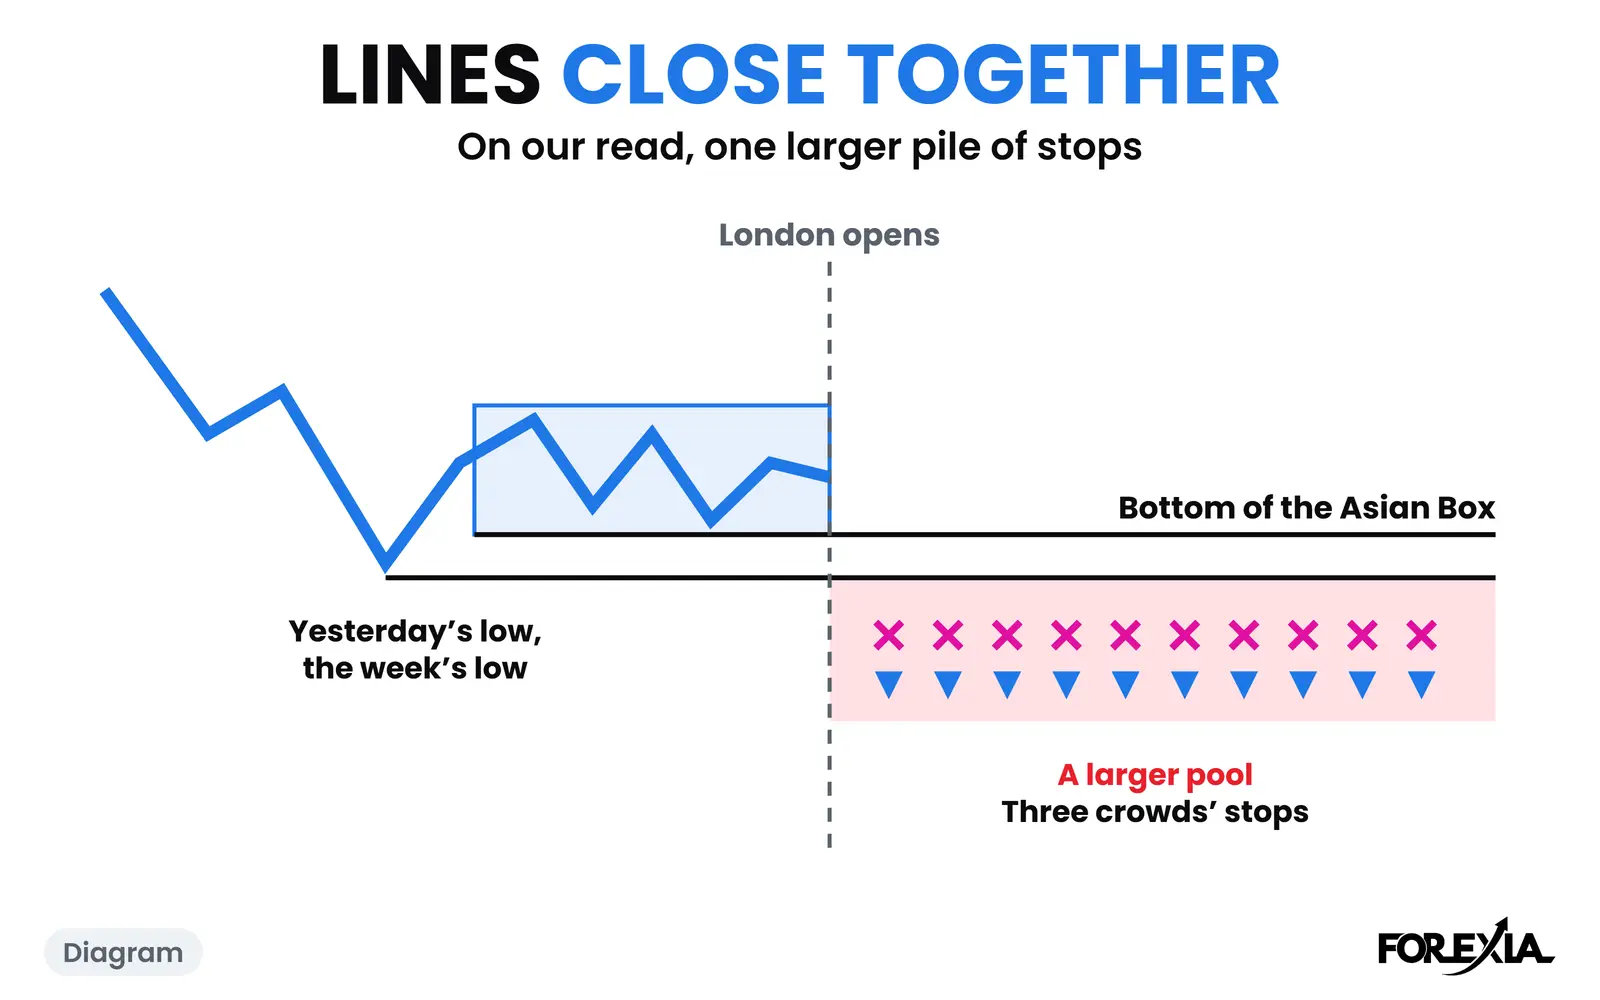
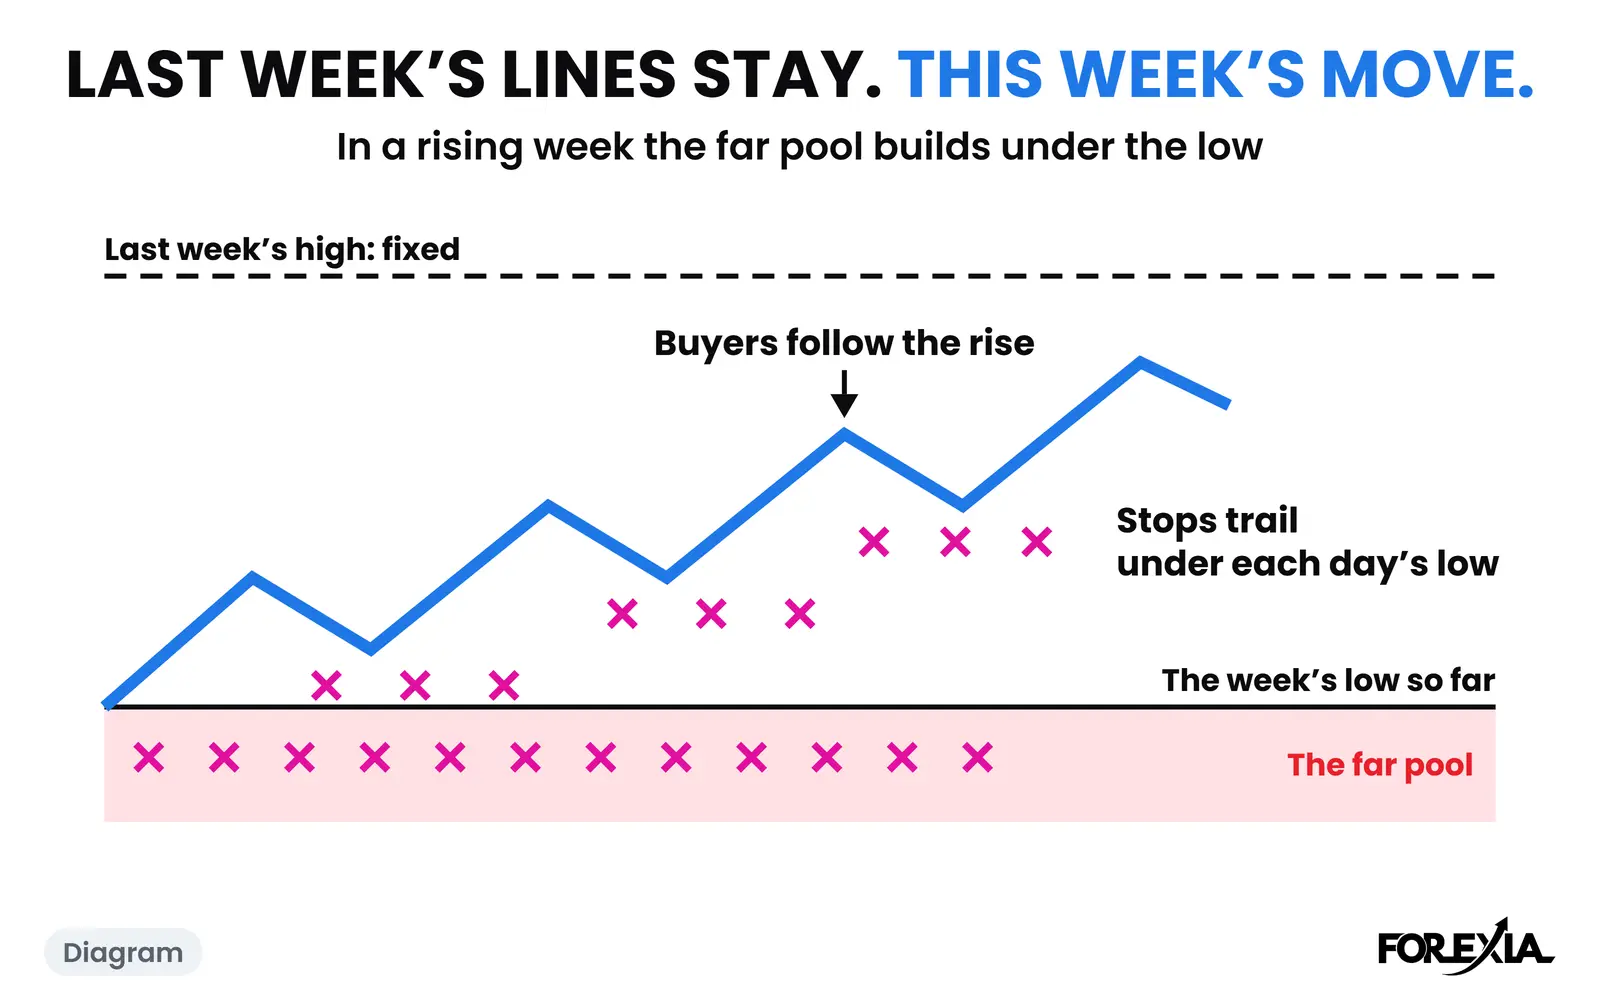
- Not a list of stops. We read each short as a stop resting above the highs, and each long as a stop under the lows. That is an inference. The report holds no stop orders.
Whether anyone can make money from it is a separate question, and we tested it. The figures and their caveats are on does the COT report work. In words, it is much weaker as a signal than most guides imply.
What does each seat read in the COT report?
The same row reads three ways, depending on which of the three seats you take.
- Retail sees a headline: funds are short the euro, so sell the euro. That joins the crowd at the end of its range.
- The market maker, as we read it, sees a list of traders who will have to buy back: every short is a buy order waiting.
- The observer sees a map, three days old, of where one crowd stood on 13 October. By Wednesday's 08:30 candle the market had already moved on from it.
The first seat is where Dumb Money sits, and large speculators are not that group. Our reading is only that a crowd at its extreme trades the same way.
What mistakes do new readers make with the COT report?
Four come up again and again, and each has a real number behind it.
- Expecting index 0 to say what came next. The euro's crowd stood at 0 on 13 October. The euro traded up to 1.12694 that Friday and closed at 1.11245 two weeks after the count, with the crowd at 0 again.
- Being impressed by gold's 207,879 contracts. The number sounds enormous. Against gold's own three years it was 80, right on our line and not past it.
- Forgetting which way the contract is quoted. Yen, franc and Canadian dollar futures run opposite to the pair, so a short in the column is a long on your chart. Why the yen COT looks backwards sets that out.
- Comparing two sites' numbers. The index is not official. Other tools use a different window or raw contracts, and a COT index calculator among our tools lets you see the working.
To check any figure here yourself, the CFTC's public feed serves every row, and members read each week on our COT Report page.
Course 1 of ForexiaPRO, Reading the Map, teaches this read step by step in lesson 1.3.1, What the COT Report Is, and What It Is Not.
Frequently asked questions
What does COT stand for in forex?
Commitments of Traders. It is a weekly report by the US Commodity Futures Trading Commission that counts who holds long and short positions in each futures market. Forex traders read the currency and gold rows, because they are the one regular official count of how big traders are placed in those markets.
Does the COT report include retail forex traders?
No. It counts US futures only, so a retail account at a spot forex broker appears nowhere in it. Its small-trader group, called nonreportable, is futures traders below the size the CFTC requires to be reported. The large speculators we follow are funds and other big traders, not retail.
Can the COT report predict the price?
No. It says where a group of traders stood on Tuesday. On 13 October 2026 the euro's large speculators were the most short in three years, and that fact did not say whether the euro would rise or fall next. Our own tests, with their caveats, are on our research page, Does the COT Report Work.
What is the difference between net position and the COT index?
The net position is what a group holds: its long contracts minus its short contracts. The index says whether that is a lot for them, by setting it against their own three-year range from 0 to 100. Gold's crowd was net long 207,879 contracts at an index of 80 on 13 October 2026.