
Reverse Price Action: How to Read a Forex Chart Markup
Forexia Academy
Reverse price action is a way of reading a chart from the other side of the trade. Instead of asking where price is going, you ask where retail traders have placed their orders, and you expect price to go and collect them first. Every Forexia chart markup is built on that one idea. This guide explains how we know where the orders are, what each mark on a chart means, and how to read the daily and weekly setups in the weekly forex chart markups.
What reverse price action means
Standard price action teaches a set of rules. Buy the breakout of resistance. Sell the breakdown of support. Trade with the trend. Put your stop loss just beyond the most recent high or low. Millions of traders learn the same rules from the same courses, so they act at the same prices.
Reverse price action takes those rules and reads them backwards. It is reverse psychology applied to a chart. If you know what the crowd has been taught to do at a level, you know which orders are sitting there, and the market makers who fill those orders need that liquidity to move size. The textbook pattern is not a signal to follow. It is a map of who is about to be trapped.
How we know where the orders are
There is no public order book for spot forex, and we do not need one. Retail education puts the orders in the same places every time:
- Above a high: the stop losses of everyone who sold, and the buy orders of everyone waiting for a breakout.
- Below a low: the stop losses of everyone who bought, and the sell orders of breakdown traders.
- Either side of the Asian range: the overnight consolidation is where retail marks support and resistance, so both edges collect stops.
- Beyond the previous day's high or low: the most obvious levels on any chart.
- Above a first leg or under a neckline: where traders who took the first move protect themselves.
When price reaches one of those levels, both groups are filled in the same moment: stops are triggered and breakout orders are executed. That burst of orders is the liquidity. If price reverses straight after, the breakout was the trap. We call that a stop hunt, and the whole method is about learning to stand on the other side of it.
The parts of a chart markup
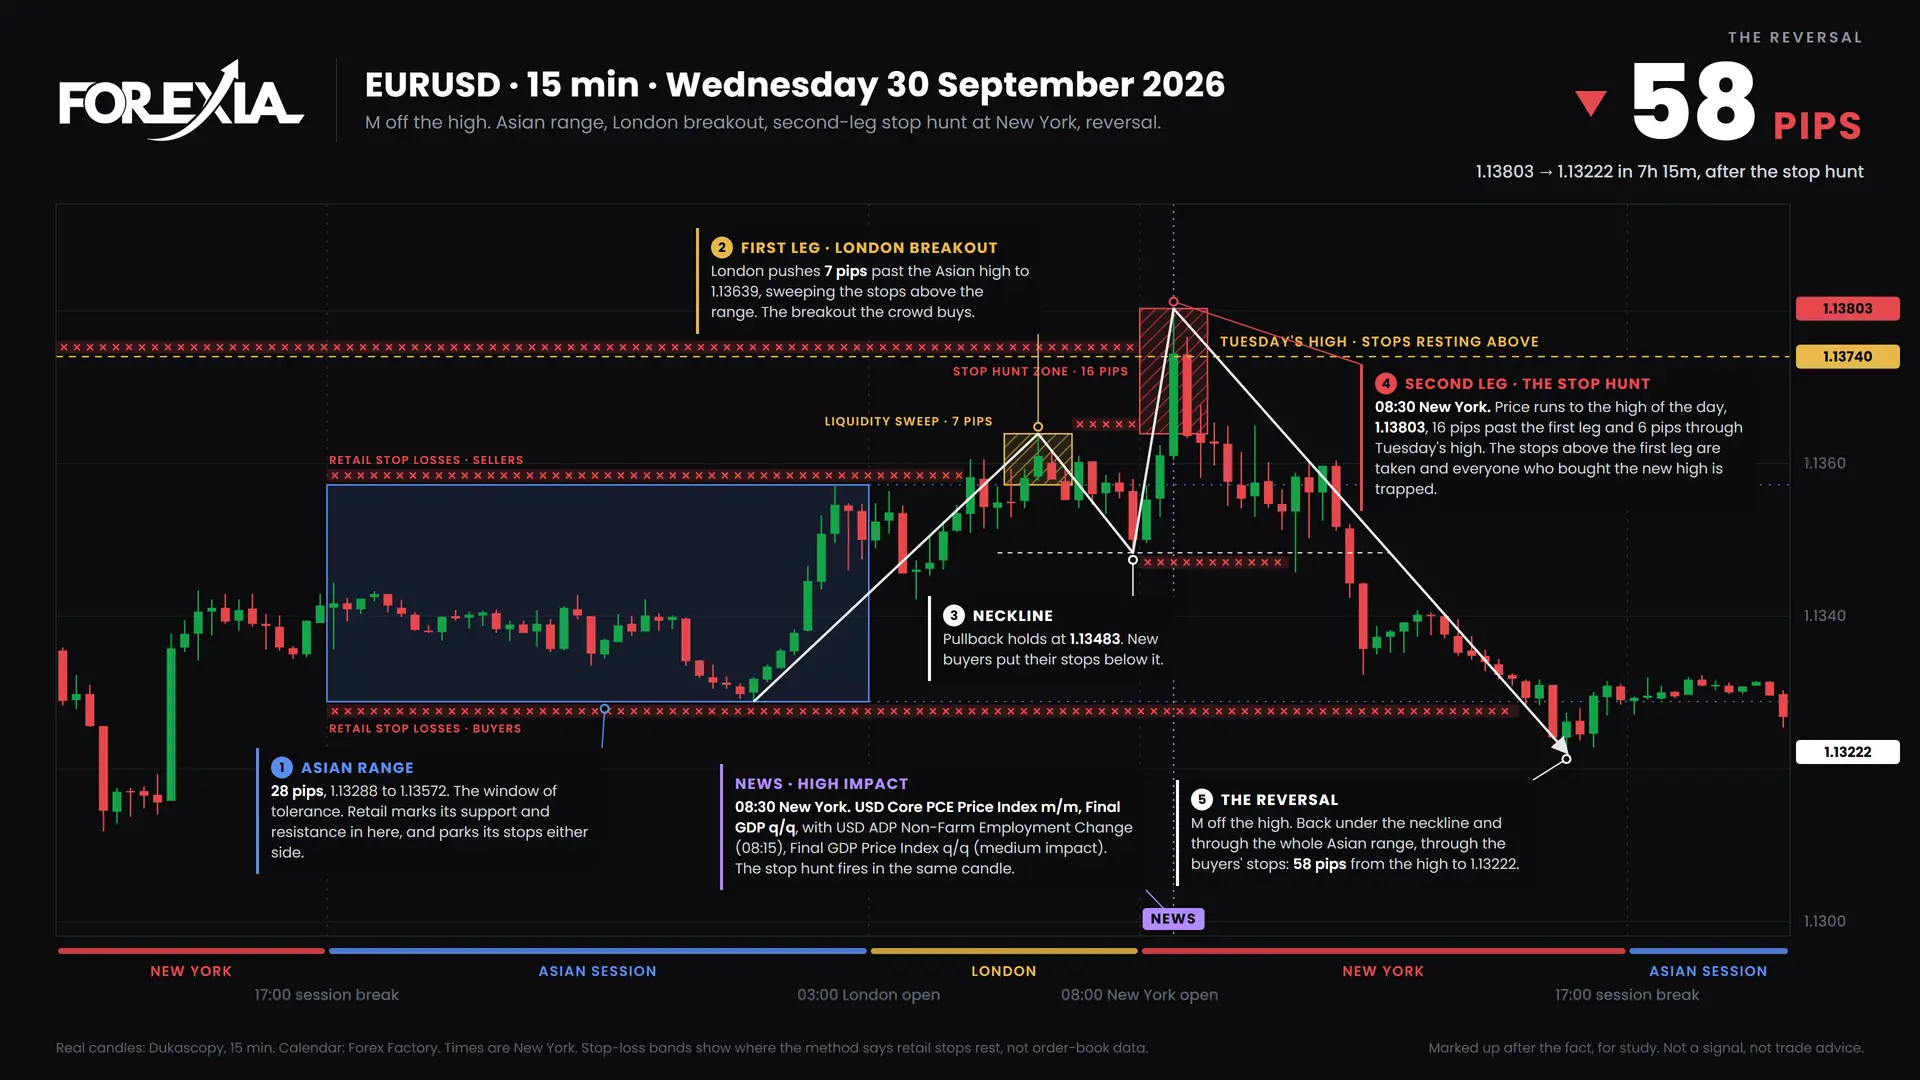
This is the EURUSD M formation from the week of 28 September 2026. Every markup uses the same marks:
- The pips figure (top right): how far the reversal ran, with the start and end prices and how long it took.
- Asian range (blue box): the consolidation from the 17:00 New York session break to the London open. The window of tolerance.
- Retail stop losses (red crosses): where the method says stops are resting. Each band ends at the candle that takes it.
- Liquidity sweep (gold hatch): the first leg taking the stops beyond the Asian range.
- Stop hunt zone (red hatch): the final push to the high or low of the day, past the level that was holding the stops.
- Neckline (dashed line): the pullback between the two legs of an M or W.
- NEWS marker (violet): an economic release that lines up with the move, with its name and impact.
- Session bar (bottom): Asian, London and New York, in New York time.
The stop-loss bands are a reading of the structure, not order-book data. There are no indicators on any chart: candles and structure only.
The daily setups: M formation, W formation and the stop hunt
The daily cycle has three parts. Asia consolidates, London breaks out, and the reversal comes in London or New York. These are the three ways it shows up on the 15-minute chart.
M formation, off the high
Price breaks above the Asian range (the first leg), pulls back to a neckline, then pushes slightly above the first leg. That second leg is the stop hunt: it takes the stops above the first high and fills the breakout buyers. The chart above is an M.
W formation, off the low
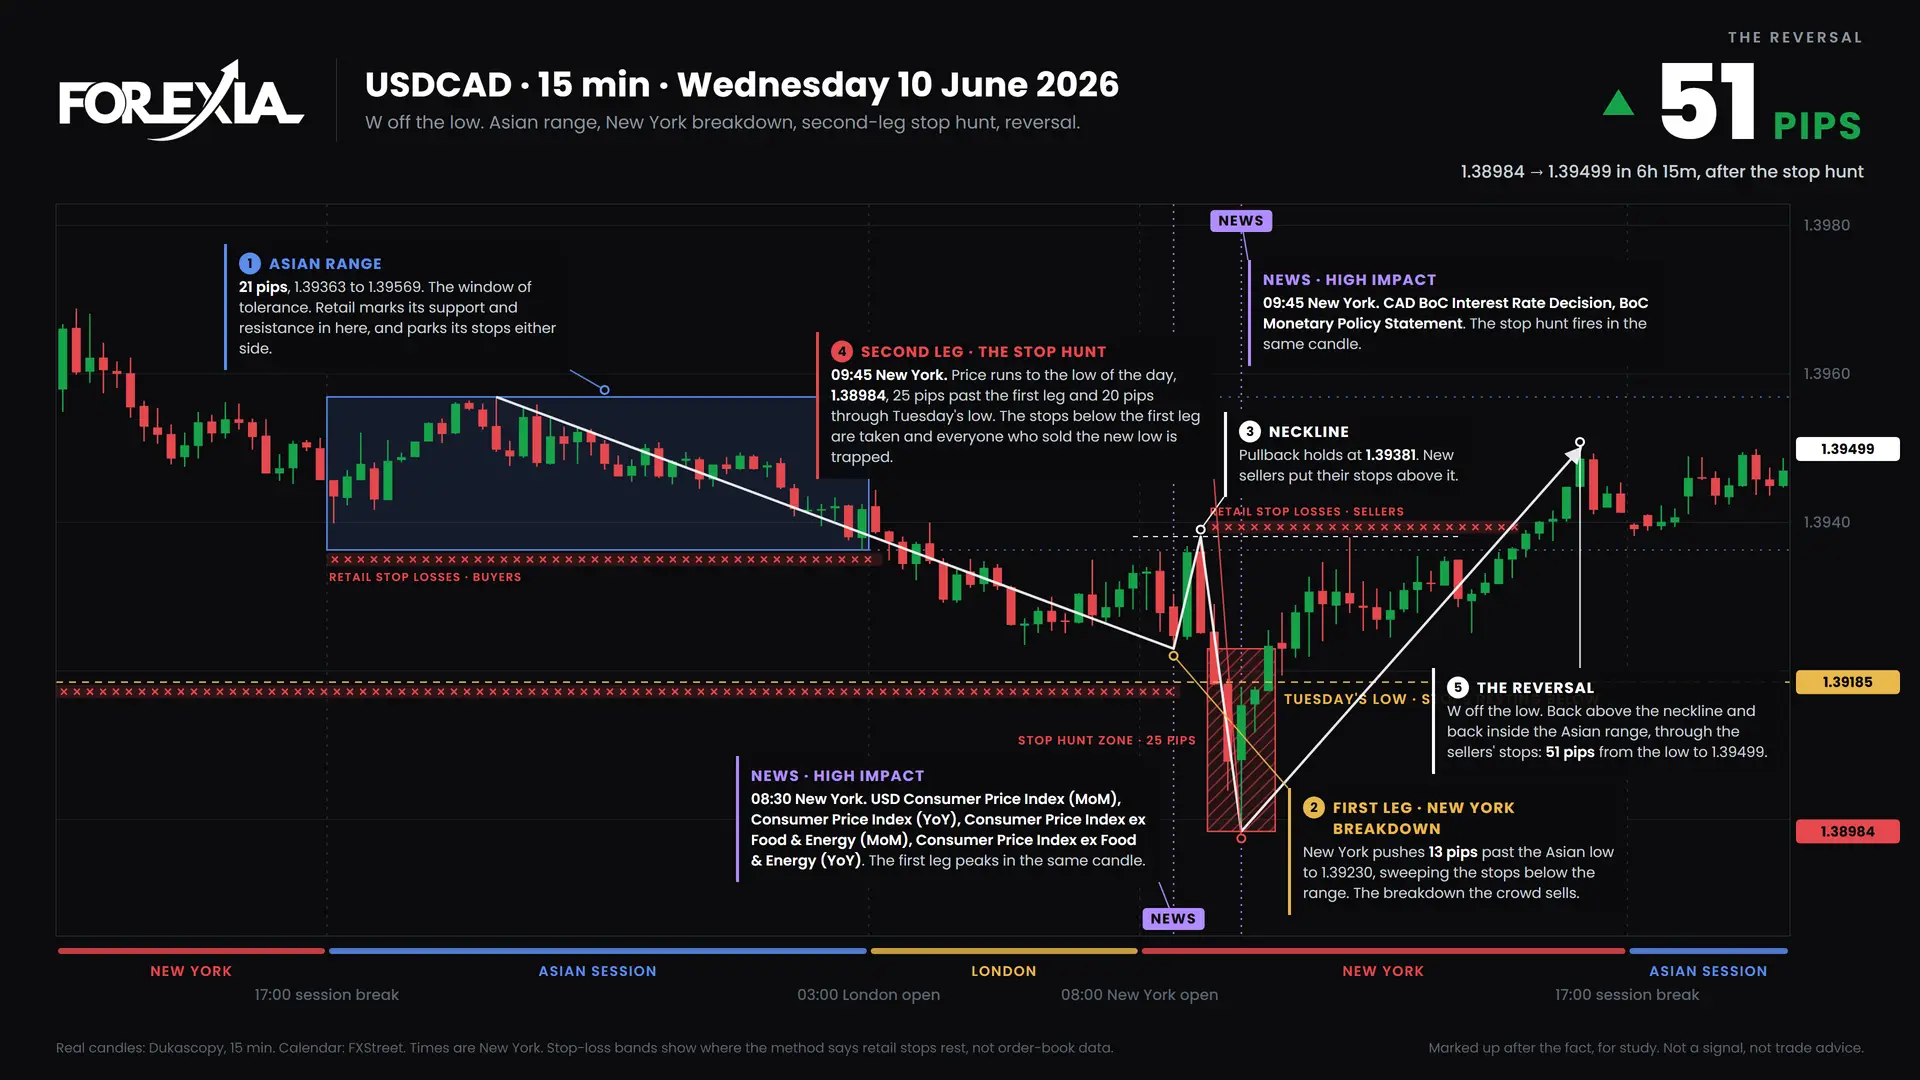
The mirror image at a low. This USDCAD W from the week of 8 June 2026 shows the first leg under the Asian range, the neckline, and the second leg that took the stops beneath it before the reversal.
Stop hunt, with no second leg
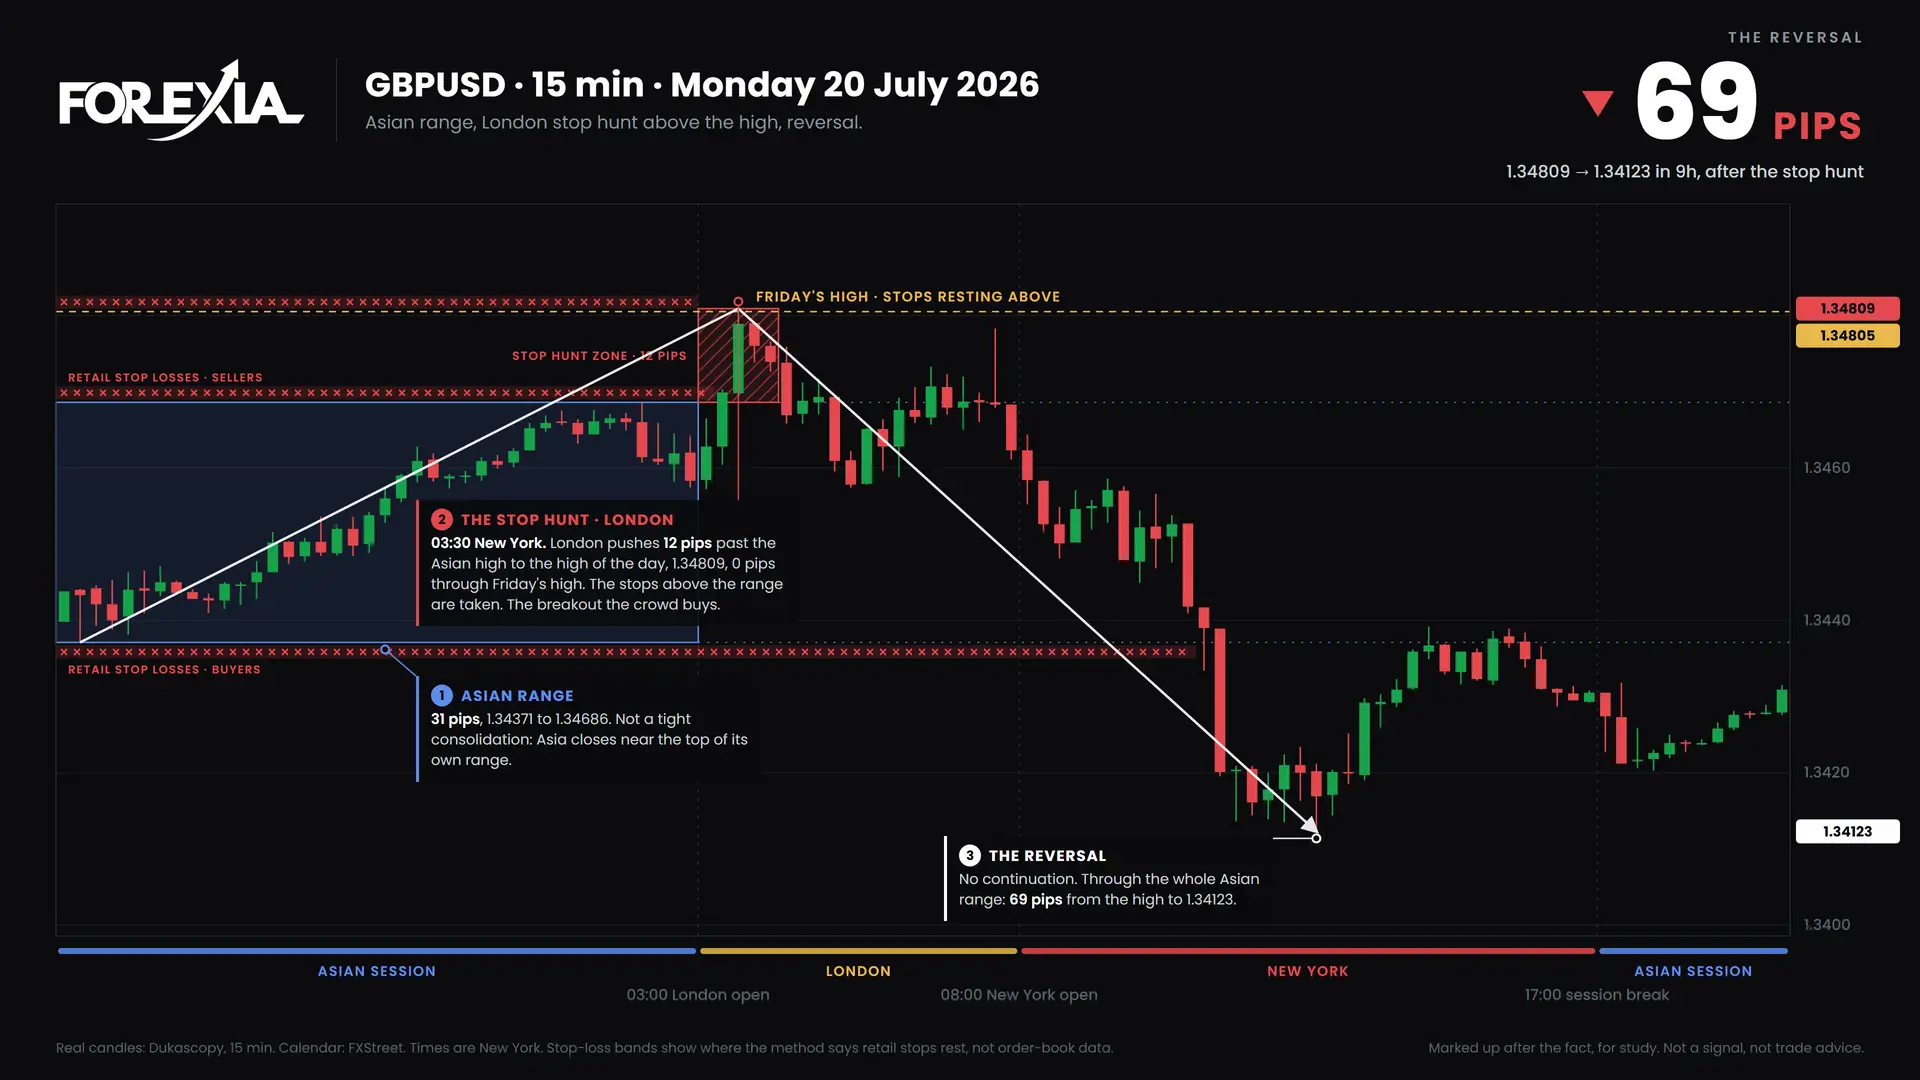
Sometimes there is no first leg and neckline: one push through the edge of the Asian range, to the high or low of the day, and no continuation. This one is GBPUSD from the week of 20 July 2026. When both edges are taken on the same day we mark it as both sides hunted, as in the week of 6 April 2026.
The weekly cycle: induction, trap, reversal
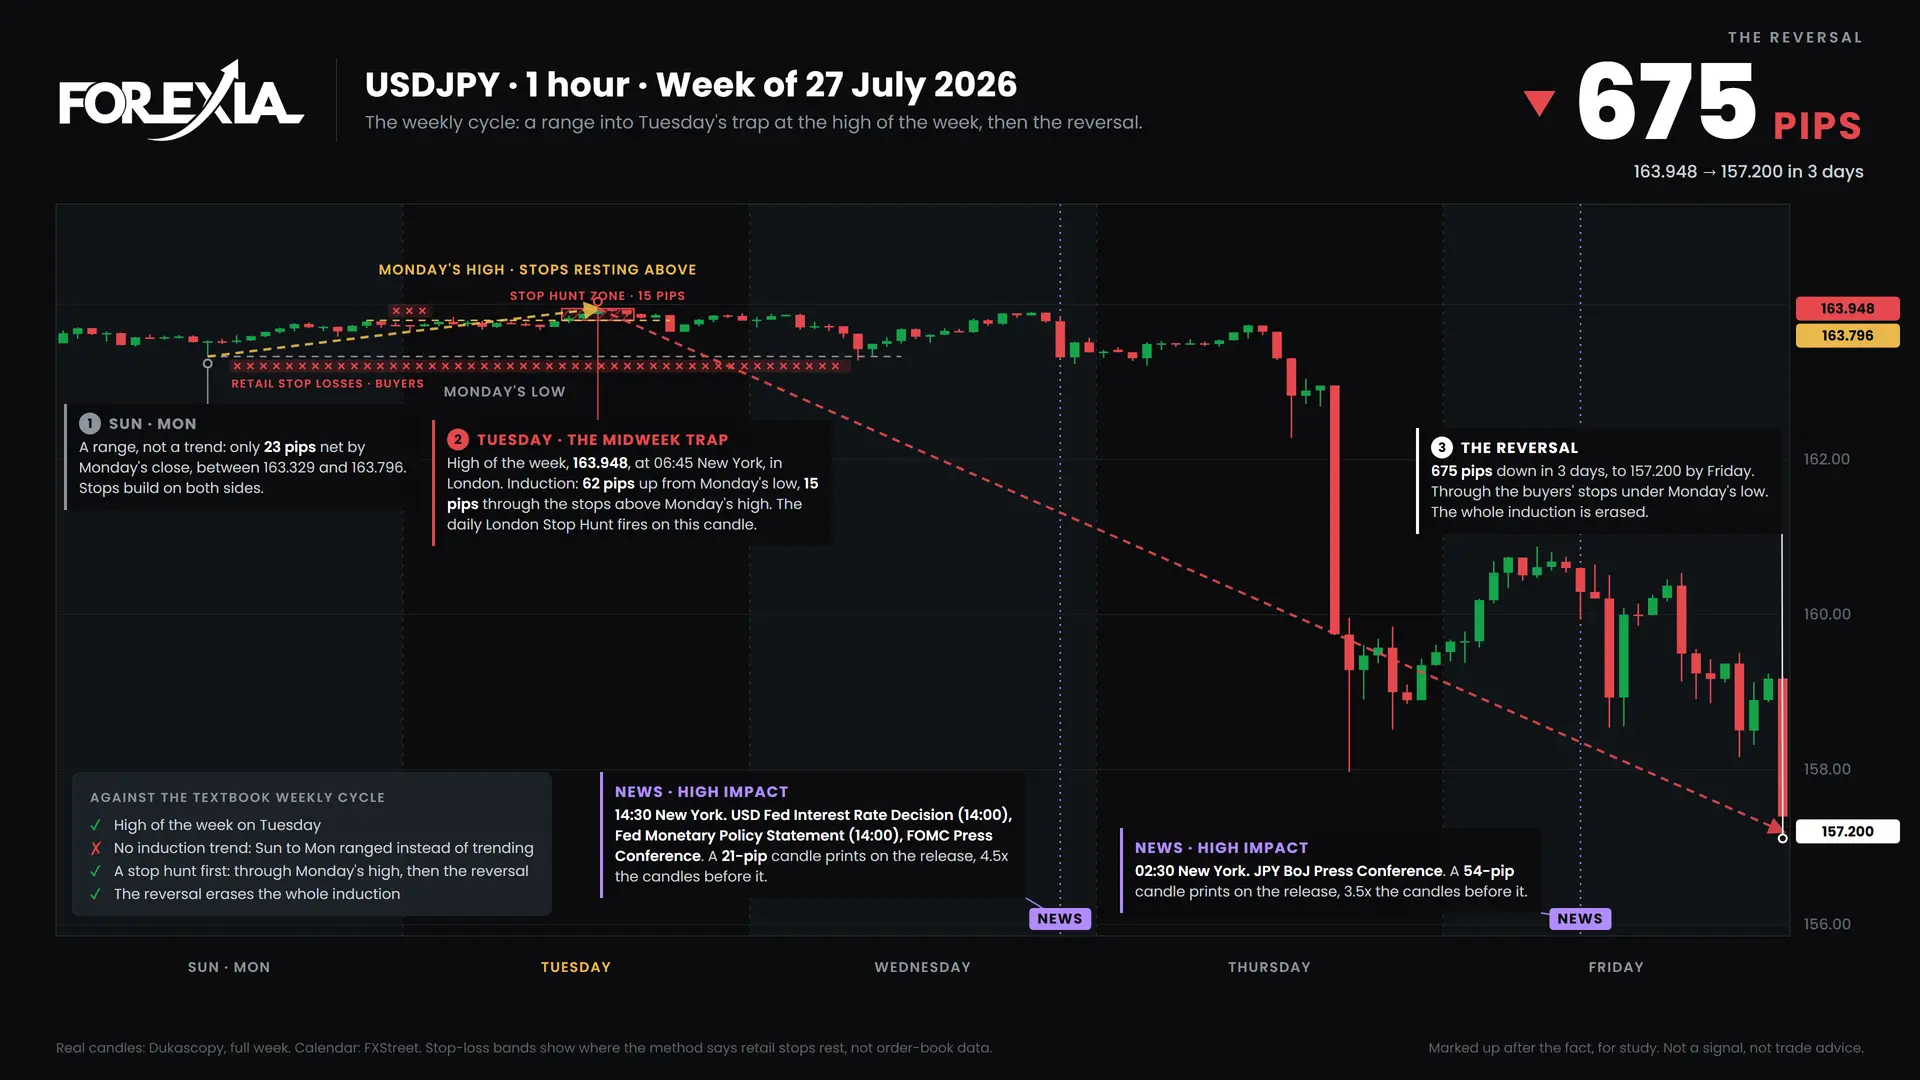
The same idea runs on the weekly scale. Sunday, Monday and Tuesday build the induction trend, the direction the crowd follows. The high or low of the week prints on Tuesday or Wednesday: the midweek trap. Then Wednesday, Thursday and Friday reverse it. The chart above is USDJPY from the week of 27 July 2026, a 675-pip reversal.
We only draw a weekly cycle chart when the week actually turned, and each one carries a checklist showing which parts of the textbook held and which did not.
Confluence: the eight confirmations
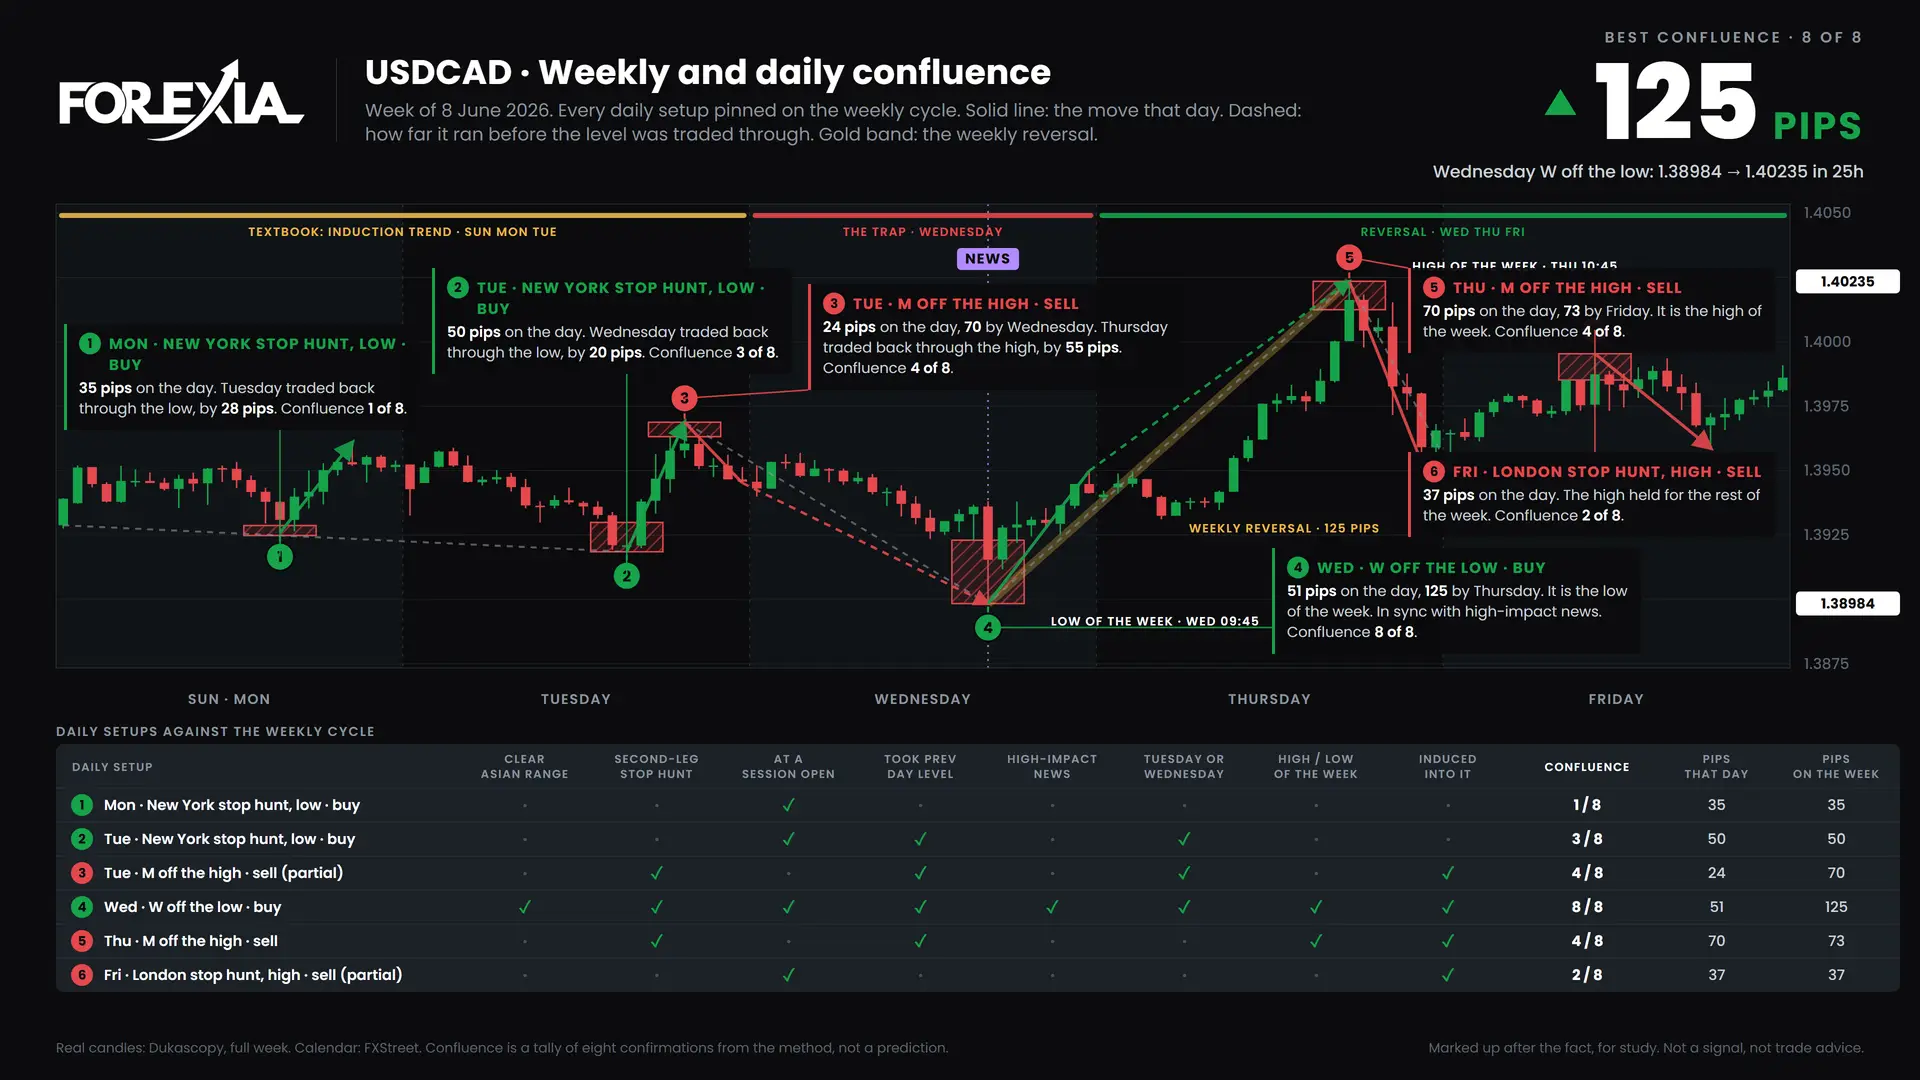
A confluence chart pins each daily setup on the weekly chart and scores it. One point for each of these:
- a clear Asian range
- a second-leg stop hunt (an M or a W)
- the hunt landing at the London or New York open
- taking the previous day's high or low
- high-impact news in the same candle
- forming on Tuesday or Wednesday
- being the high or low of the week
- price being induced into it from the week's open
Across 26 weeks, leaving out Friday setups, the level behind a setup was never traded back through that week on 11 of 18 setups that scored 6 or more, 21 of 31 that scored 5, 68 of 135 that scored 3 or 4, and 35 of 95 that scored 2 or less. Read that with care: being the high or low of the week is one of the eight, and it is only known in hindsight. The score is a tally, not a prediction.
Textbook and partial
A daily setup is textbook when the reversal clears the whole Asian range, or runs at least three quarters of the pair's average daily range. It is partial when the structure printed but the reversal stalled inside the range. Both are published, because a method that only shows its winners is not showing you the method.
Frequently asked questions
What is reverse price action?
Reverse price action is reading a chart from the other side of the trade. Retail traders are taught the same rules, so their stops and breakout orders sit at predictable prices. Instead of following the textbook signal, you ask who is about to be trapped by it and where their stops are.
How do you know where retail stop losses are?
Where they are taught to: just above the most recent high when selling, and just below the most recent low when buying. That puts them at the edges of the Asian range, beyond the previous day's high and low, and beyond the first leg of a pattern. The charts mark those places with bands of red crosses.
Is a chart markup a trade signal?
No. Every markup is made after the fact, on real candles, for study. It shows what the structure was and what it offered. It is not a signal and not trade advice.
Where to start
- USDCAD W formation, week of 8 June 2026
- USDJPY midweek reversal, week of 27 July 2026
- EURUSD M formation, week of 13 April 2026
- FOMC stop hunt, week of 14 September 2026
- EURUSD stop hunt, week of 28 September 2026
- Every week, newest first
Learn to read the chart this way. The Forexia Academy courses cover the Asian range, M and W formations and the weekly cycle step by step. Browse the courses.
Chart markups are made after the fact, for study. They are not signals and not trade advice. Candles: Dukascopy. All times are New York.
Share this post
Related Posts
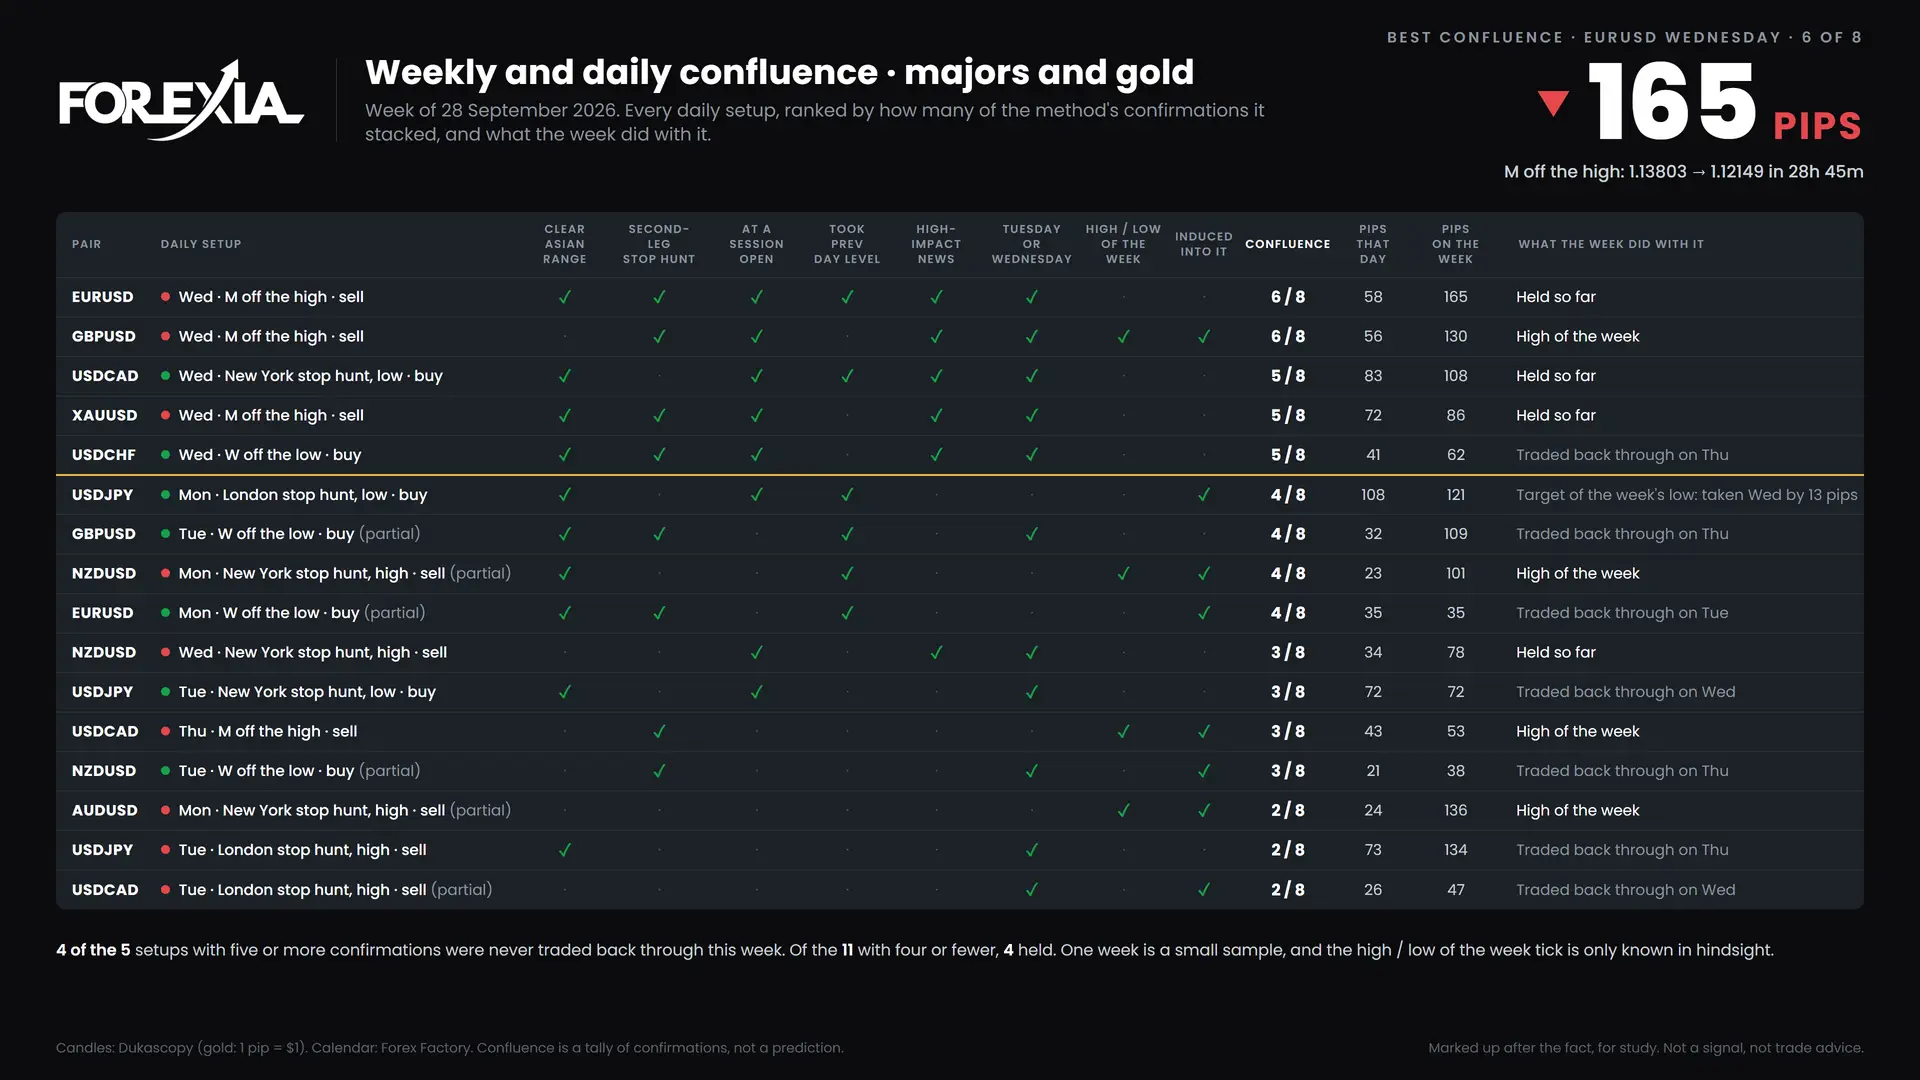
Forex Chart Markups: Weekly Stop Hunt & Reversal Archive
Forex chart markups, week by week: stop hunts, M and W formations and midweek reversals on the majors and gold, drawn on real candles.

EURUSD Stop Hunt: Forex Chart Markups, 28 September 2026
An EURUSD stop hunt through Tuesday's high on US PCE data completed an M formation and fell 165 pips. Chart markups, 28 September 2026.