
USDJPY Stop Hunt: Forex Chart Markups, 6 April 2026
Forexia Academy
The cleanest USDJPY stop hunt of the week came on Tuesday 7 April 2026. London took the stops under the Asian low, New York took the stops above the Asian high at 160.029, and that high became the high of the week. Price then fell 215 pips by Wednesday. Across the seven majors and gold we marked up 7 textbook setups and 5 partials, all on real 15-minute candles.
The week in brief
- Markets: the seven forex majors and gold (XAUUSD, counted at 1 pip = $1), on 15-minute and 1-hour candles.
- Daily setups: 7 textbook and 5 partial.
- Weekly cycle: 1 of 8 markets turned midweek (USDJPY).
- Setup of the week: USDJPY on Tuesday, both sides of the Asian range hunted, 3 of 8 on confluence: 52 pips that day, 215 on the week.
- News in sync with a stop hunt: USD ISM Services PMI; USD Core Personal Consumption Expenditures - Price Index (MoM), Core Personal Consumption Expenditures - Price Index (YoY); USD Michigan Consumer Sentiment Index.
USDJPY stop hunt: how to read these chart markups
New to these charts? Every markup reads price action in reverse. Retail traders are taught the same rules: buy the breakout, sell the breakdown, and put the stop just beyond the last high or low. So we know where their orders sit without seeing an order book. The blue box is the Asian range. The red crosses are retail stop losses. The hatched zone is the stop hunt, where price goes to collect them, and the big number in the header is what the reversal paid in pips. The full walkthrough is in How to Read a Forex Chart Markup.
The week at a glance: confluence ranking
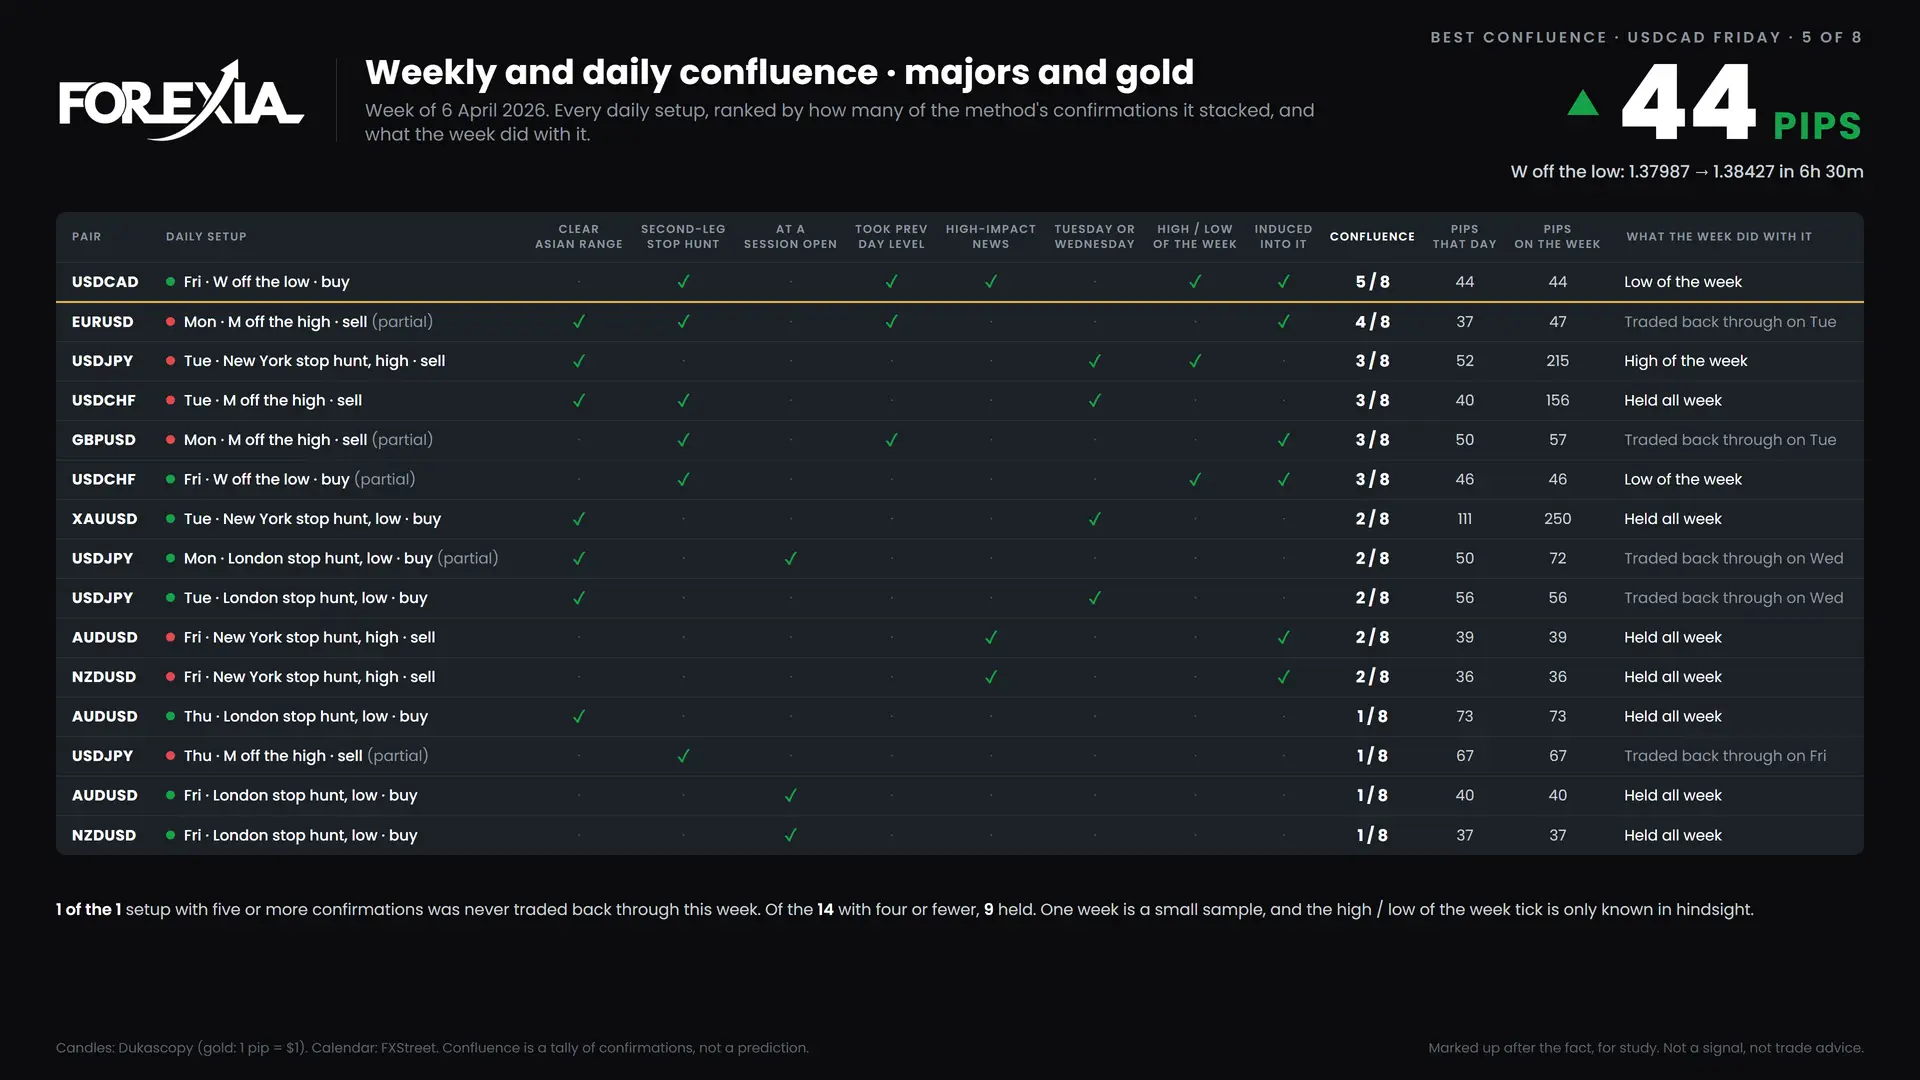
Every daily setup of the week on one page, best first. The score is a tally of the eight confirmations the method lists, and the last column says what the rest of the week did with each level. USDCAD leads with 5 of 8.
The weekly cycle: induction, trap, reversal
The weekly cycle is the bigger picture behind every daily setup: an induction trend early in the week, the high or low of the week on Tuesday or Wednesday, then the reversal. We only draw it when the week actually turned, and each chart carries a checklist of which parts held. The idea is laid out in How to Read a Forex Chart Markup.
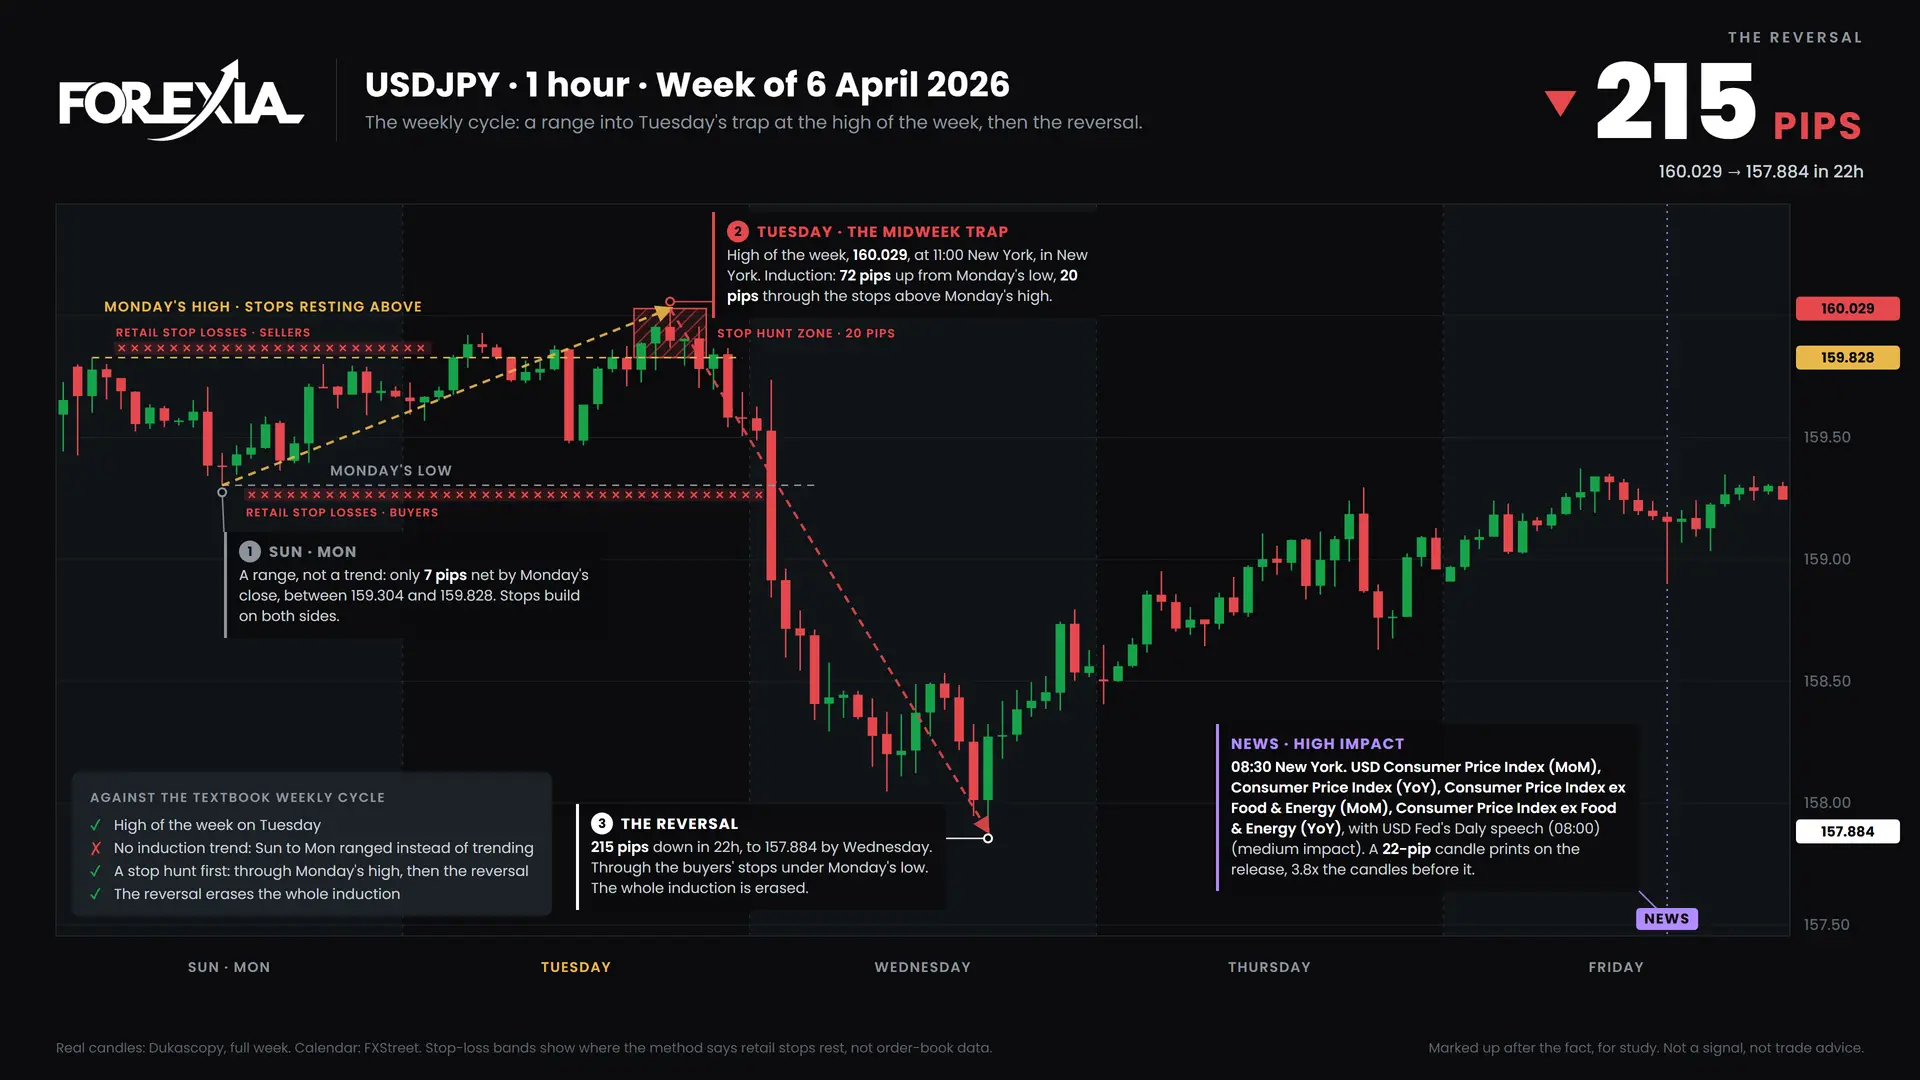
USDJPY · 215-pip reversal. The trap printed the high of the week at 160.029 on Tuesday 11:00 New York, and the reversal ran 215 pips to 157.884 by Wednesday. 3 of 4 textbook checks held; the miss: no induction trend, Sun to Mon ranged instead of trending.
No weekly cycle chart for EURUSD, GBPUSD, USDCHF, AUDUSD, USDCAD, NZDUSD and Gold (XAUUSD): those markets did not make a midweek high or low and then reverse by at least 1.25 average daily ranges.
Setup of the week: USDJPY both sides hunted, 7 April 2026
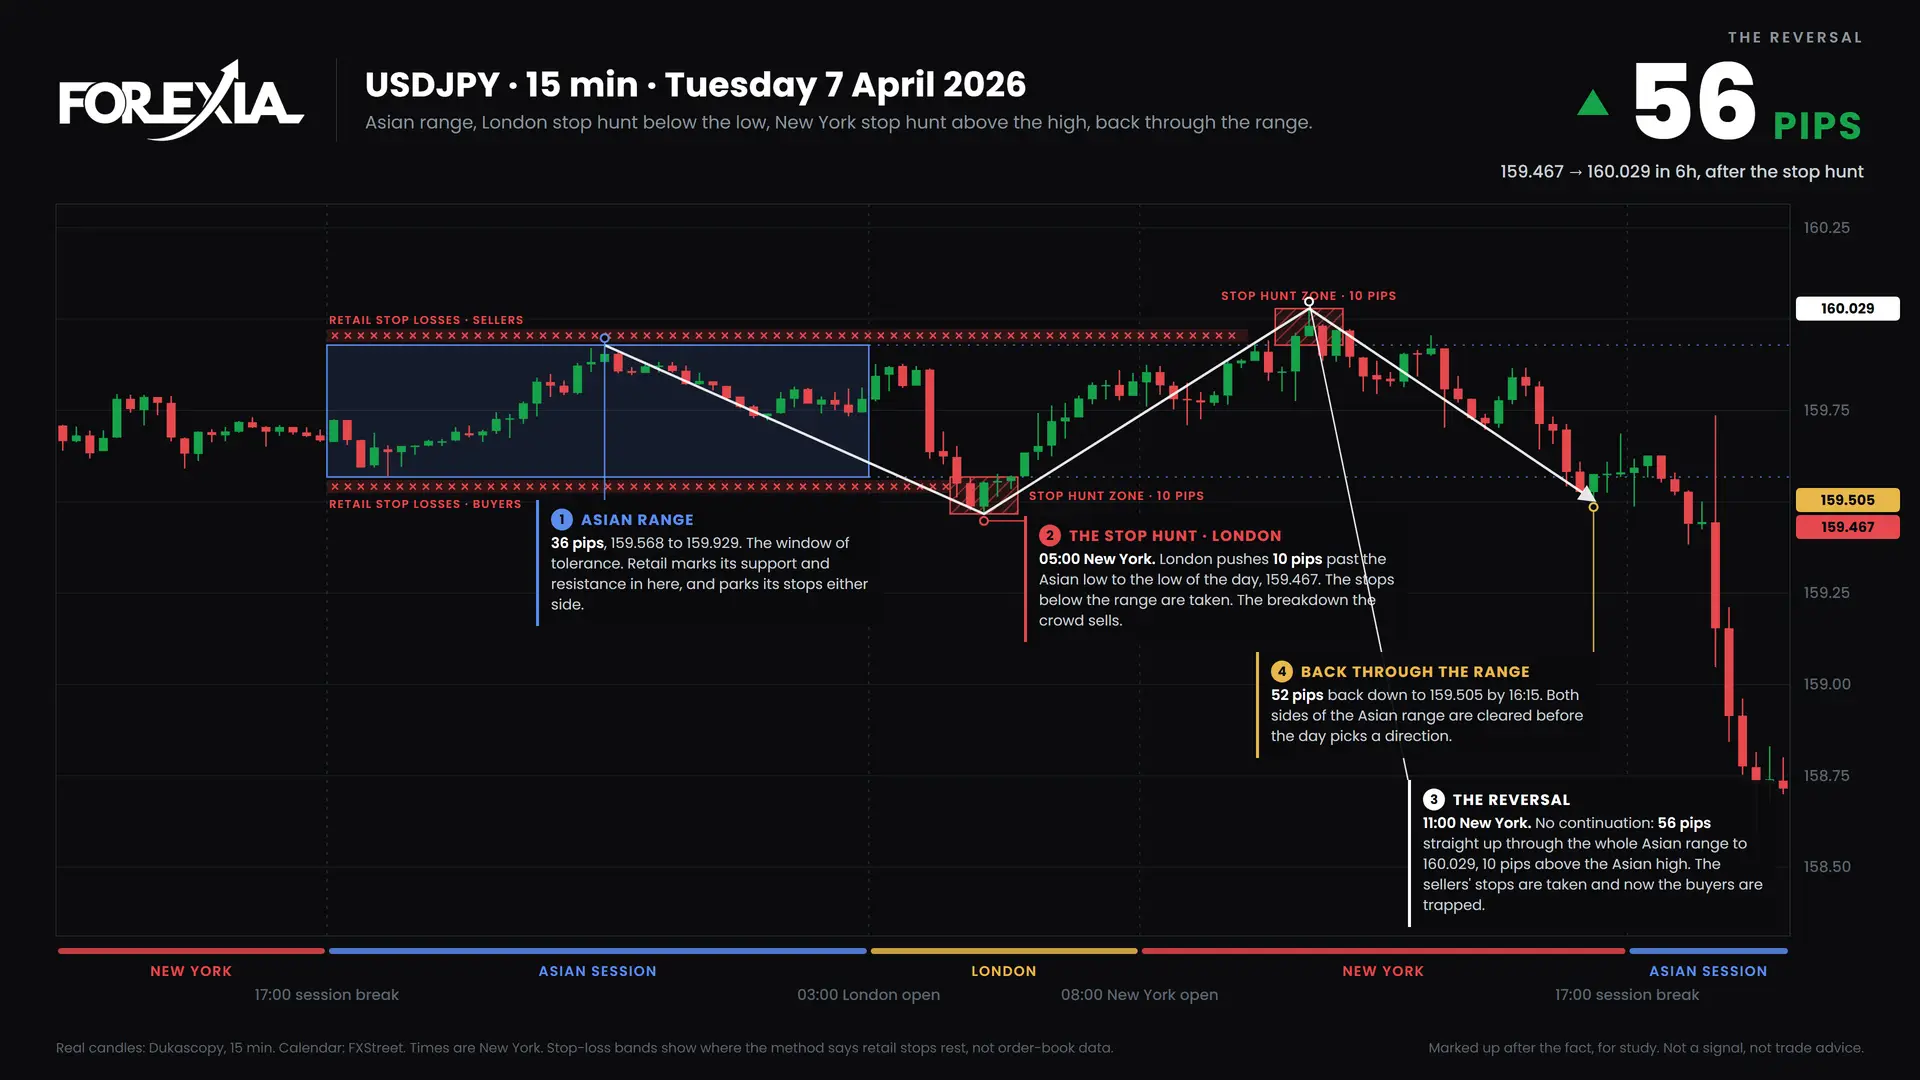
USDJPY spent the Asian session in a 36-pip range between 159.568 and 159.929. London then pushed 10 pips past the Asian low, to 159.467 at 05:00 New York: the breakdown the crowd sells. There was no first leg and neckline beyond the range, so this is a plain stop hunt of the Asian range, not an M or a W. Price did not continue. It reversed 56 pips to 160.029 in 6h, through the whole Asian range.
Then the other side was hunted. At 11:00 New York price was 10 pips above the Asian high, at 160.029: 56 pips from the first extreme, with the sellers' stops taken and new buyers trapped. Price then ran 52 pips back to 159.505 by 16:15. Both sides of the Asian range were cleared before the day picked a direction.
Now read it in reverse. At each of those prices, whose orders were waiting?
Where the retail stops were
- Buyers' stops below the Asian low, 159.568: taken by the stop hunt.
- Sellers' stops above the Asian high, 159.929: taken as the reversal cleared the range.
The trade. The method buys against the breakout, on the stop hunt past the Asian low (159.467). The stricter trigger, the first 15-minute close back inside, came with 10 pips of risk to the extreme and 46 pips to the high of the day, about 1 to 4.6. The method skips anything under 1 to 3, so from that trigger this one qualifies. These numbers are measured after the fact from 15-minute candles.
Confirmations (the New York stop hunt at the high): 3 of 8. It had a clear Asian range, a Tuesday or Wednesday date and the high or low of the week. Missing: a second-leg stop hunt, a hunt at a session open, the previous day's level taken, high-impact news in sync and induction from the week's open. It is the high of the week.
The mindset behind fading a breakout is in How to Read a Forex Chart Markup. For the same stop hunt on USDJPY, see USDJPY midweek reversal, week of 27 July 2026.
Textbook setups, day by day
A setup is textbook when the reversal clears the whole Asian range, or runs at least three quarters of the pair's average daily range. The daily cycle behind all of them, Asia consolidating, London breaking out and the reversal after, is covered in How to Read a Forex Chart Markup.
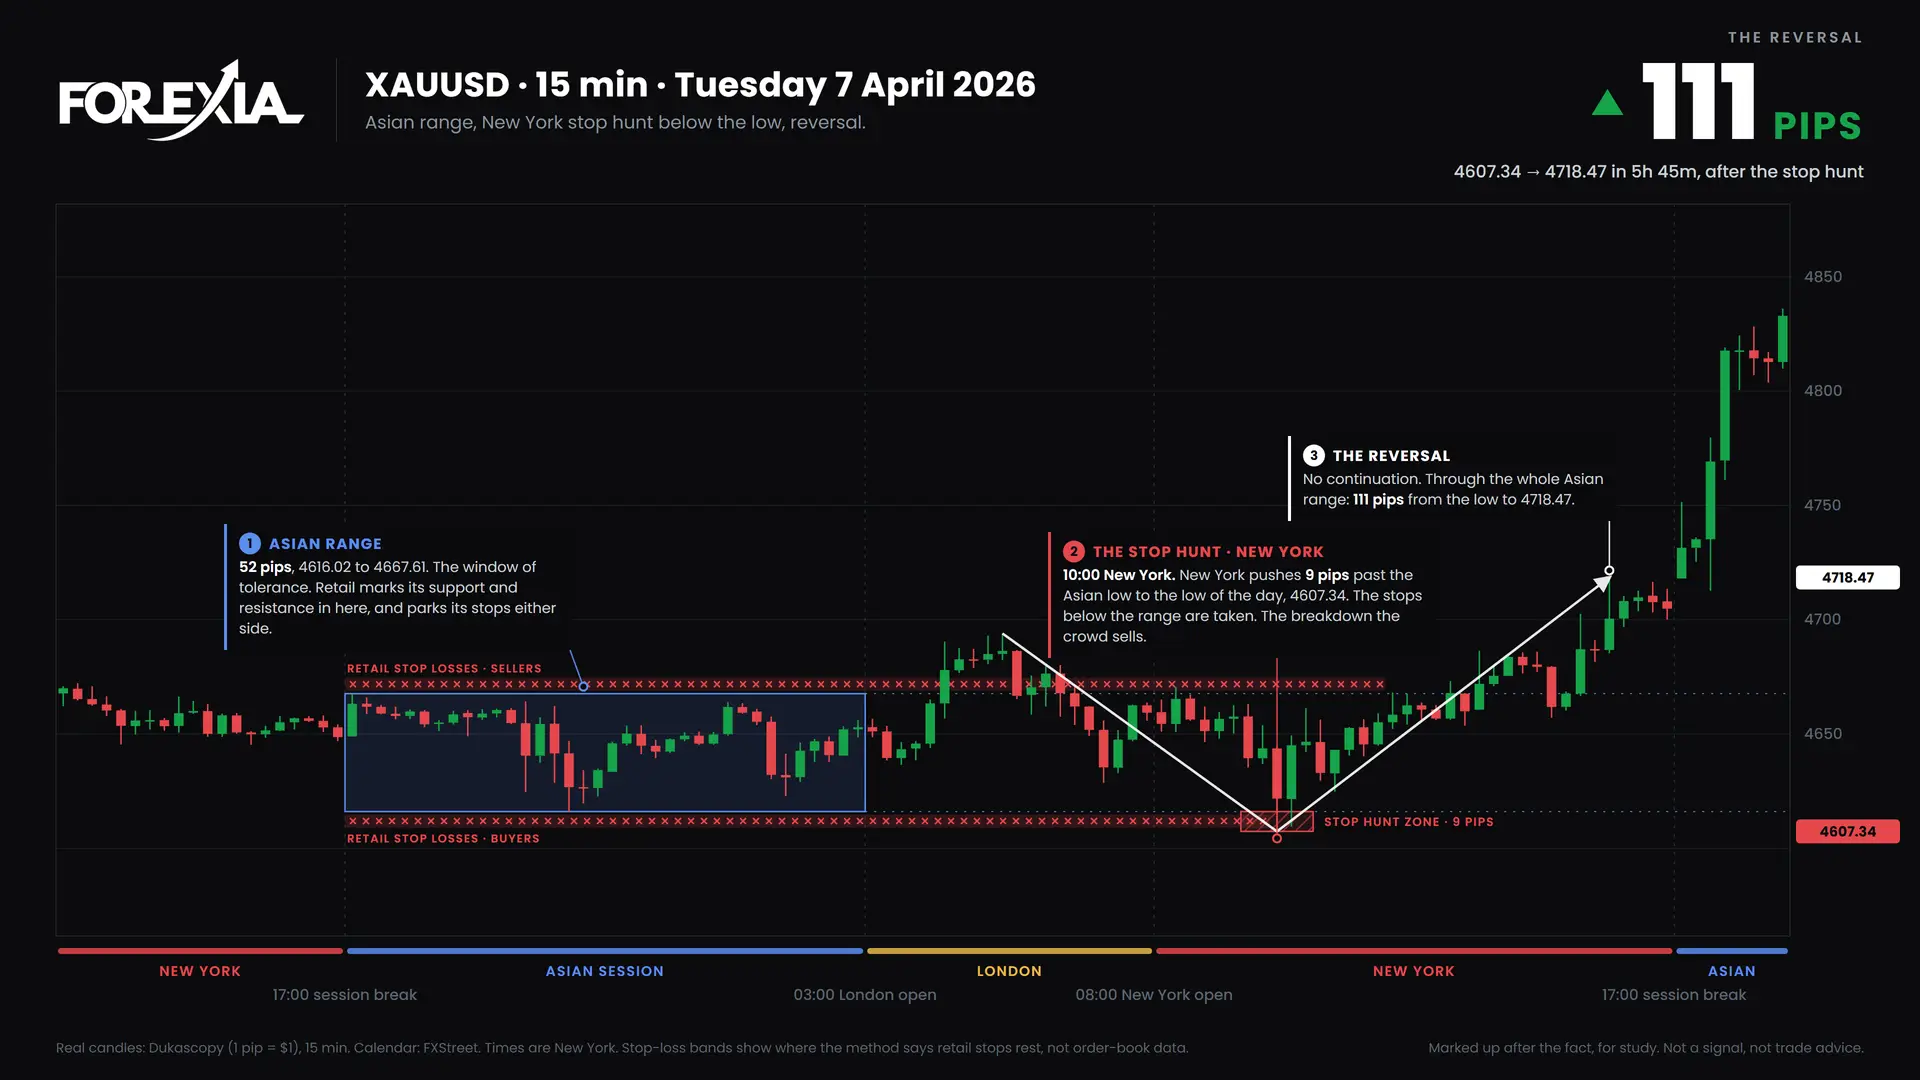
Tuesday · Gold (XAUUSD) · New York stop hunt (111 pips). New York took the stops below the Asian low at 4607.34 (10:00 New York); price reversed 111 pips, through the whole Asian range. Confluence 2 of 8. The low held for the rest of the week.
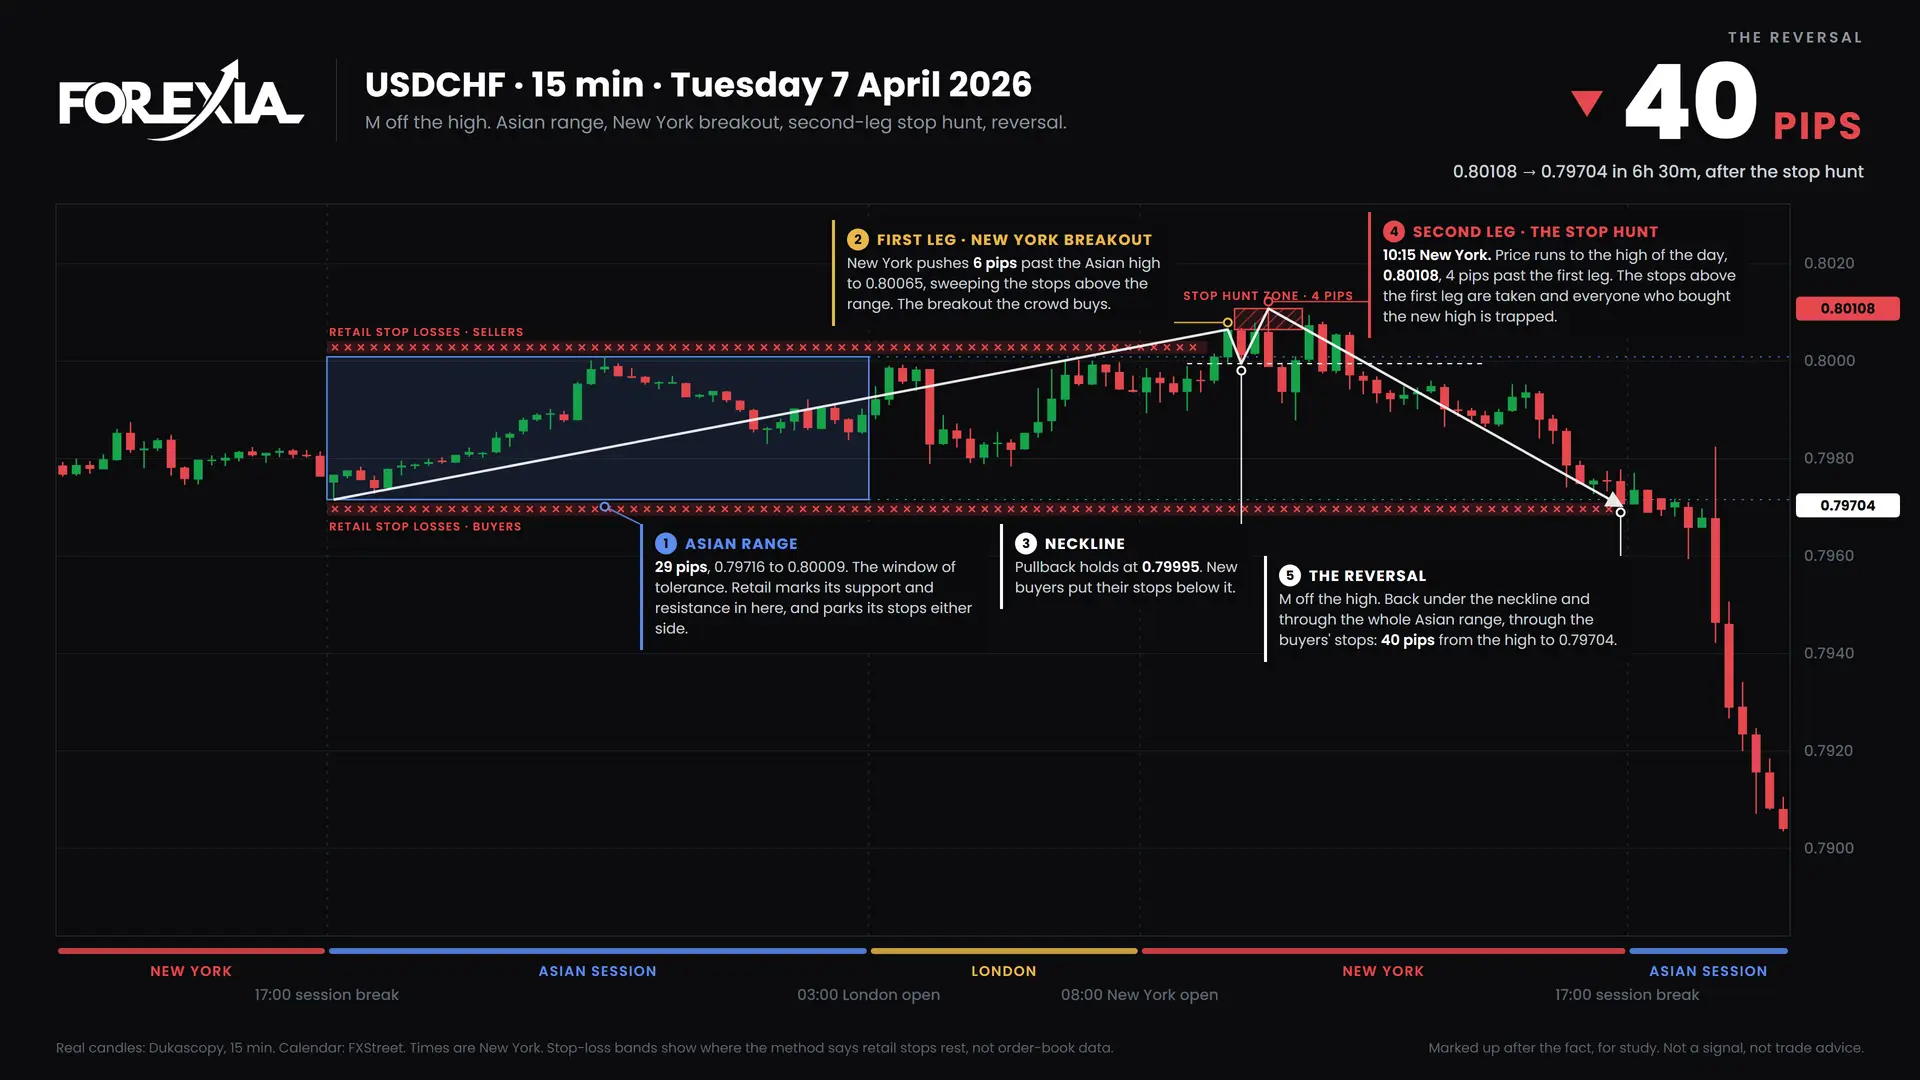
Tuesday · USDCHF · M formation (40 pips). The second leg took the stops above the first leg at 0.80108 (10:15 New York); price reversed 40 pips, through the whole Asian range. Confluence 3 of 8. The high held for the rest of the week.
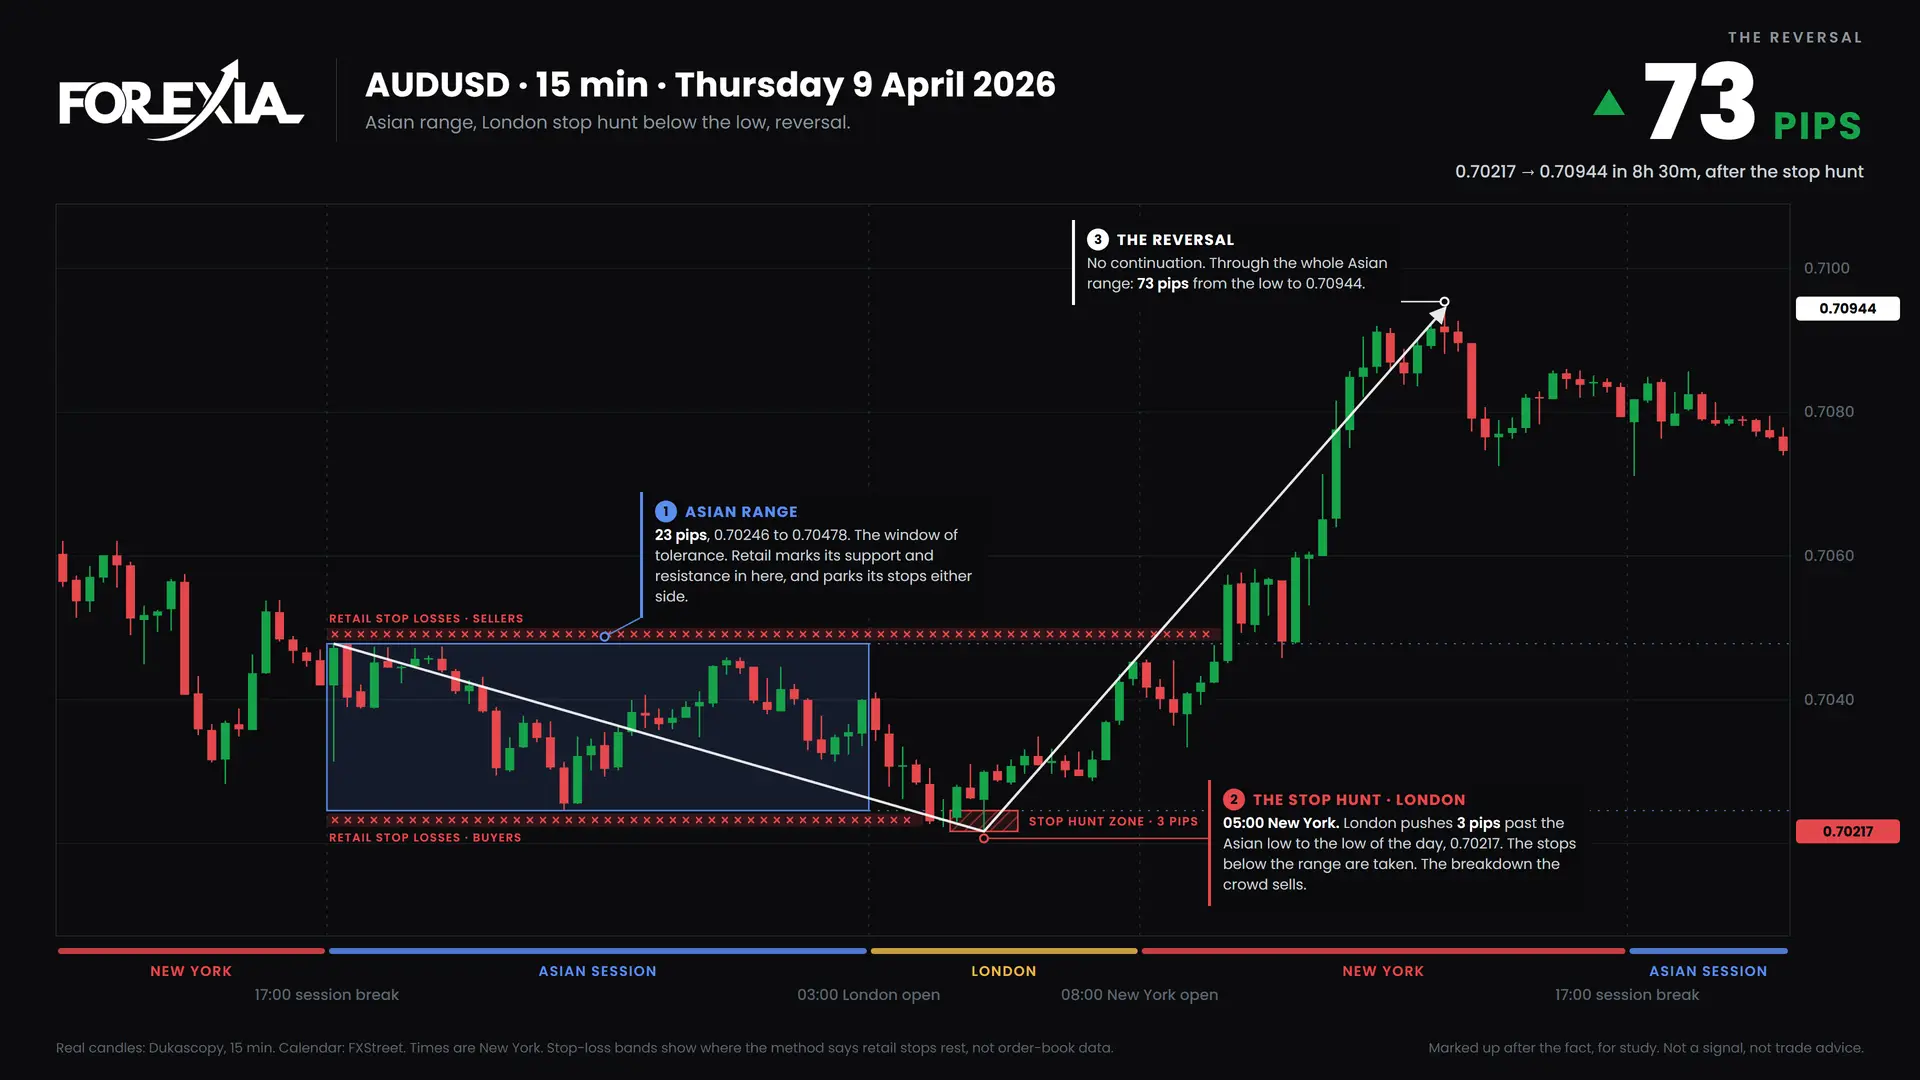
Thursday · AUDUSD · London stop hunt (73 pips). London took the stops below the Asian low at 0.70217 (05:00 New York); price reversed 73 pips, through the whole Asian range. Confluence 1 of 8. The low held for the rest of the week.
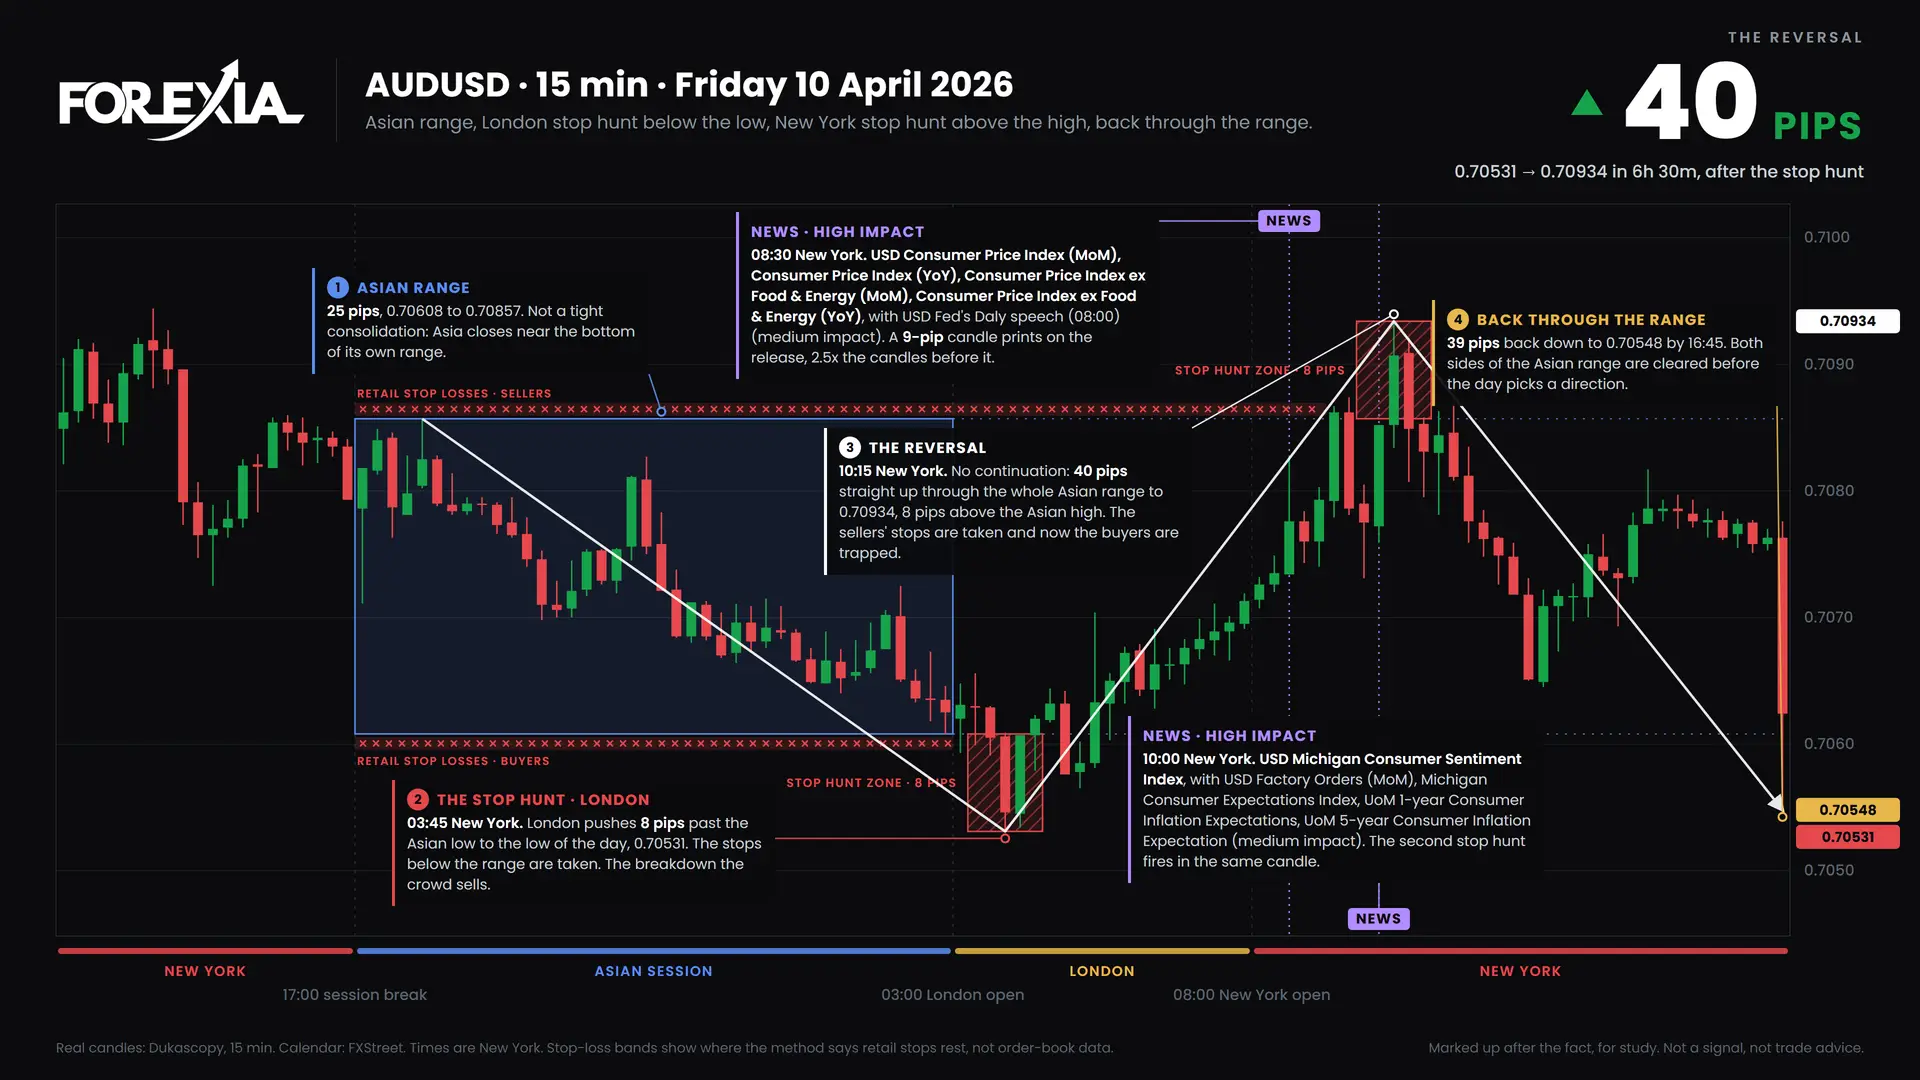
Friday · AUDUSD · Both sides hunted (40 pips). London took the stops below the Asian low at 0.70531 (03:45 New York); price reversed 40 pips, through the whole Asian range. Then the other side was hunted at 10:15 New York, 8 pips above the Asian high. Confluence 1 of 8. The low held for the rest of the week.
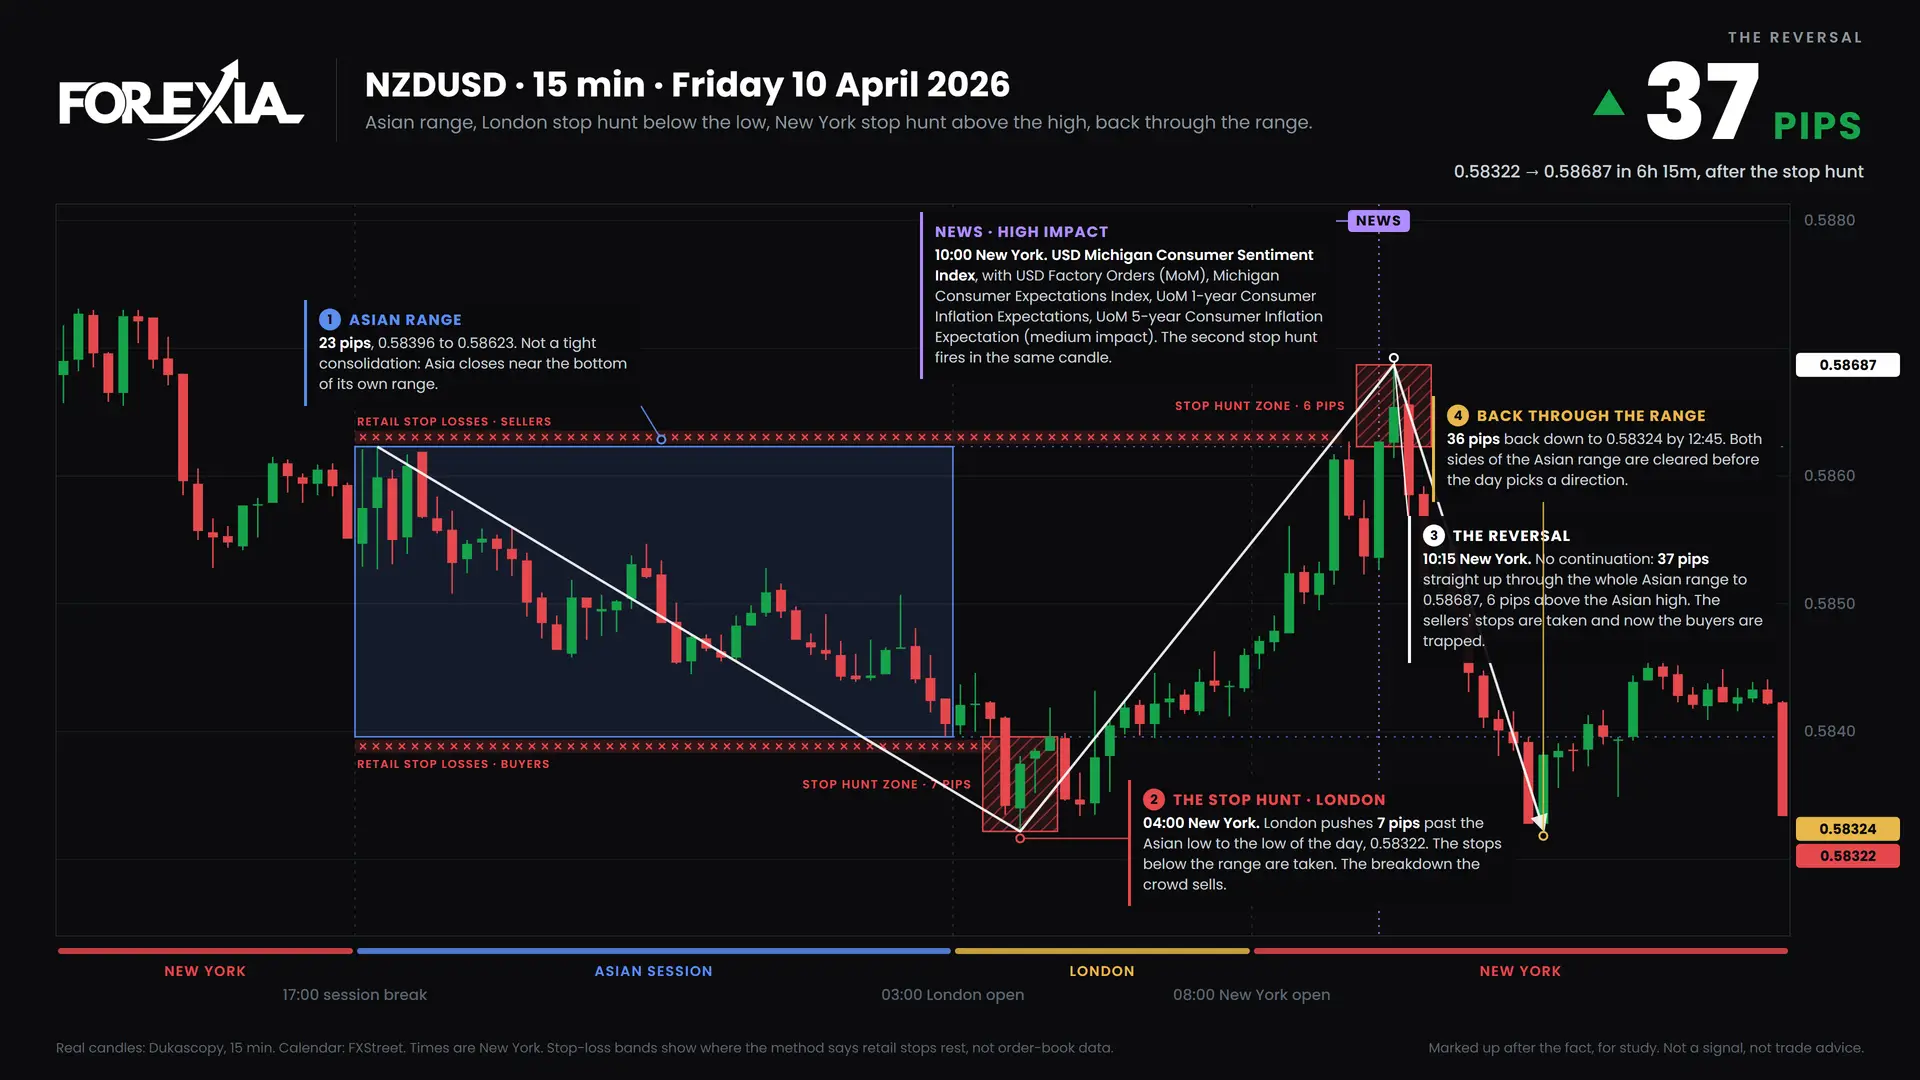
Friday · NZDUSD · Both sides hunted (37 pips). London took the stops below the Asian low at 0.58322 (04:00 New York); price reversed 37 pips, through the whole Asian range. Then the other side was hunted at 10:15 New York, 6 pips above the Asian high. Confluence 1 of 8. The low held for the rest of the week.
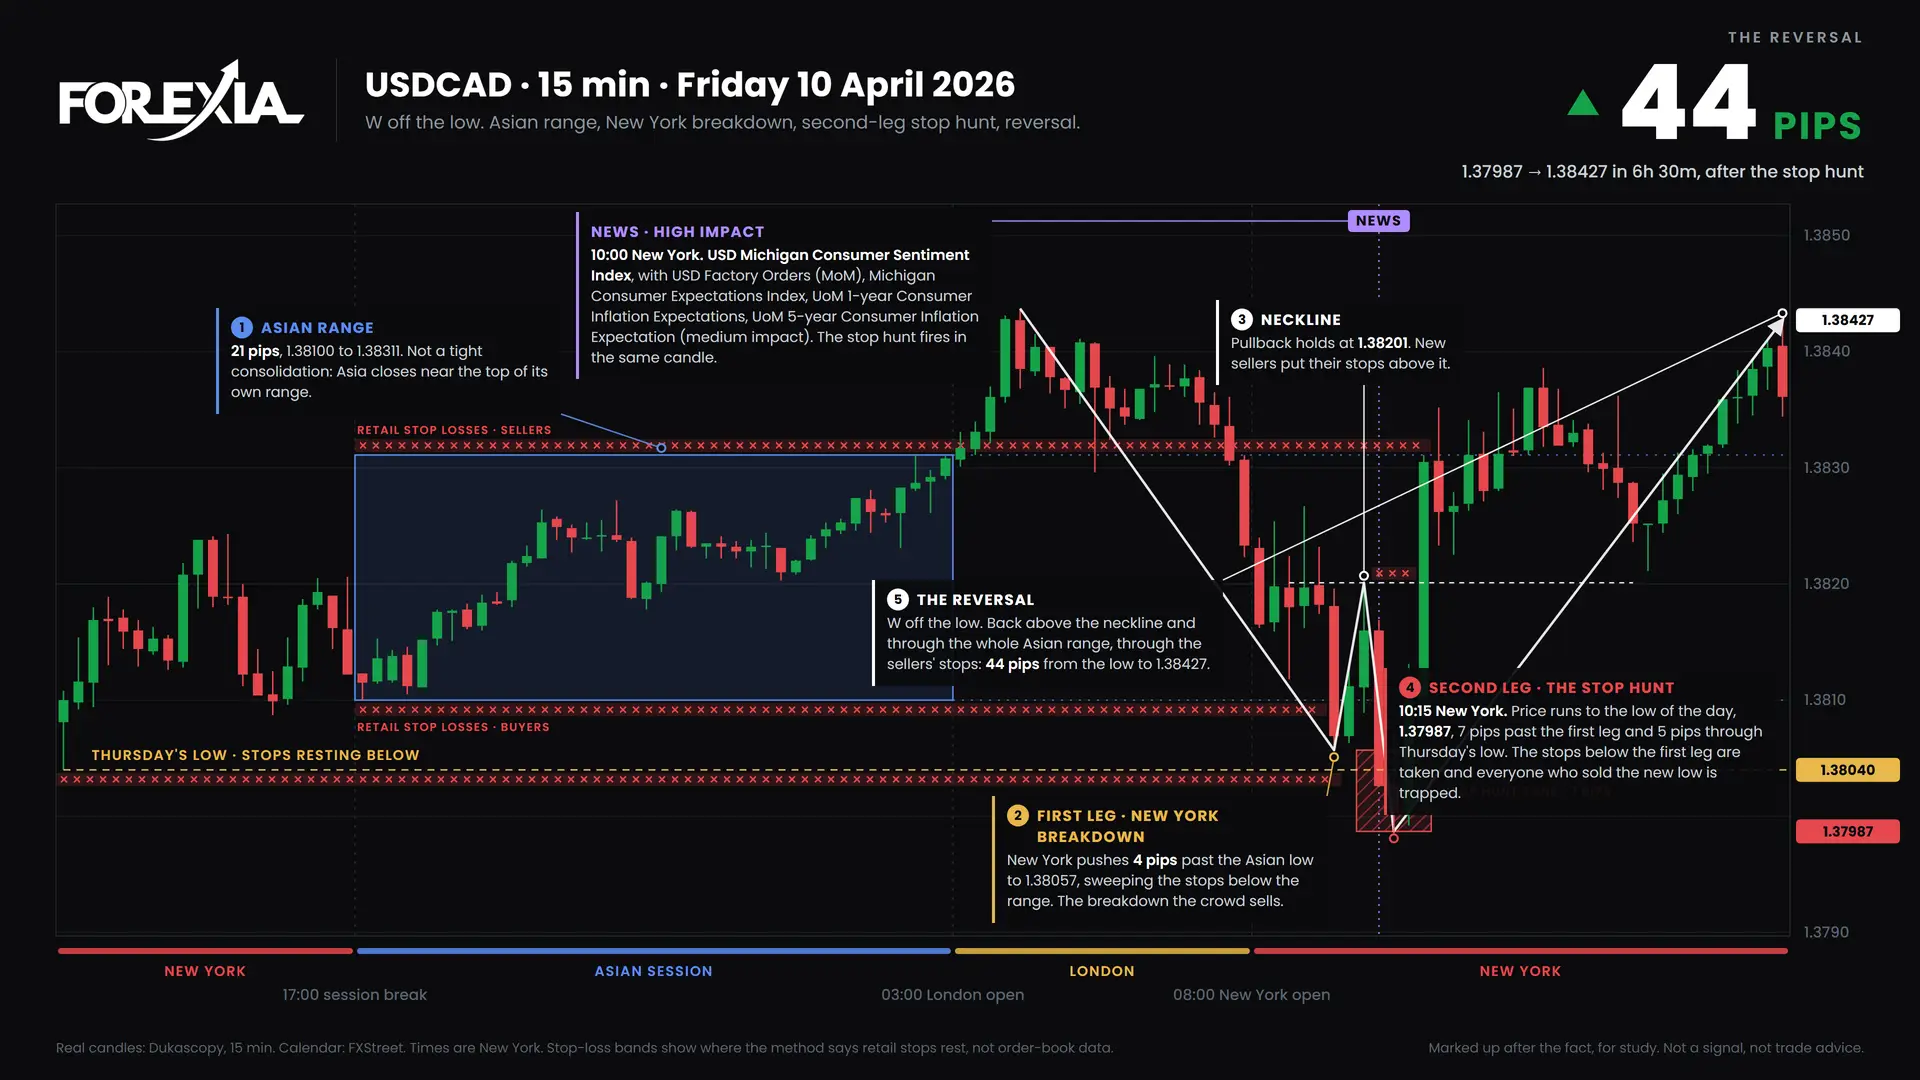
Friday · USDCAD · W formation (44 pips). The second leg took the stops below the first leg at 1.37987 (10:15 New York, 5 pips through Thursday's low); price reversed 44 pips, through the whole Asian range. Confluence 5 of 8. It was the low of the week.
Partial setups: the structure without the follow-through
These printed the structure, but the reversal stalled inside the Asian range. They are worth studying for exactly that reason: the trap was real and the payoff was small.
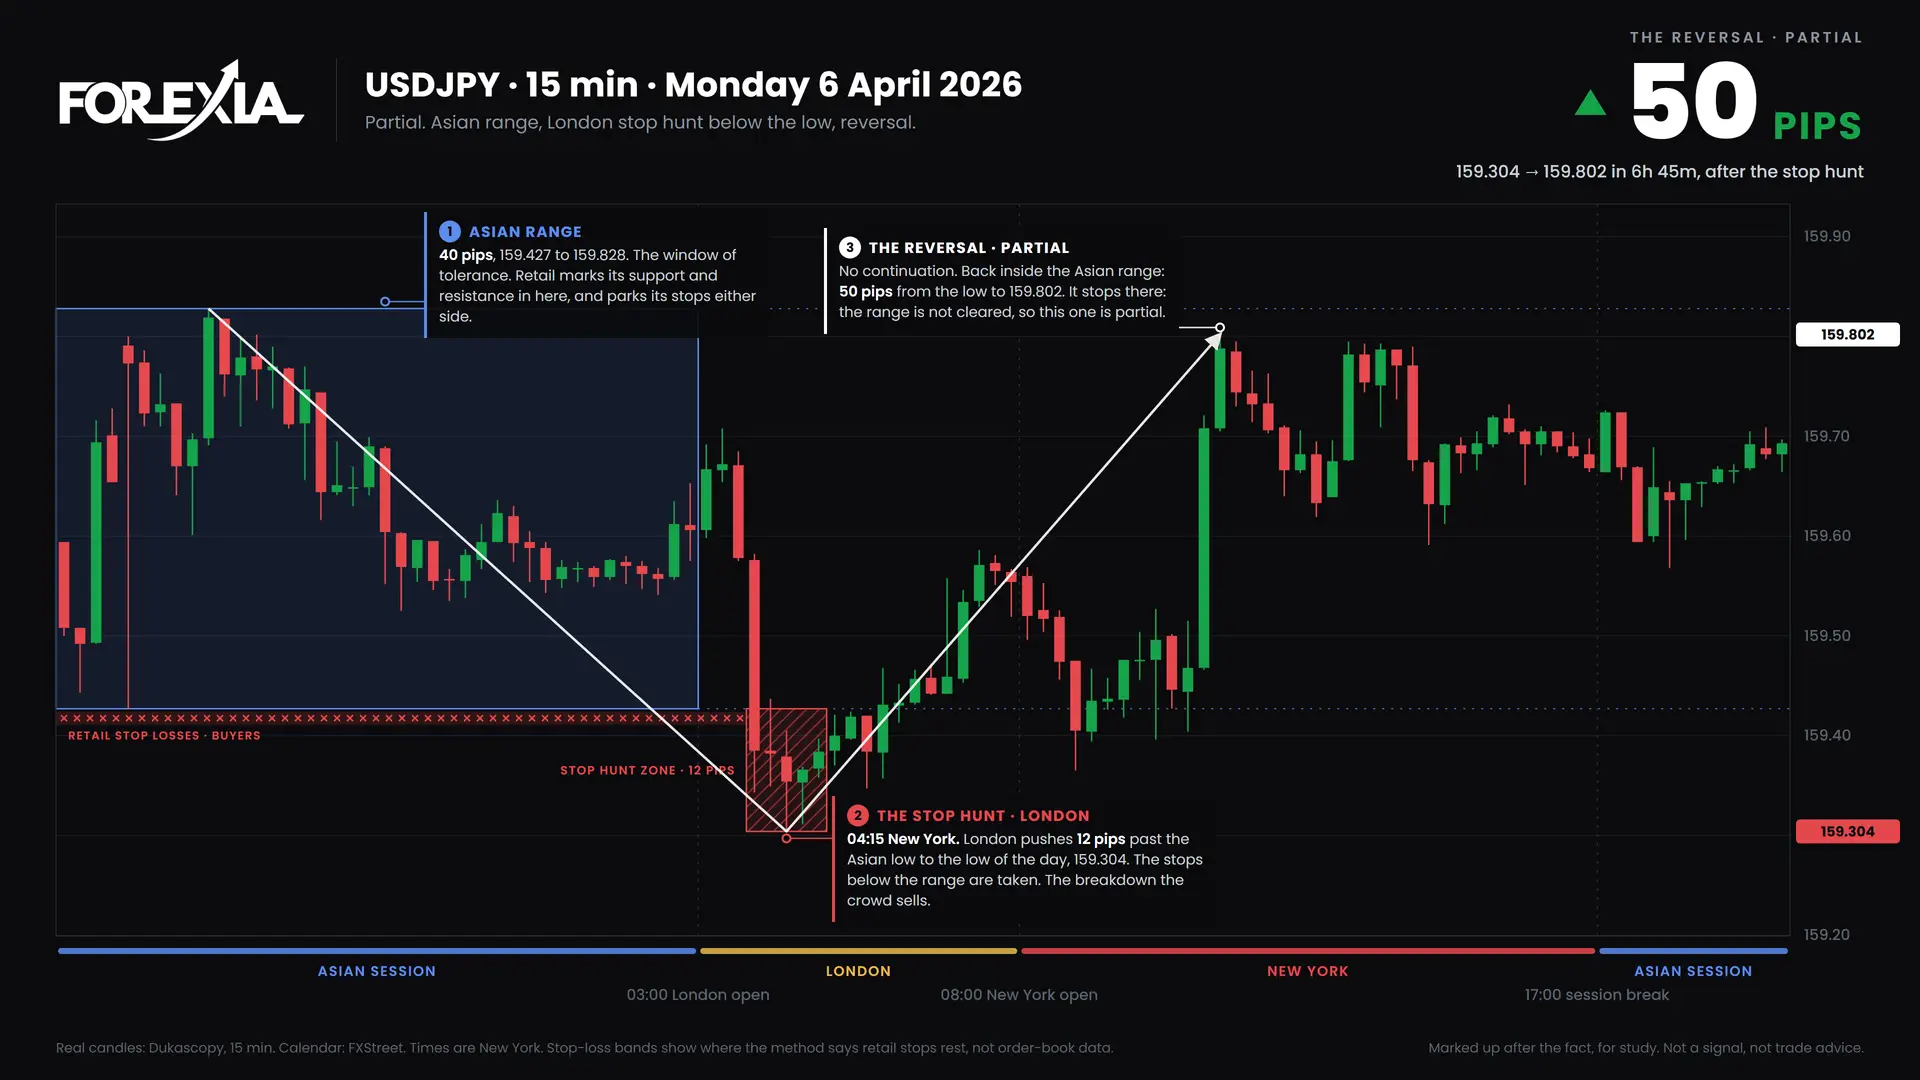
Monday · USDJPY · London stop hunt (50 pips). London took the stops below the Asian low at 159.304 (04:15 New York); price reversed 50 pips, back inside the Asian range. Confluence 2 of 8. Wednesday traded back through it.
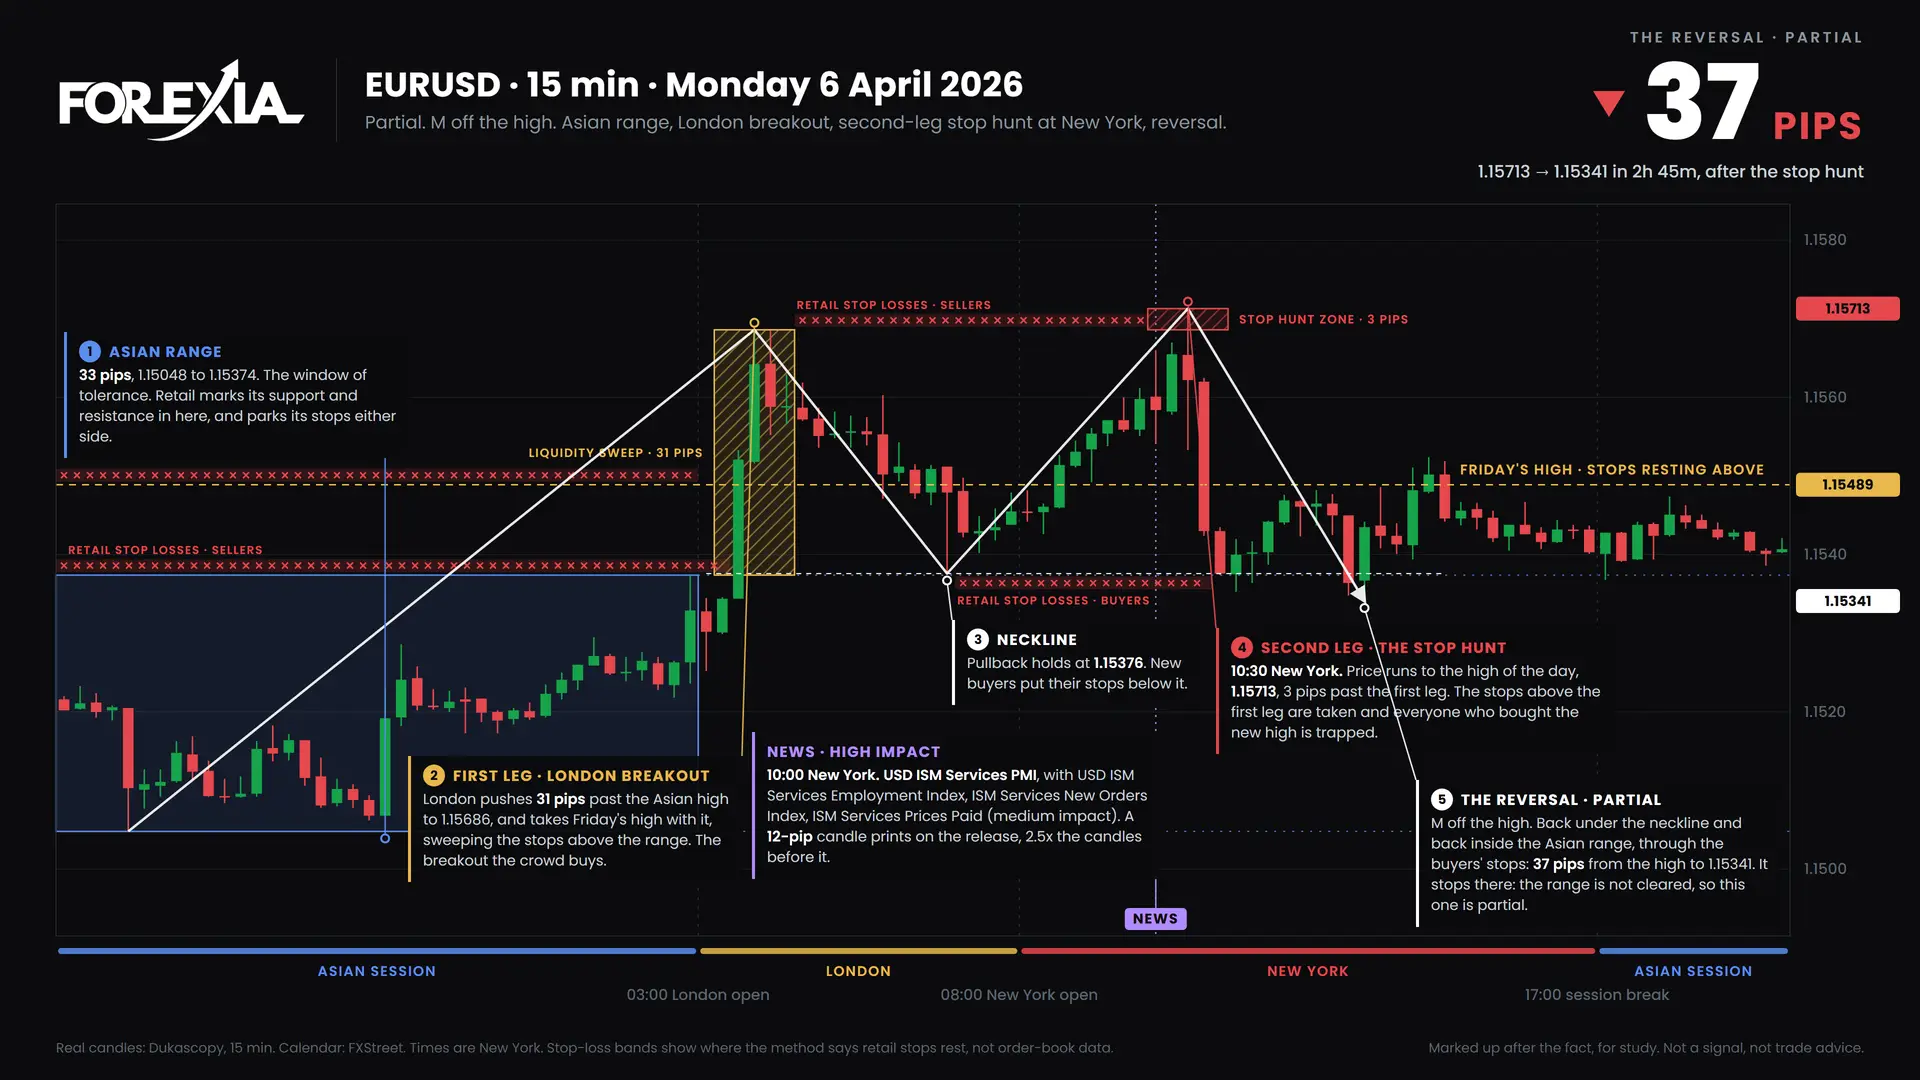
Monday · EURUSD · M formation (37 pips). The second leg took the stops above the first leg at 1.15713 (10:30 New York); price reversed 37 pips, back inside the Asian range. Confluence 4 of 8. Tuesday traded back through it.
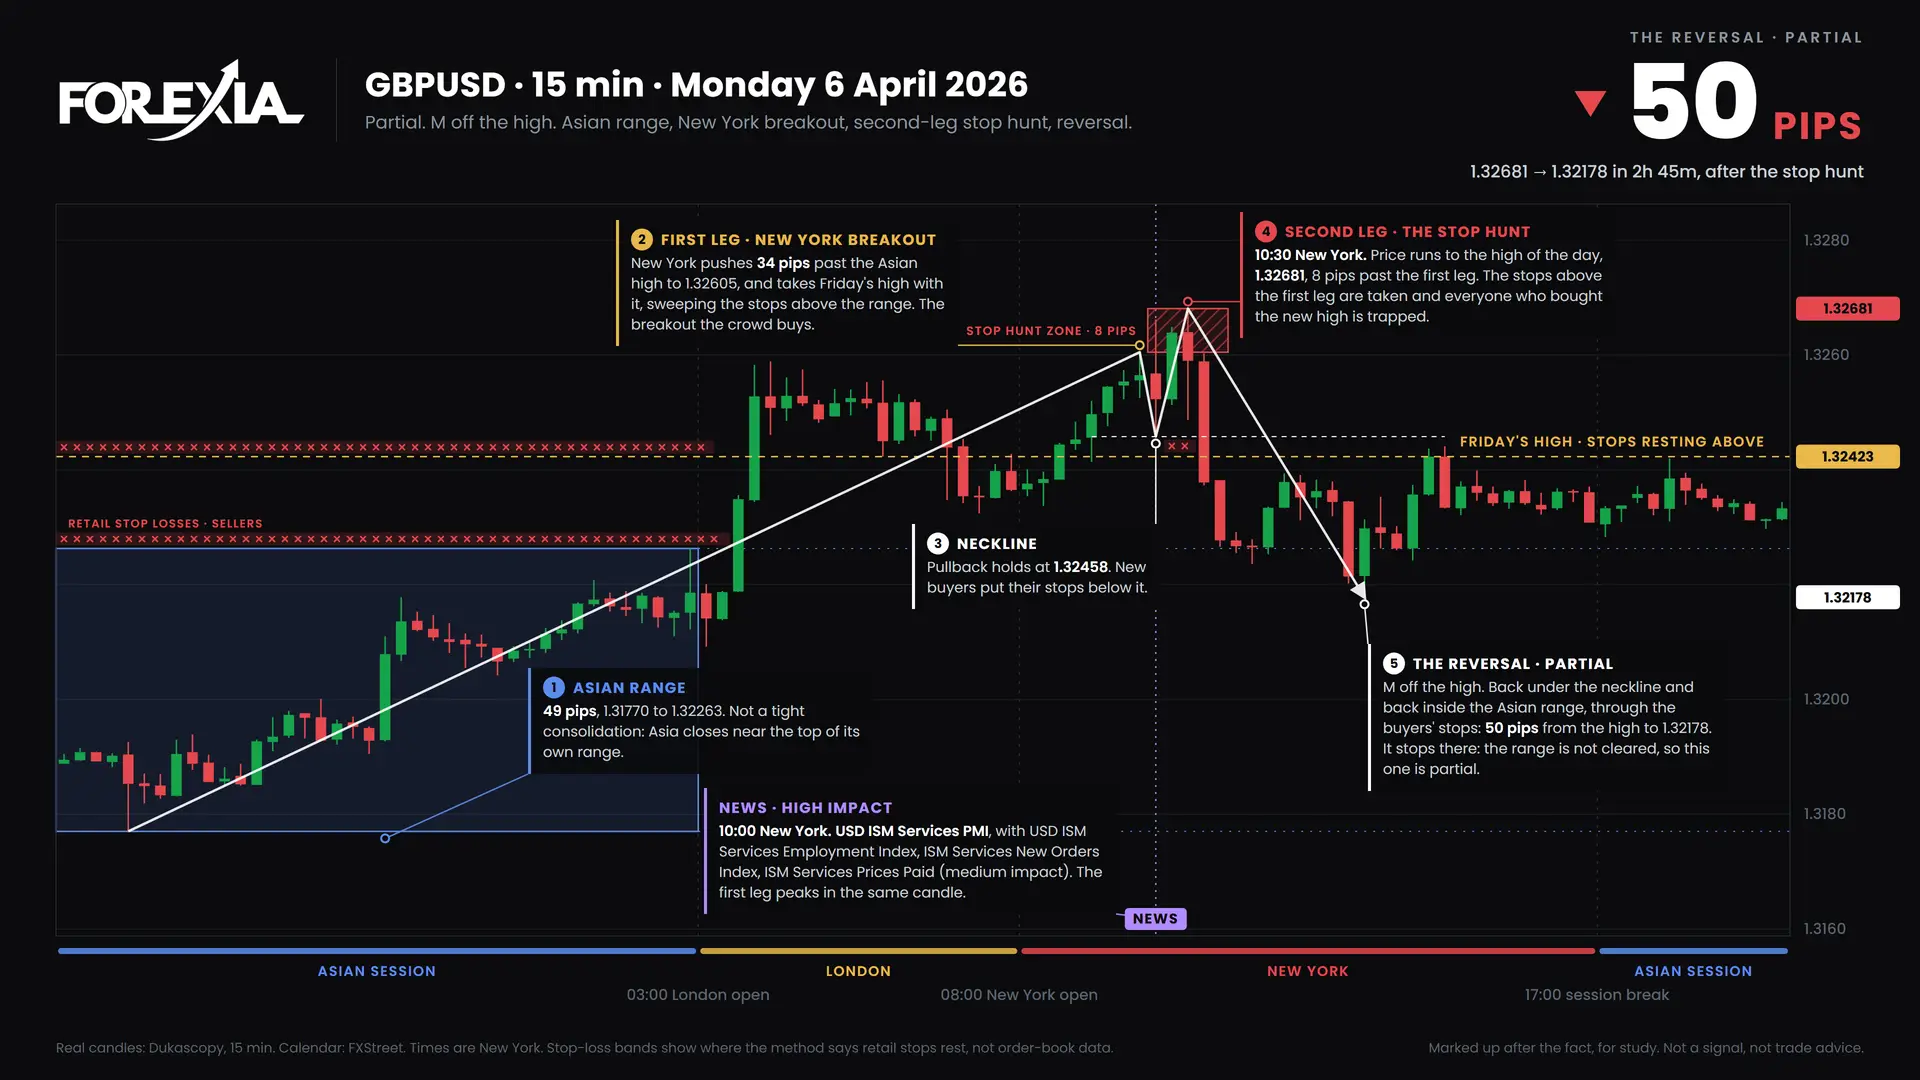
Monday · GBPUSD · M formation (50 pips). The second leg took the stops above the first leg at 1.32681 (10:30 New York); price reversed 50 pips, back inside the Asian range. Confluence 3 of 8. Tuesday traded back through it.
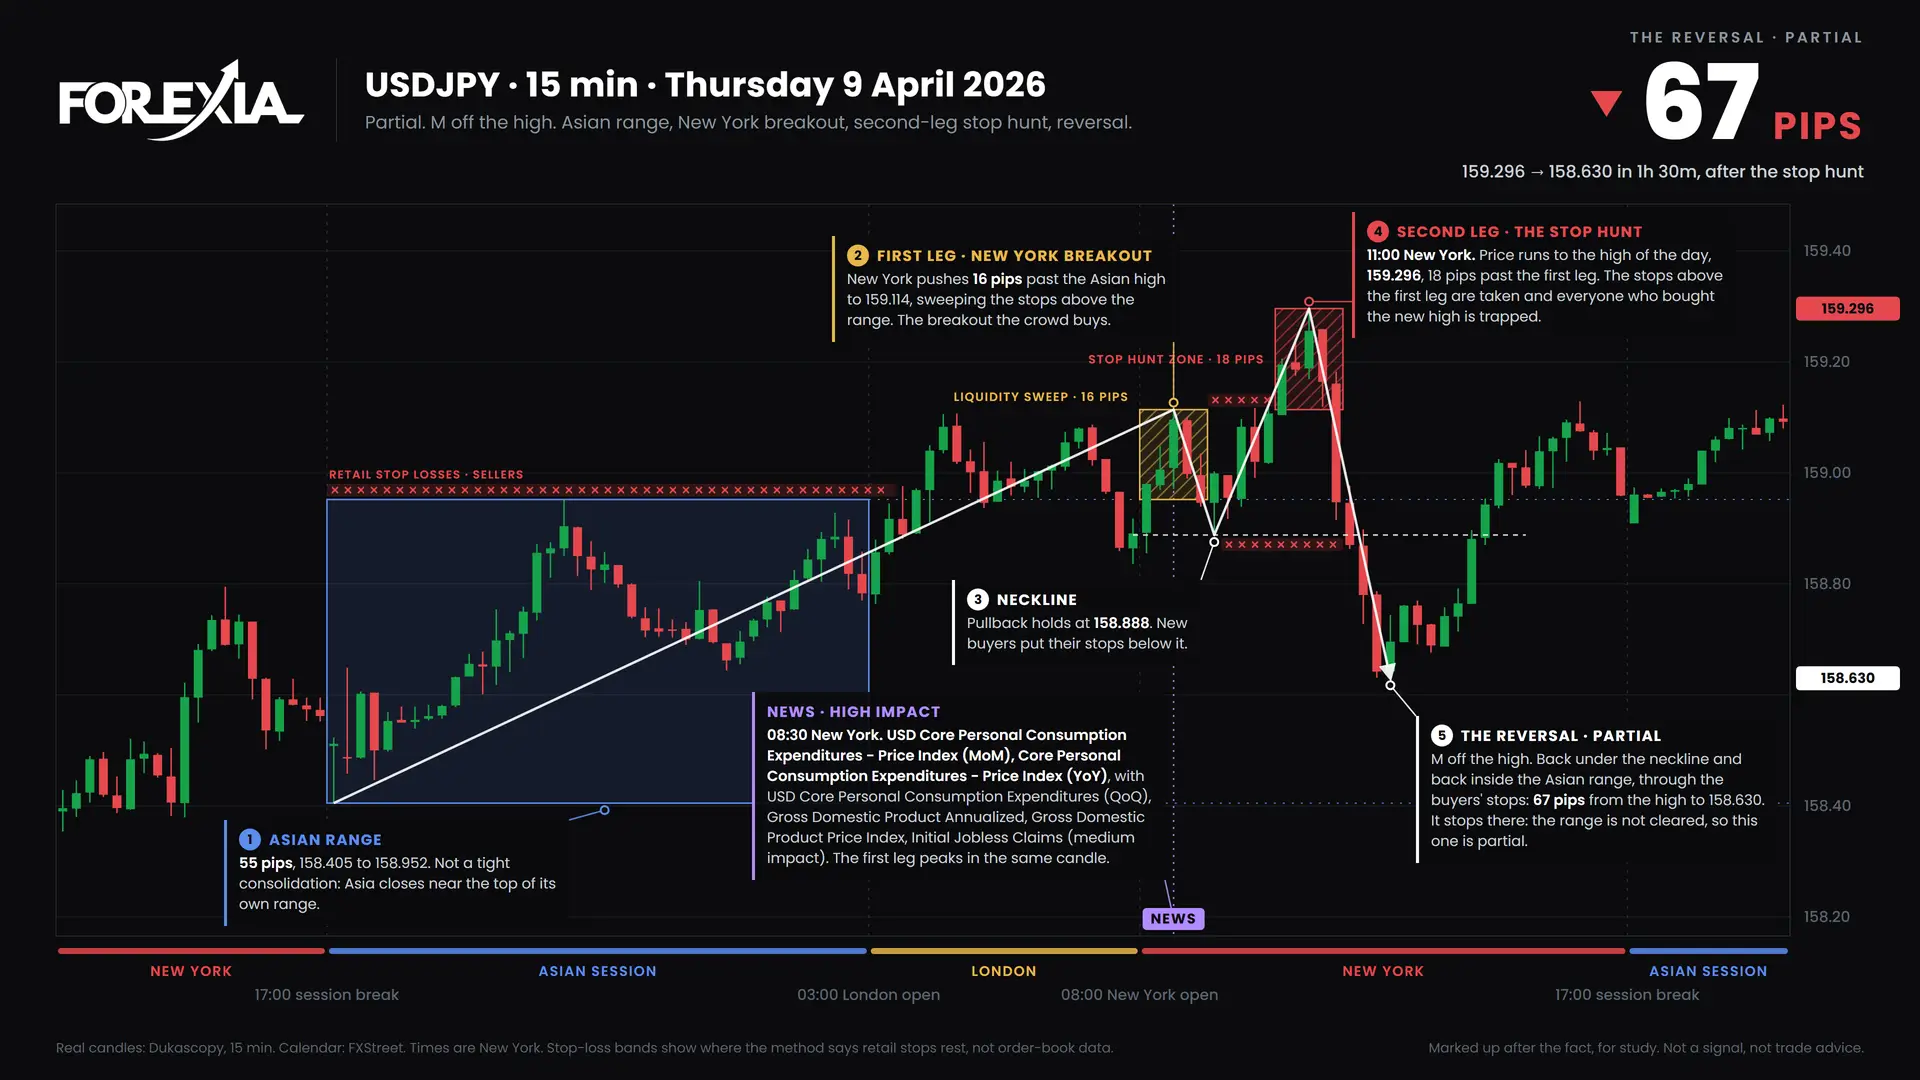
Thursday · USDJPY · M formation (67 pips). The second leg took the stops above the first leg at 159.296 (11:00 New York); price reversed 67 pips, back inside the Asian range. Confluence 1 of 8. Friday traded back through it.
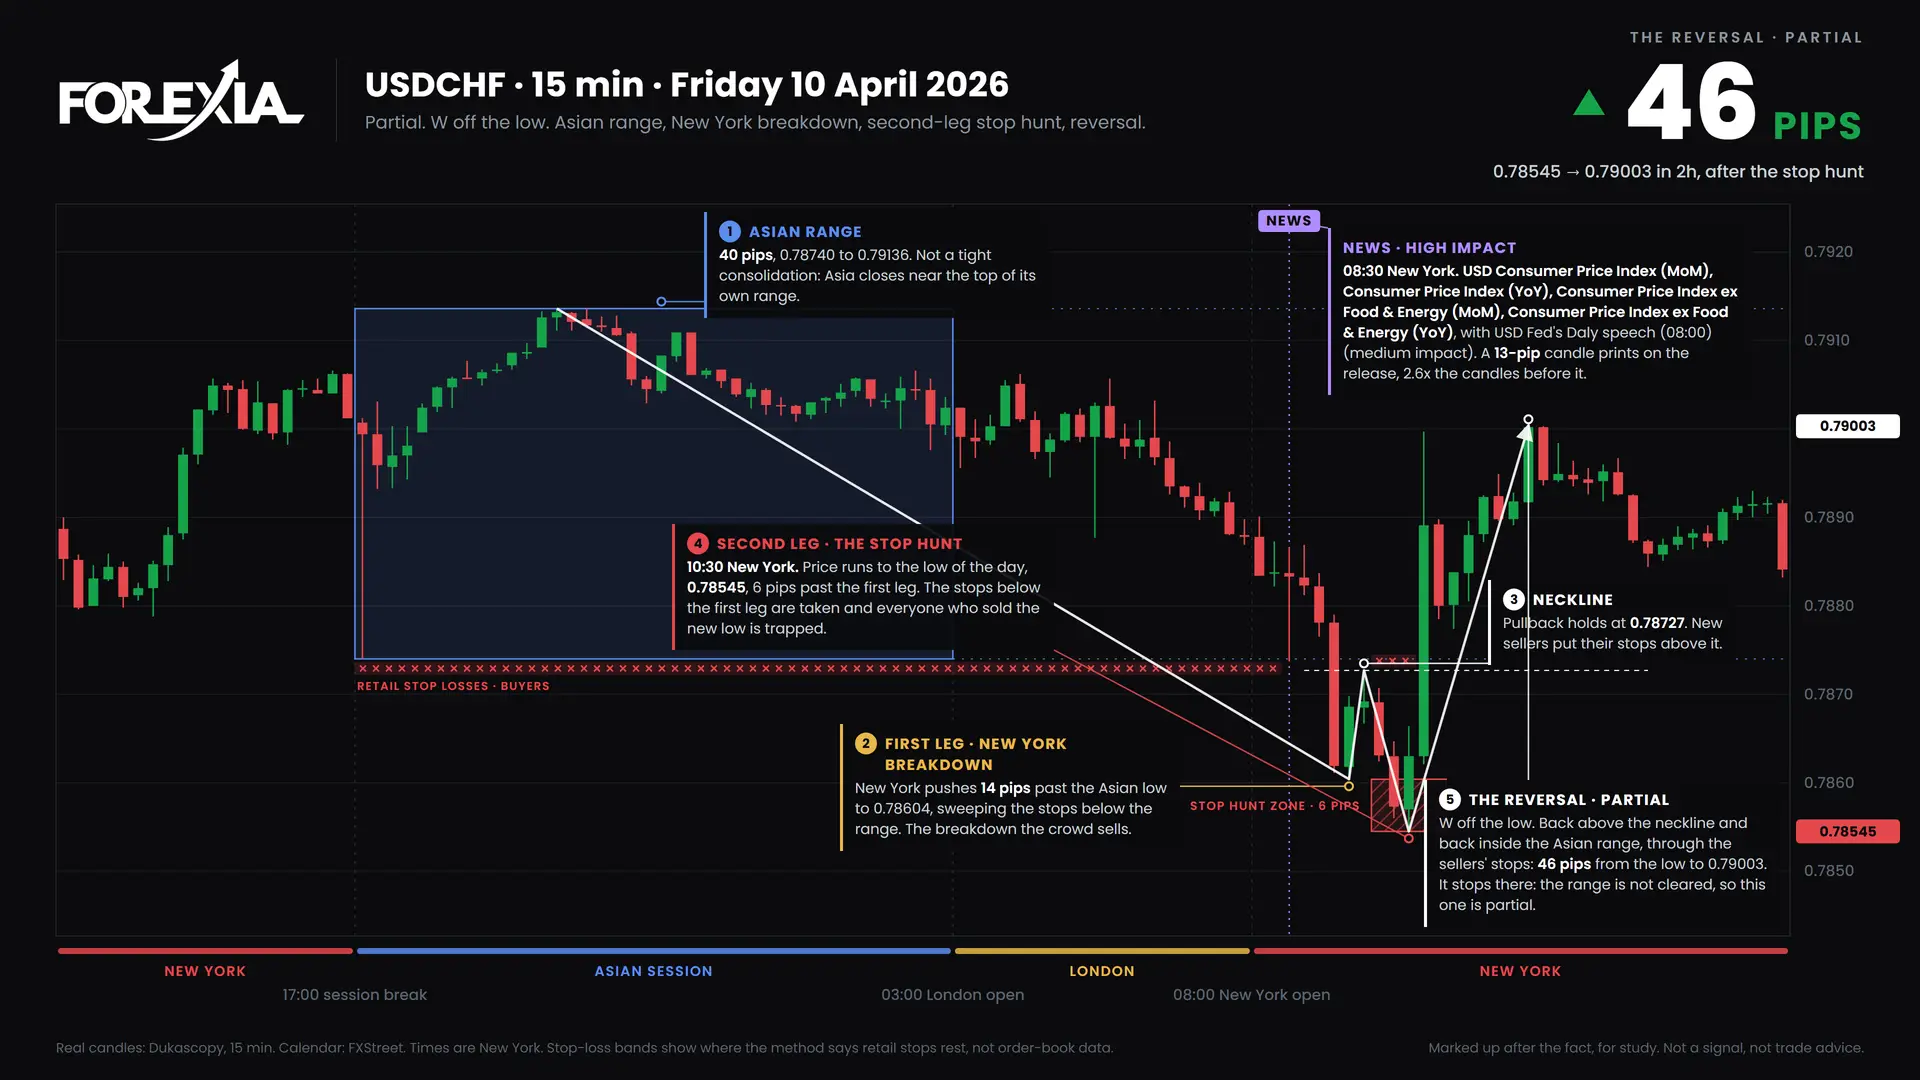
Friday · USDCHF · W formation (46 pips). The second leg took the stops below the first leg at 0.78545 (10:30 New York); price reversed 46 pips, back inside the Asian range. Confluence 3 of 8. It was the low of the week.
Daily and weekly confluence, pair by pair
Each chart pins a pair's daily setups on its hourly chart for the week. The solid line is the move that day, the dashed line is how far it ran before the level was traded back through, and a gold band marks a weekly reversal. The table under each chart ticks the confirmations.
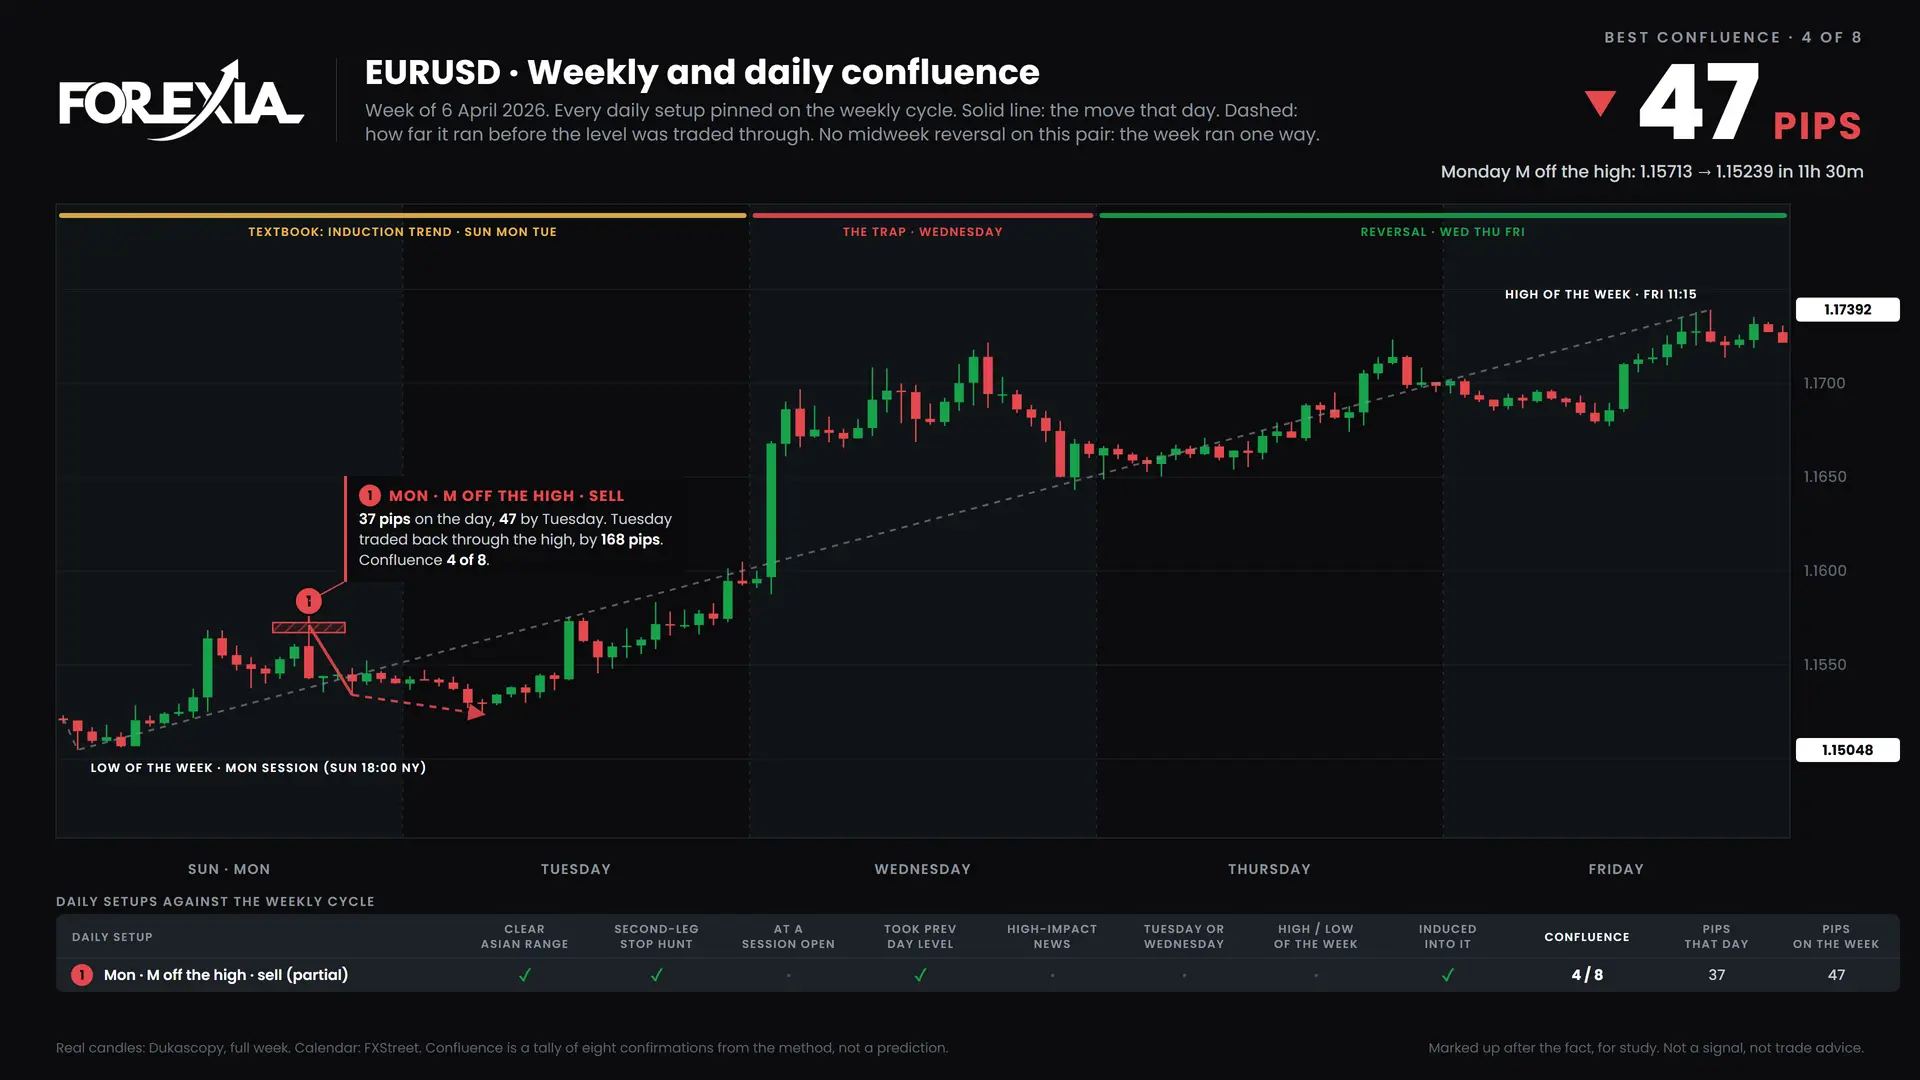
EURUSD. 1 setup, best 4 of 8 (Monday, M off the high). No midweek reversal.
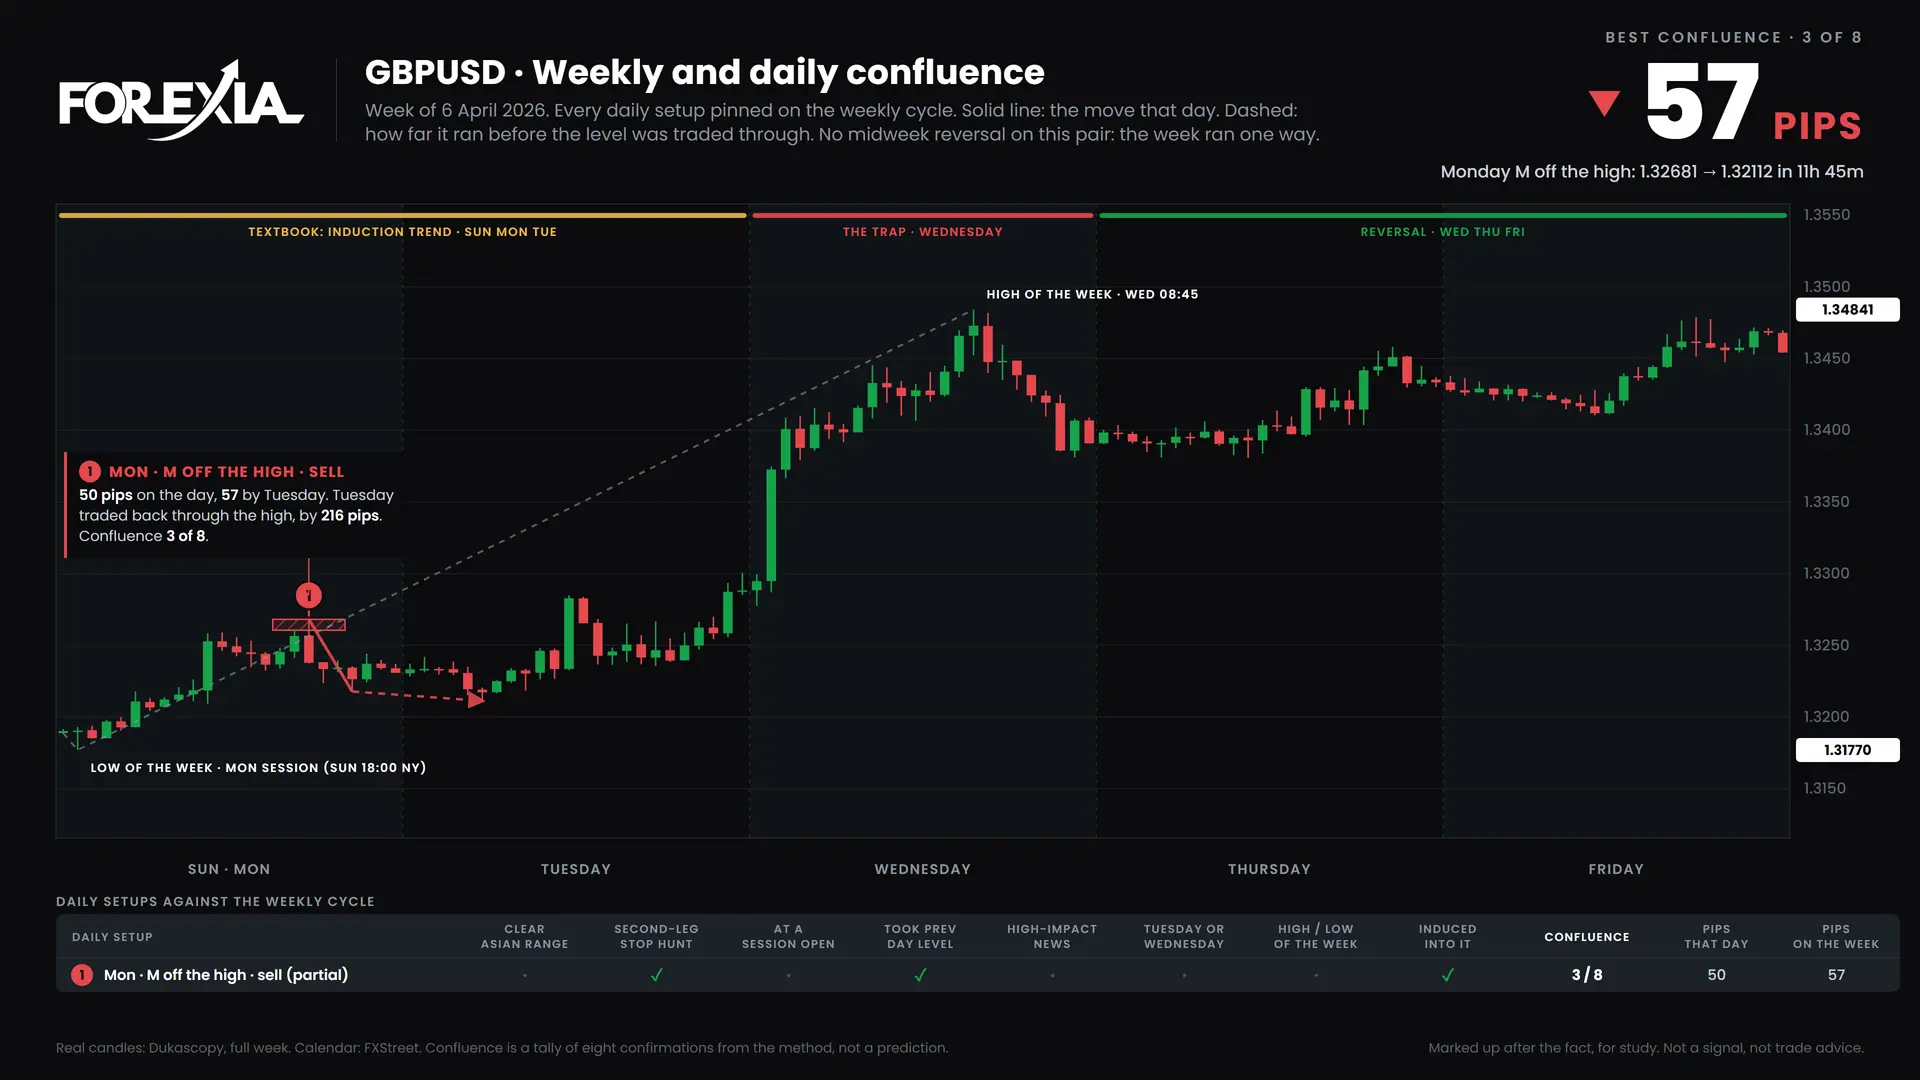
GBPUSD. 1 setup, best 3 of 8 (Monday, M off the high). No midweek reversal.
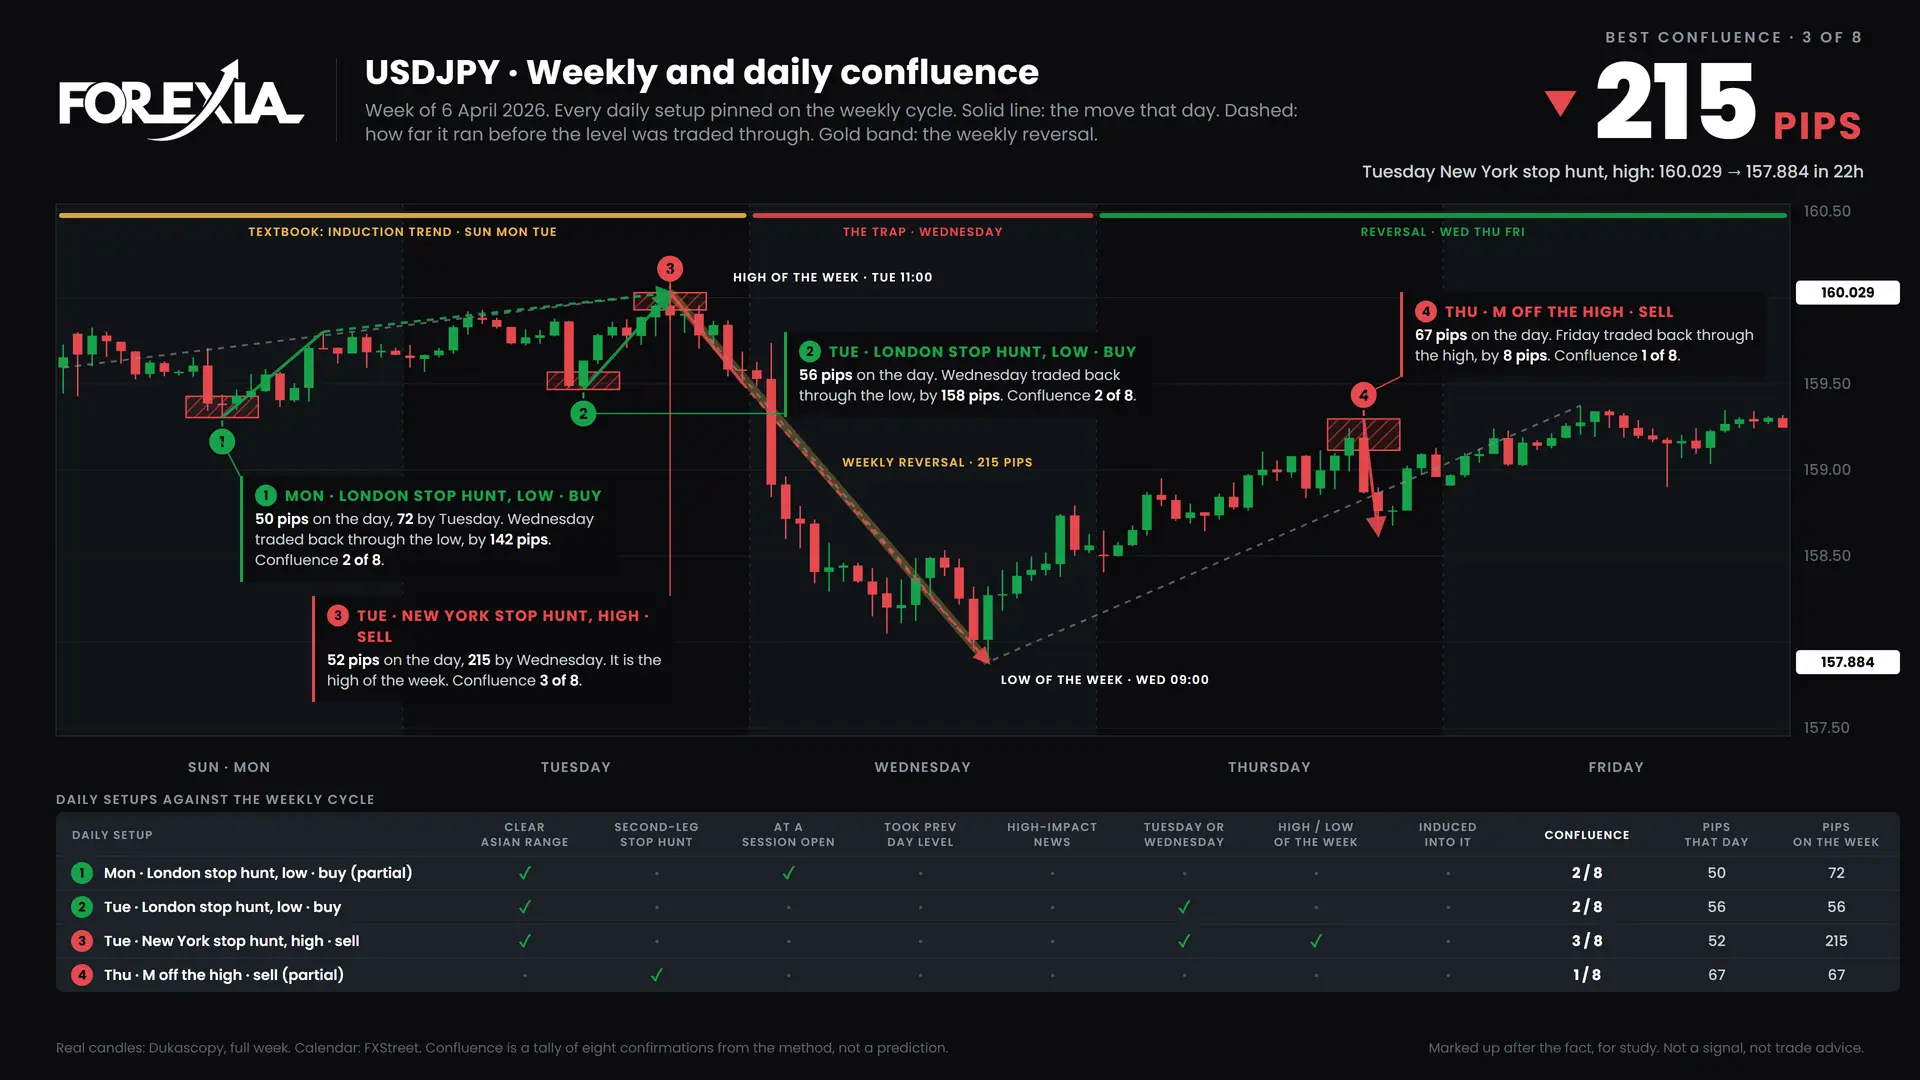
USDJPY. 4 setups, best 3 of 8 (Tuesday, New York stop hunt at the high).
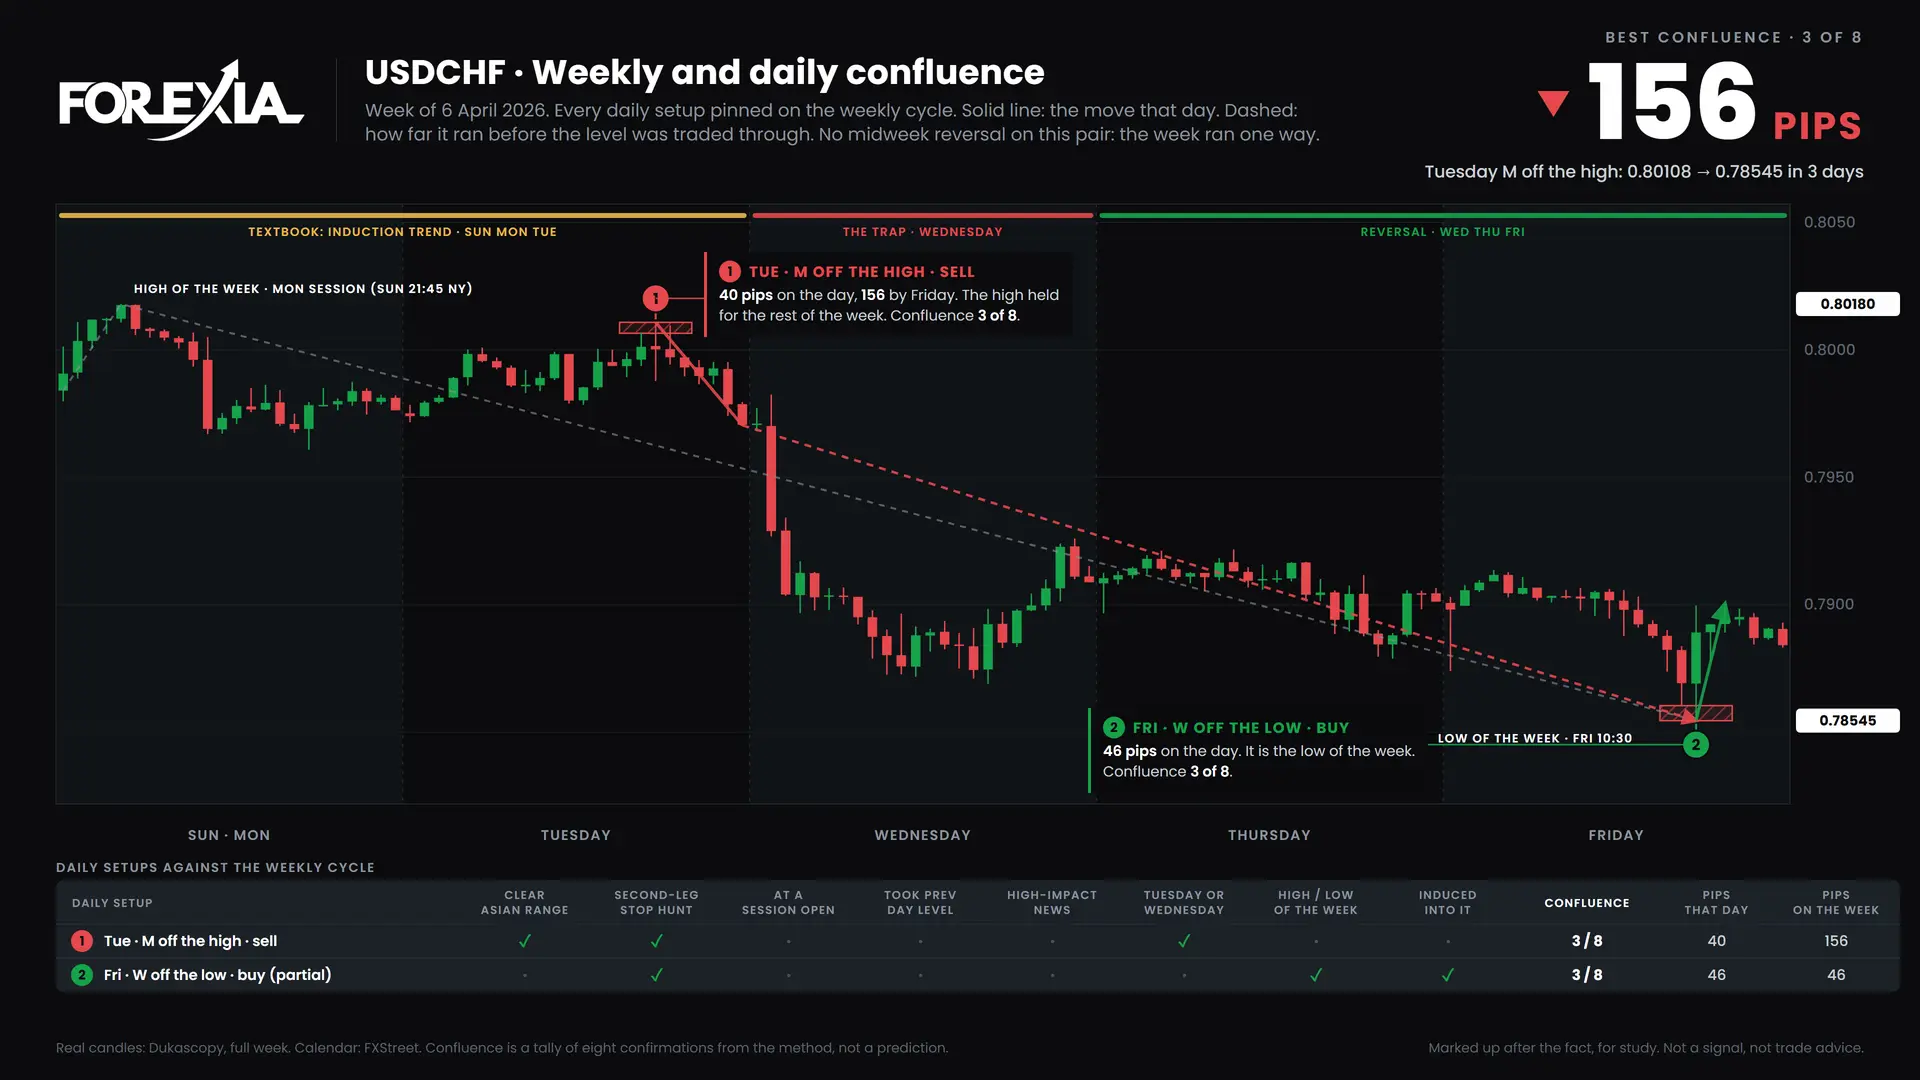
USDCHF. 2 setups, best 3 of 8 (Tuesday, M off the high). No midweek reversal.
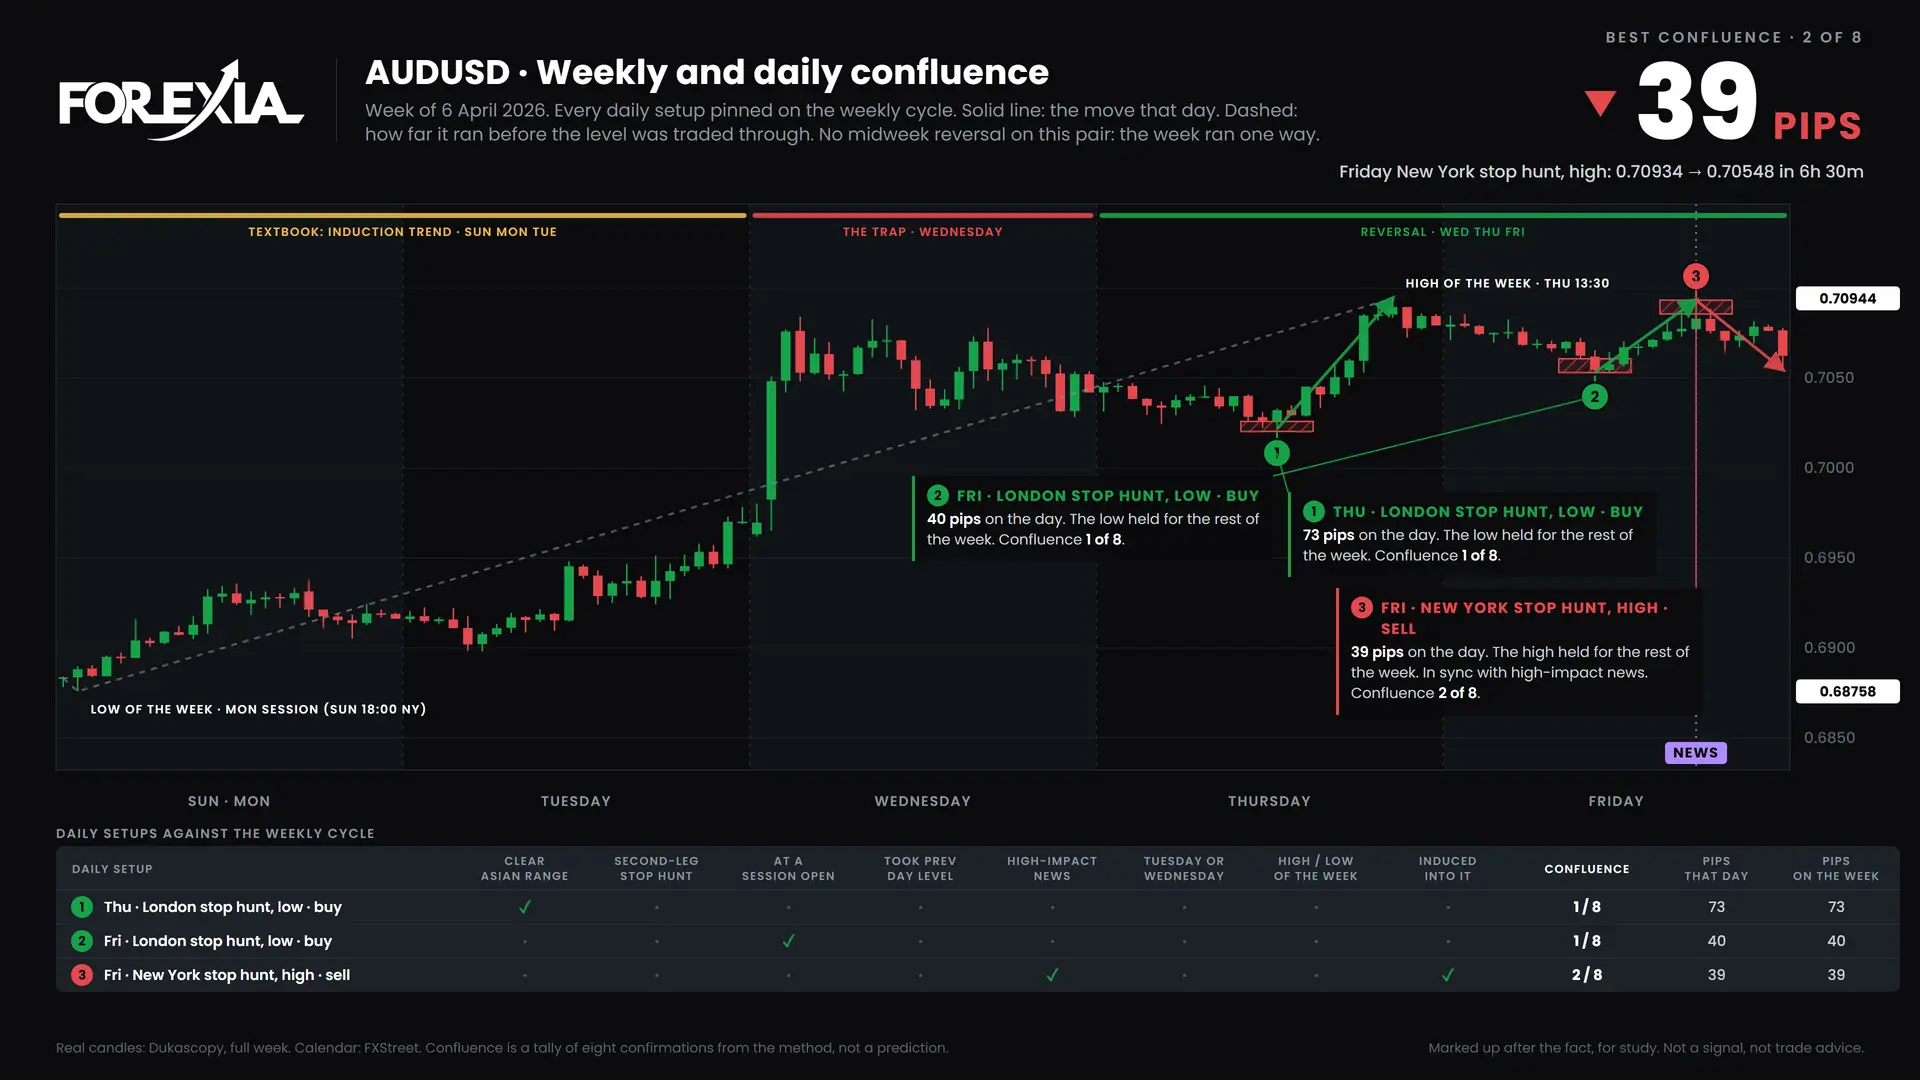
AUDUSD. 3 setups, best 2 of 8 (Friday, New York stop hunt at the high). No midweek reversal.
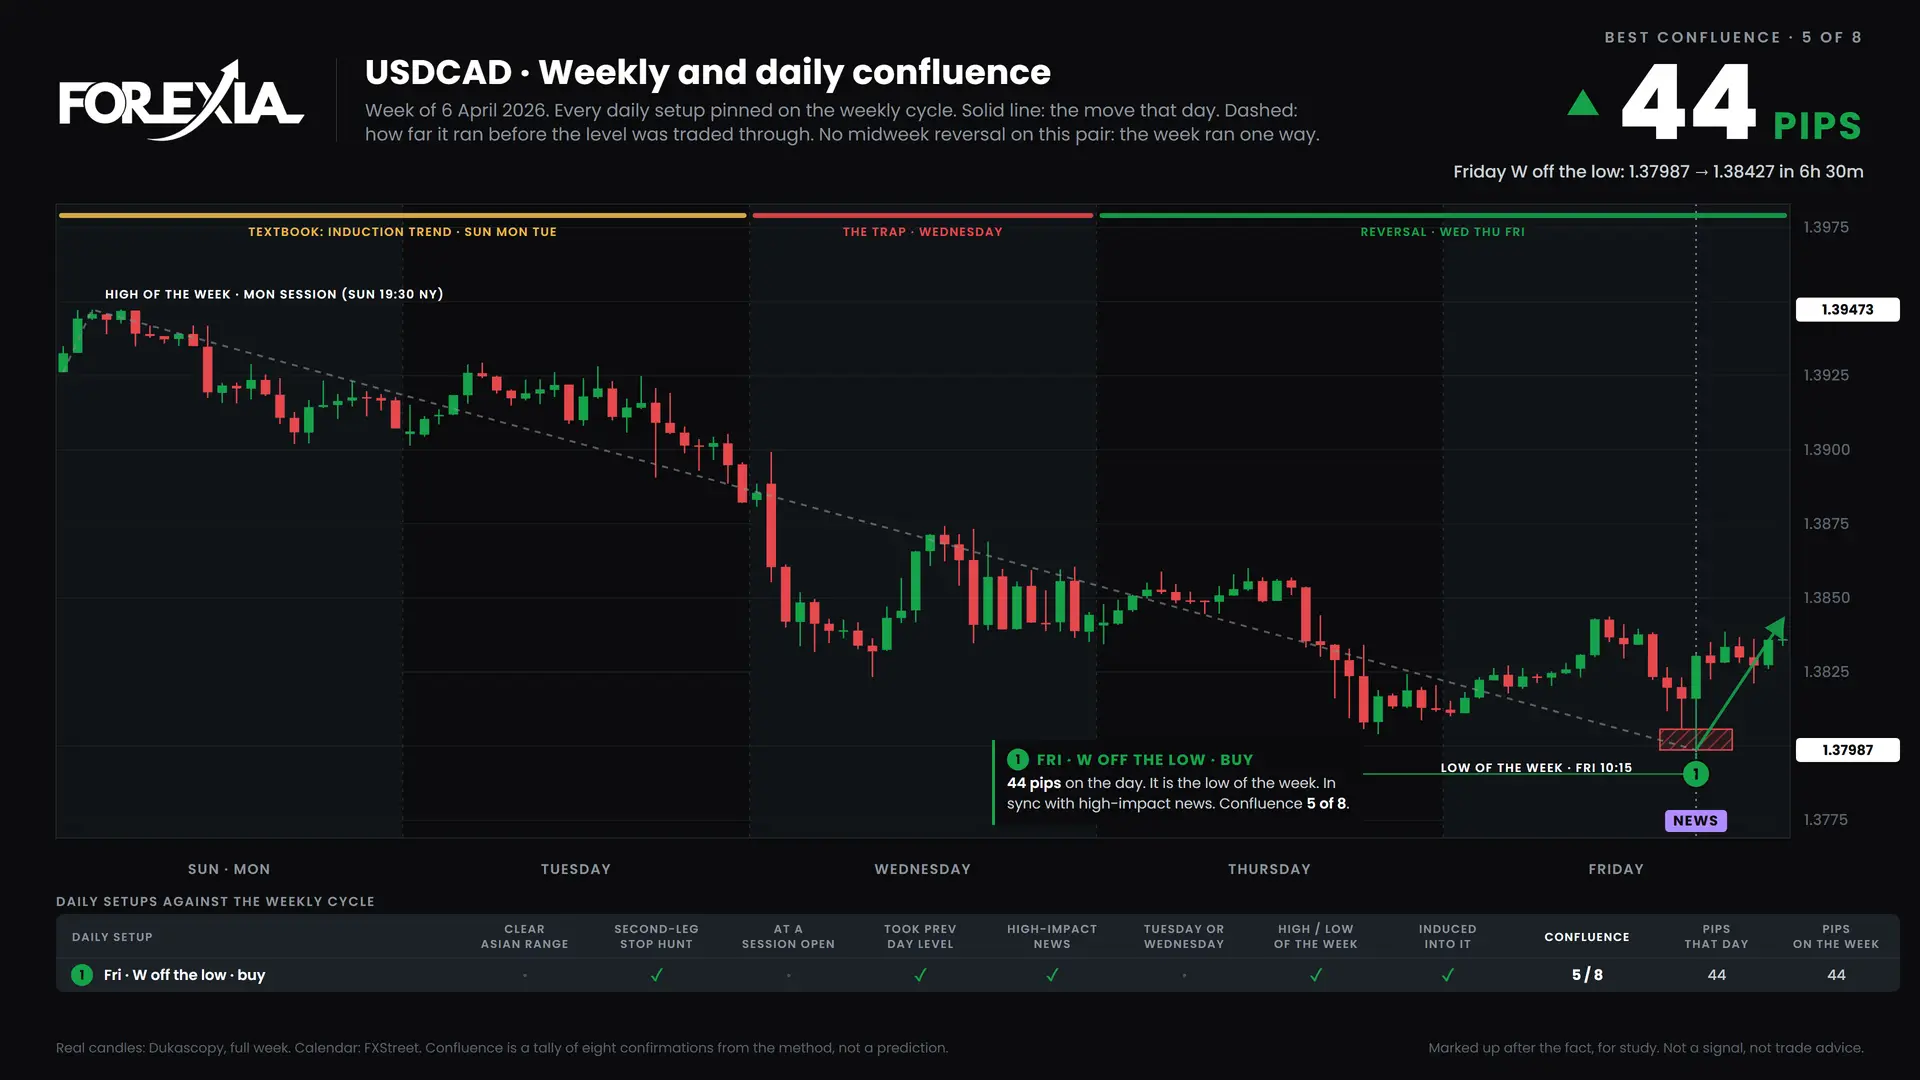
USDCAD. 1 setup, best 5 of 8 (Friday, W off the low). No midweek reversal.
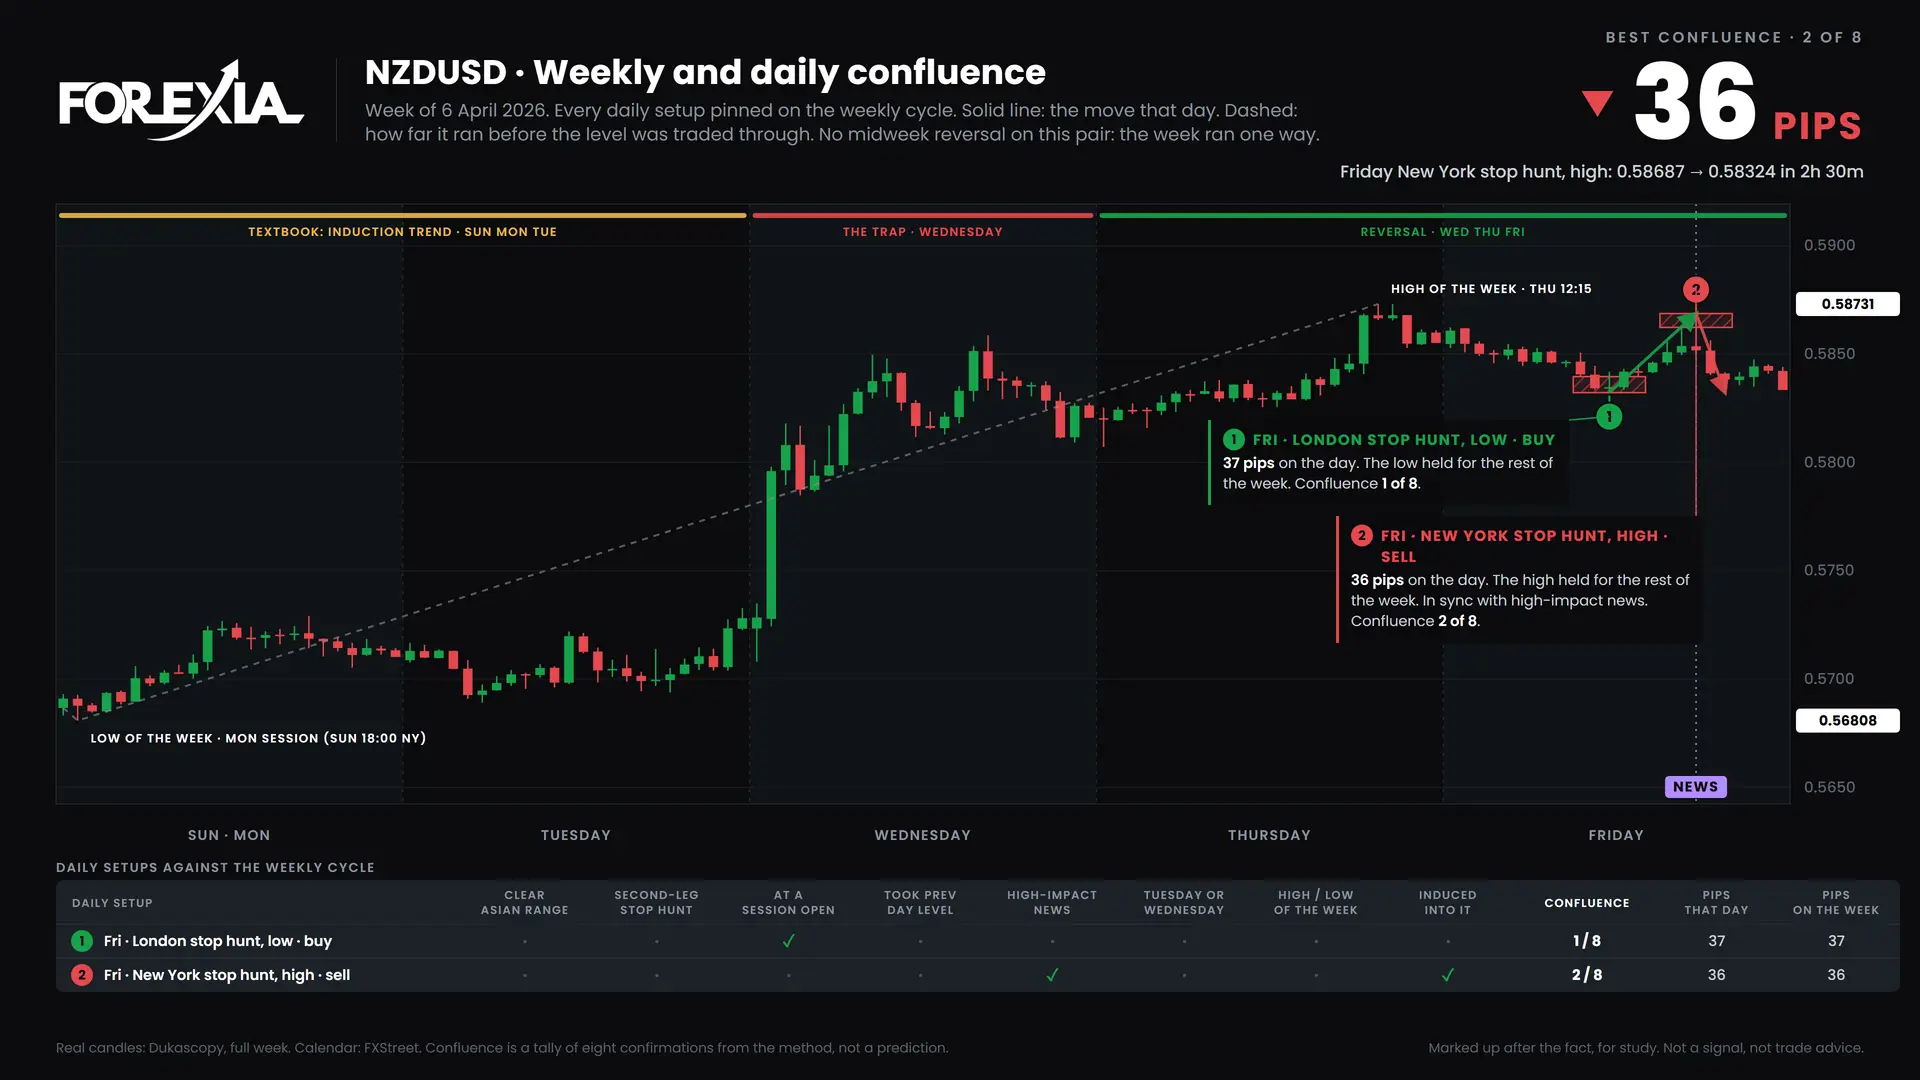
NZDUSD. 2 setups, best 2 of 8 (Friday, New York stop hunt at the high). No midweek reversal.
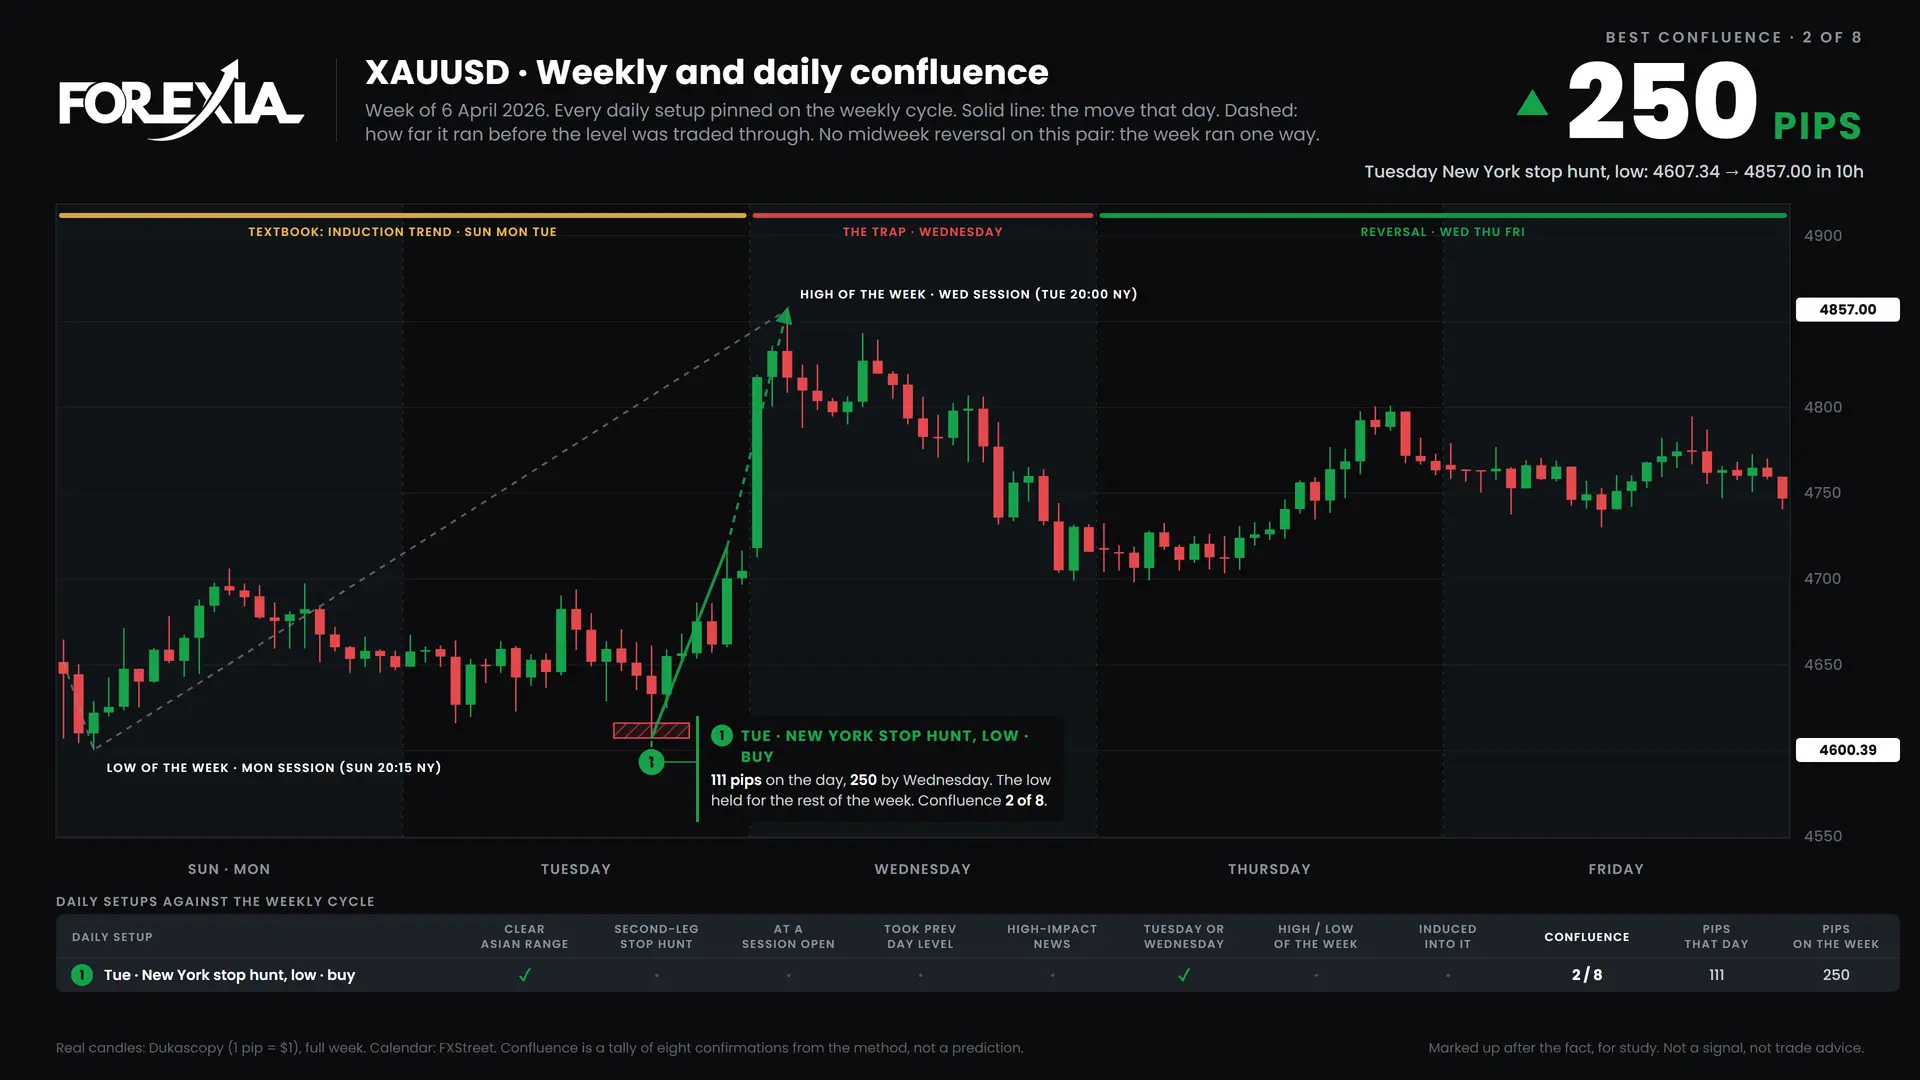
Gold (XAUUSD). 1 setup, best 2 of 8 (Tuesday, New York stop hunt at the low). No midweek reversal.
What this week teaches about reverse price action
A range has two sides, and both sides hold orders. Traders who sold the London break of the Asian low had their stops above the range by lunchtime, and the buyers who chased the New York breakout were trapped at the high of the week. Reverse price action means asking who is positioned at each edge of the range before picking a direction. On USDJPY this week the answer was everyone, and both groups were stopped out within six hours.
On the news itself: the event gives the crowd its reason, and the chart shows where the orders already were.
Frequently asked questions
What was the best forex setup in the week of 6 April 2026?
By confluence, USDCAD on Friday: a W off the low that scored 5 of 8. It moved 44 pips that day and 44 on the week. It was the low of the week.
Was there a midweek reversal in the week of 6 April 2026?
Yes, on 1 of the 8 markets we track: USDJPY. The largest was USDJPY, 215 pips from the high of the week at 160.029.
What does "both sides hunted" mean?
It means the stops above the Asian high and the stops below the Asian low were both taken on the same day. One session hunts one side, the reversal runs through the whole range, and the other side is hunted before the day picks a direction.
What is the Asian range?
The Asian range is the consolidation between the 17:00 New York session break and the London open. Retail traders mark its high and low as resistance and support, so stops collect on both sides. London and New York then hunt one side, or both.
Related chart markups
- Next week: EURUSD M formation, week of 13 April 2026
- USDJPY midweek reversal, week of 27 July 2026: the same stop hunt on USDJPY
- USDCAD stop hunt, week of 20 April 2026: another stop hunt, on USDCAD
- USDCAD BoC stop hunt, week of 27 April 2026: another stop hunt, on USDCAD
- All forex chart markups, week by week
- How to Read a Forex Chart Markup: what every mark on these charts means
Learn to read the chart this way. The Forexia Academy courses cover the Asian range, M and W formations and the weekly cycle step by step. Browse the courses.
These chart markups are made after the fact, for study. They are not signals and not trade advice. Candles: Dukascopy. Economic calendar: FXStreet. All times are New York. Stop-loss positions are the method's reading of the structure, not order-book data.
Share this post
Related Posts
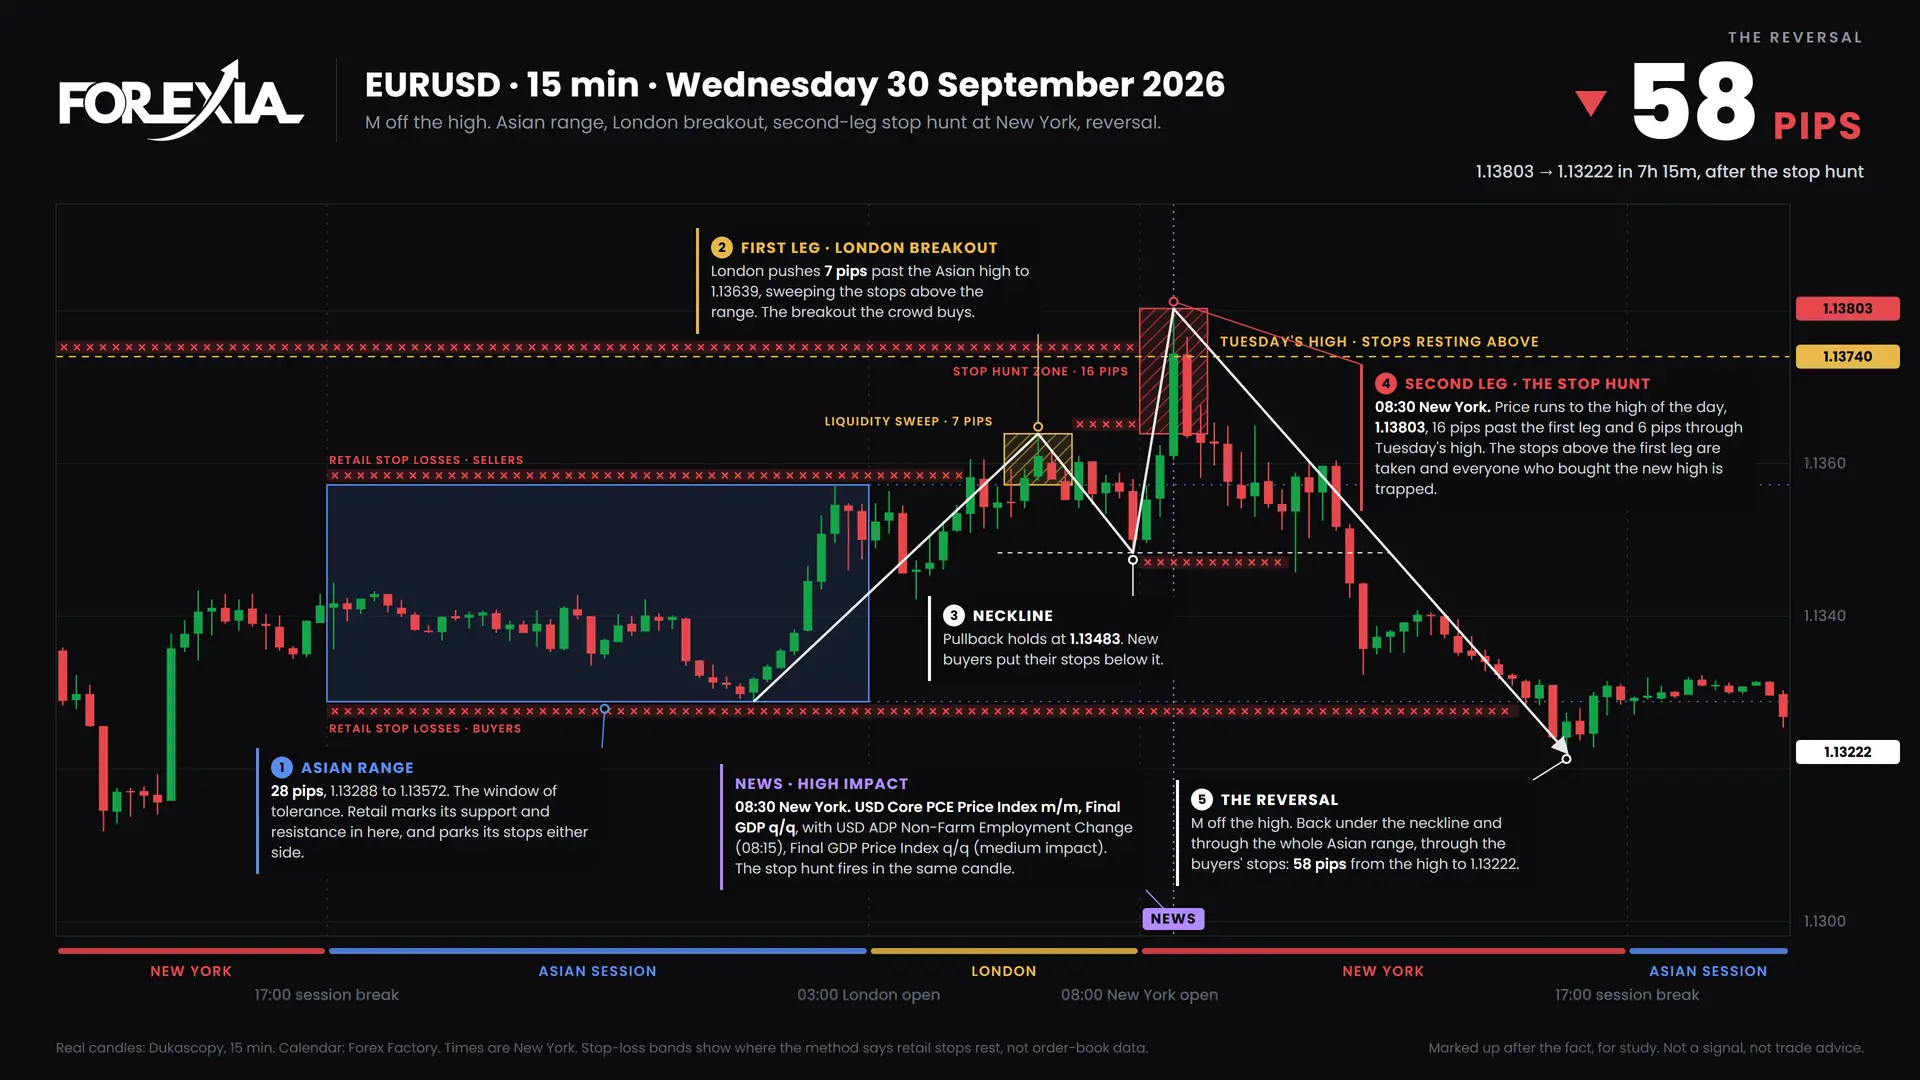
Reverse Price Action: How to Read a Forex Chart Markup
Reverse price action reads a chart from the side of the crowd: where retail orders and stop losses sit, and how price collects them. A visual guide.
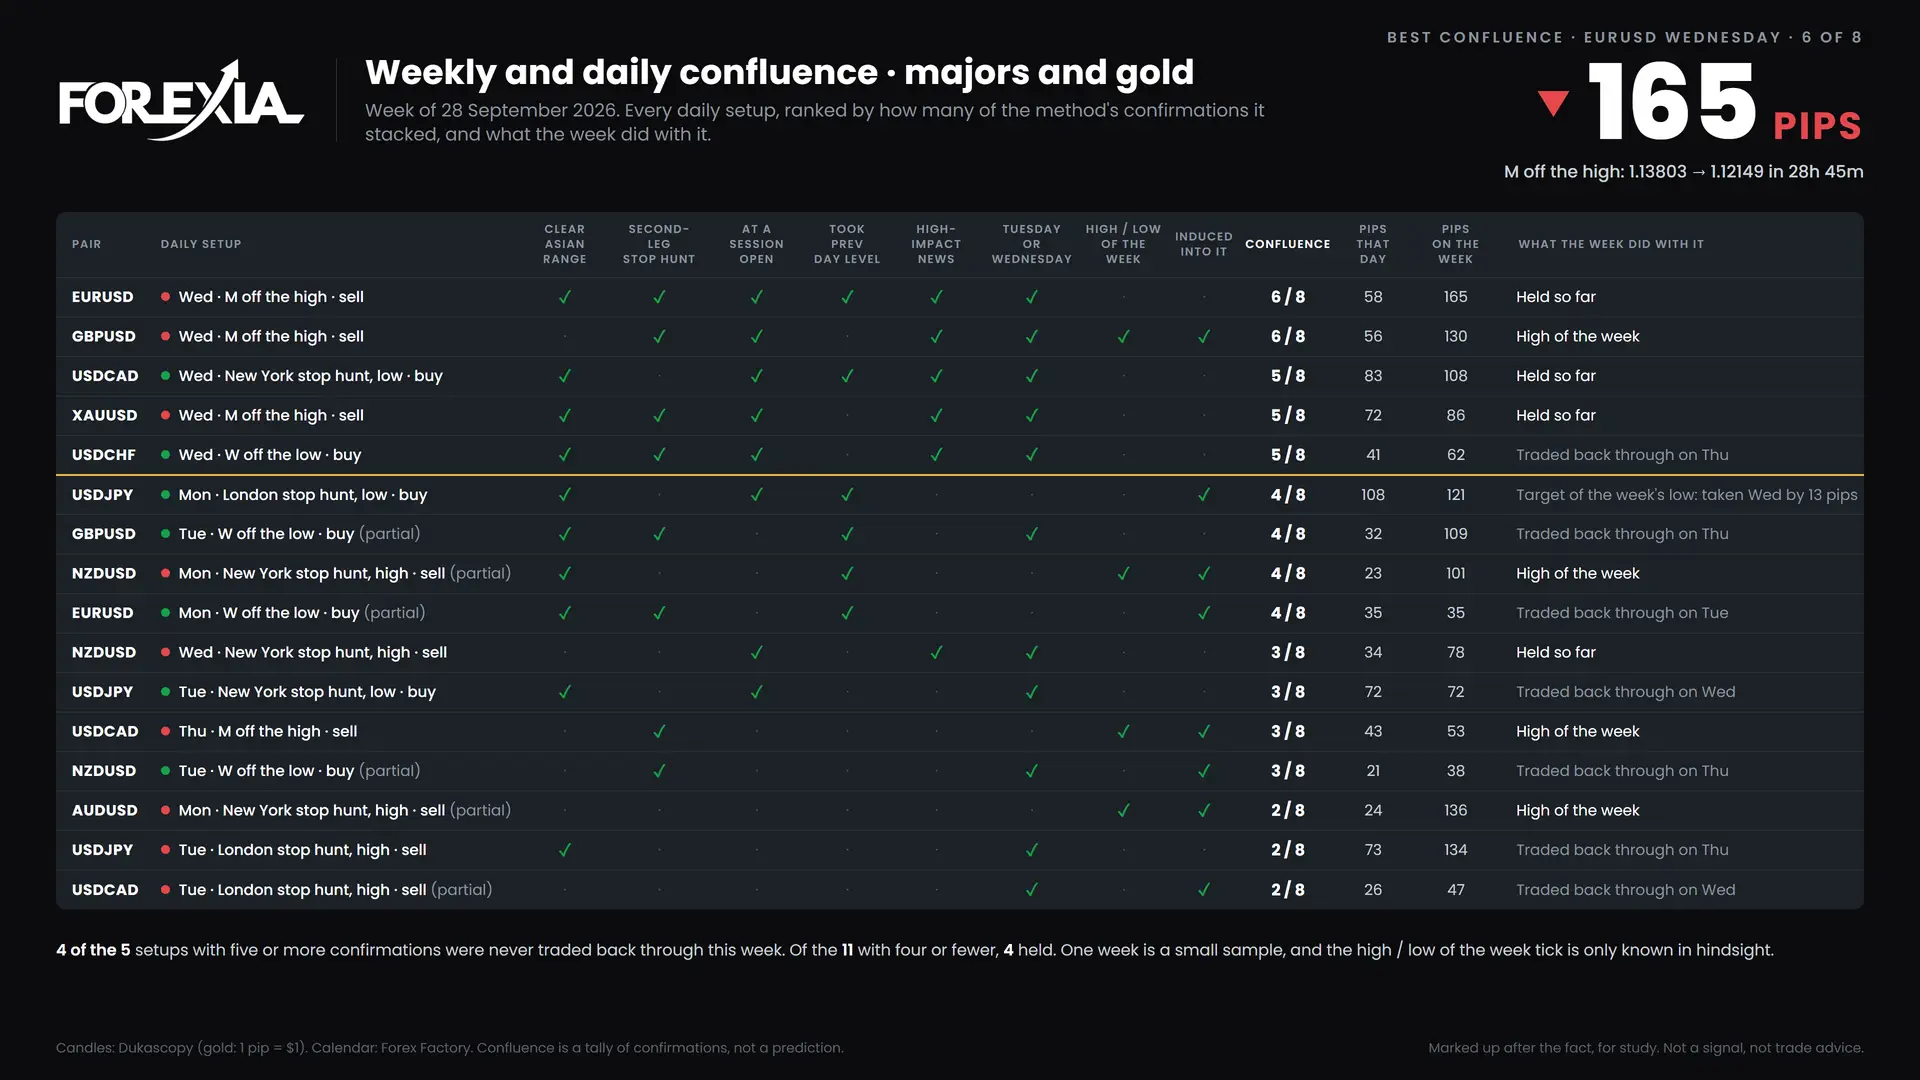
Forex Chart Markups: Weekly Stop Hunt & Reversal Archive
Forex chart markups, week by week: stop hunts, M and W formations and midweek reversals on the majors and gold, drawn on real candles.

EURUSD Stop Hunt: Forex Chart Markups, 28 September 2026
An EURUSD stop hunt through Tuesday's high on US PCE data completed an M formation and fell 165 pips. Chart markups, 28 September 2026.