Where Is Liquidity on a Chart? Just Past the Lines the Crowd Draws
Dylan Forexia8 min read
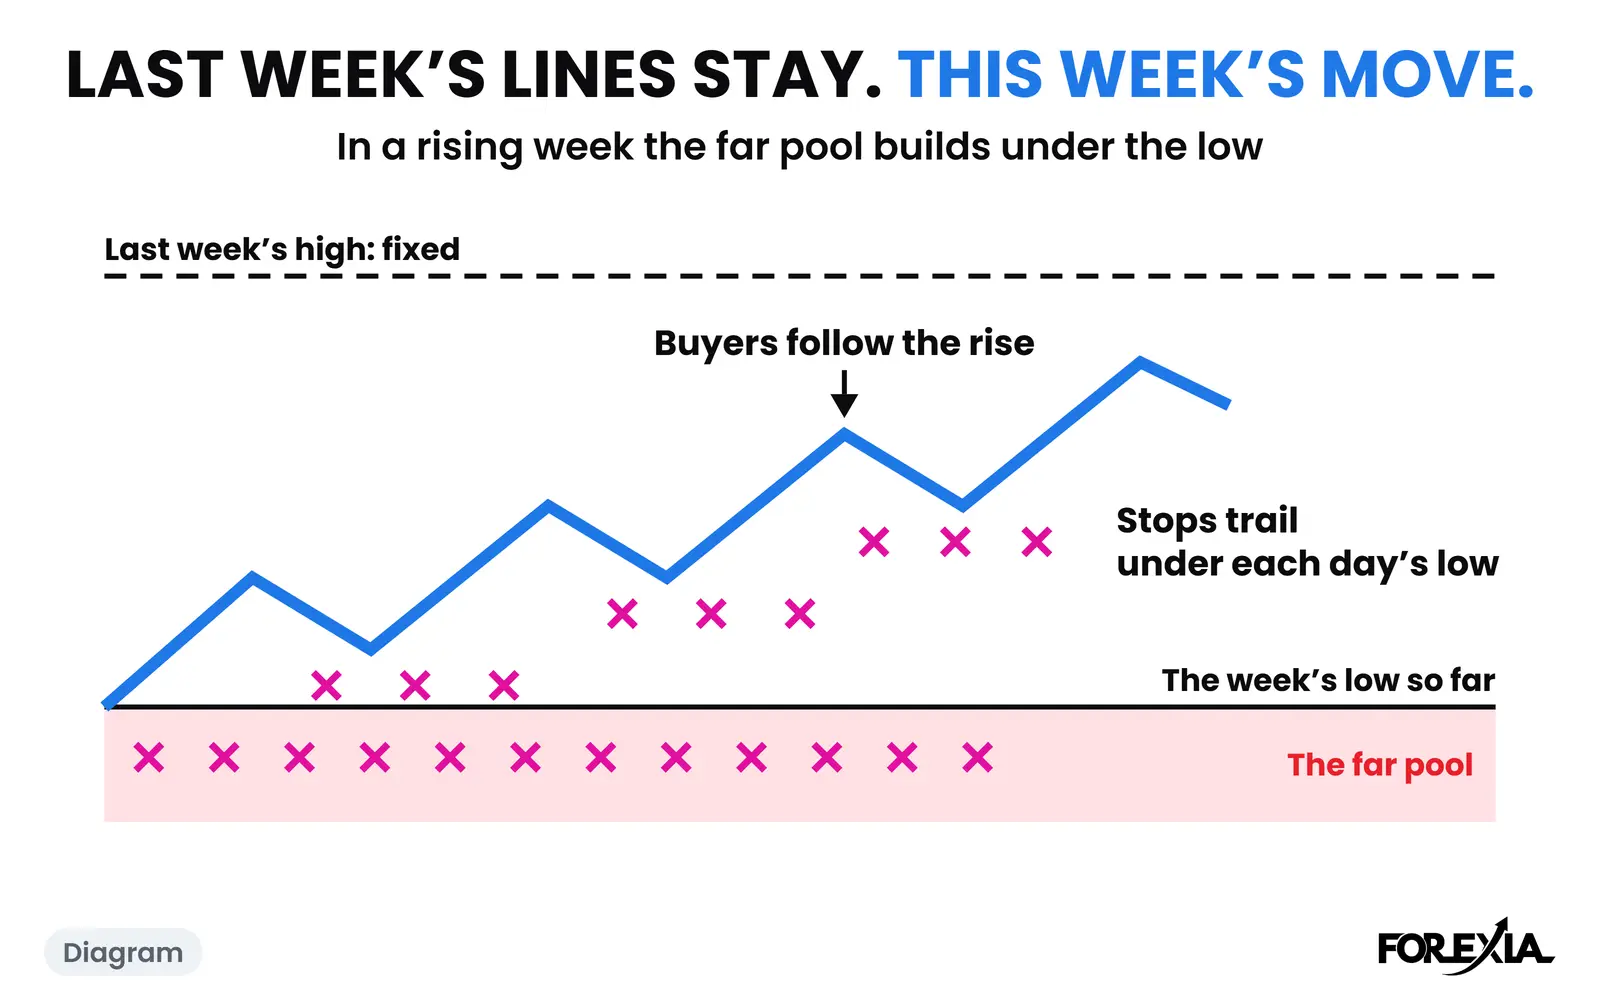
Liquidity on a chart sits just past the levels every trader can see: above highs and resistance, below lows and support. Traders enter at those lines and leave their stops beyond them, and we read the stop as the order that pays, because that is where the orders a big player needs are waiting.
Nobody can see those orders, so all of this is a reading of the structure. Here it is on three real days, followed order by order.
Where is liquidity on a chart?
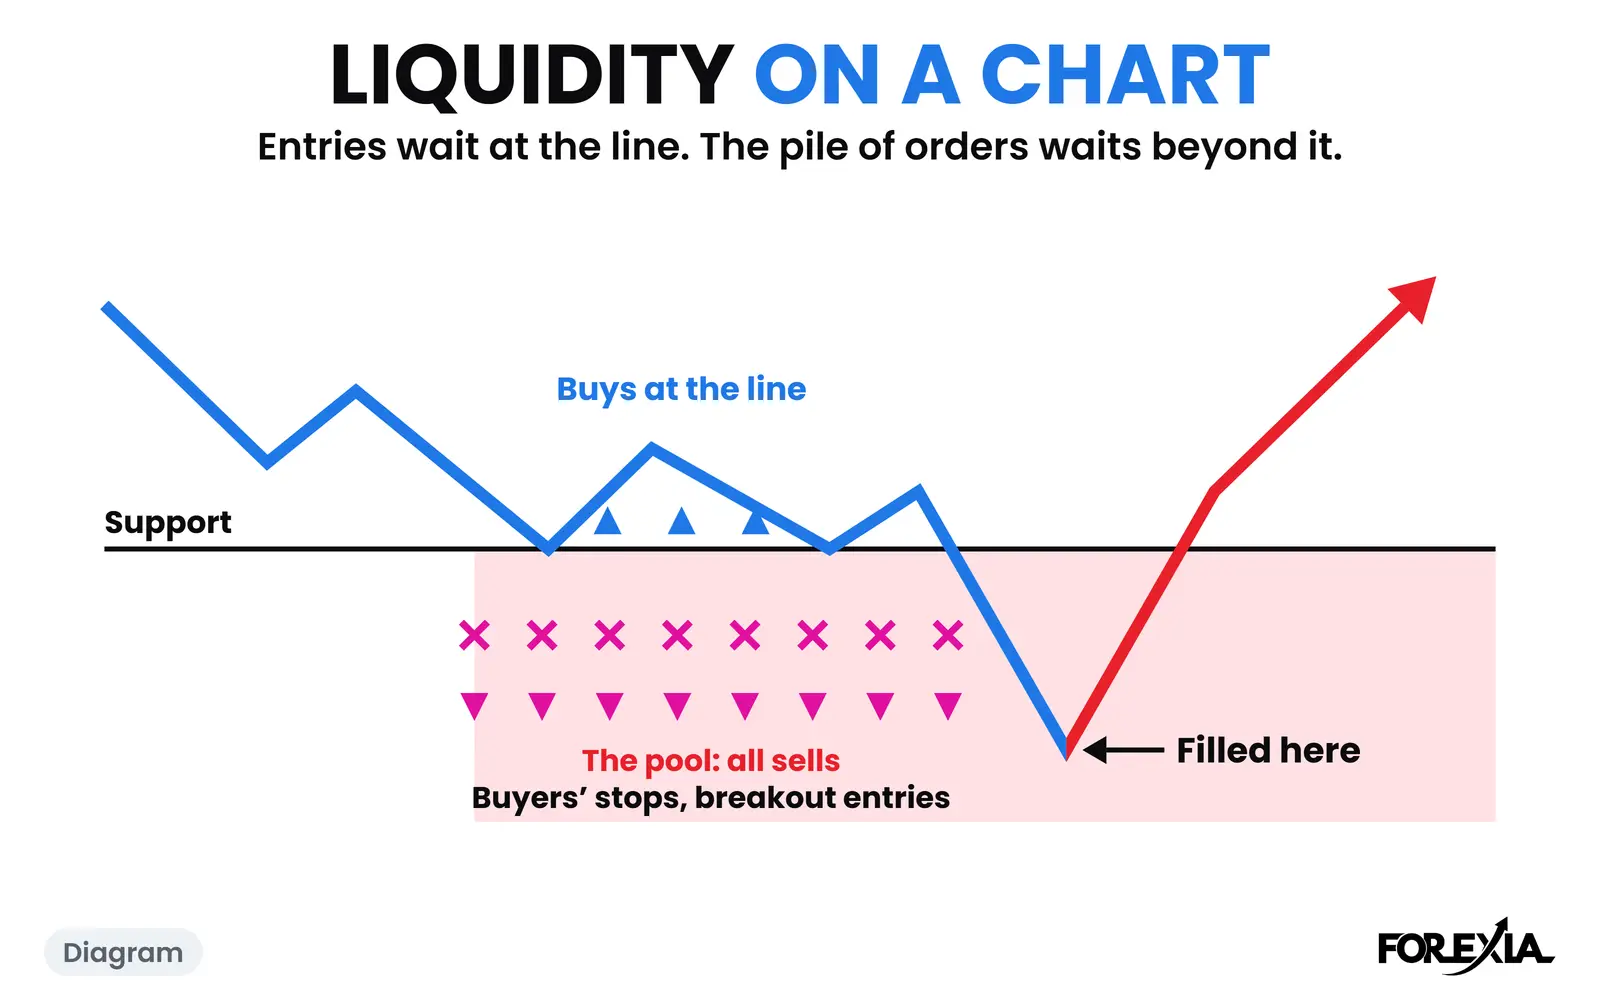
It is past the lines the crowd draws, and which way it points depends on the side of the line. Liquidity means orders you can trade against. A trader with size to fill looks for many orders pointing the other way in one place, and the textbook puts them there.
| The line | The order at the line | The orders past the line |
|---|---|---|
| Support, or a low | Buyers' entries | All sells: buyers' stops and breakout sellers' entries |
| Resistance, or a high | Sellers' entries | All buys: sellers' stops and breakout buyers' entries |
A stop is an order that has not fired yet: a stop order becomes a market order once price reaches it. A buyer's stop is a sell, so a stop and a breakout entry past the same line are the same order, placed by two people who disagree. Why stops pile up there has its own page, and so does which highs and lows count as obvious.
Guides also list equal highs and lows, trendlines and round numbers. Round numbers have the only hard evidence we know of. A New York Fed staff report read one dealing bank's order book and found stop-loss sell orders clustered just below round numbers and stop-loss buy orders just above. The data is decades old and comes from one bank. For the rest we have no count.
What is a liquidity pool in forex?
A liquidity pool, on a chart, is the group of orders resting together just past a level. The word has two other meanings. A broker's liquidity pool is the banks and firms quoting it prices, and a crypto liquidity pool is tokens held in a contract. A chart shows neither.
Using the chart's structure to work out where the pool is we call Liquidity Visualization. Marking it before the session we call Liquidity Mapping. Both are readings: spot forex trades over the counter, so no public book shows any of it.
Why is the stop the order that pays?
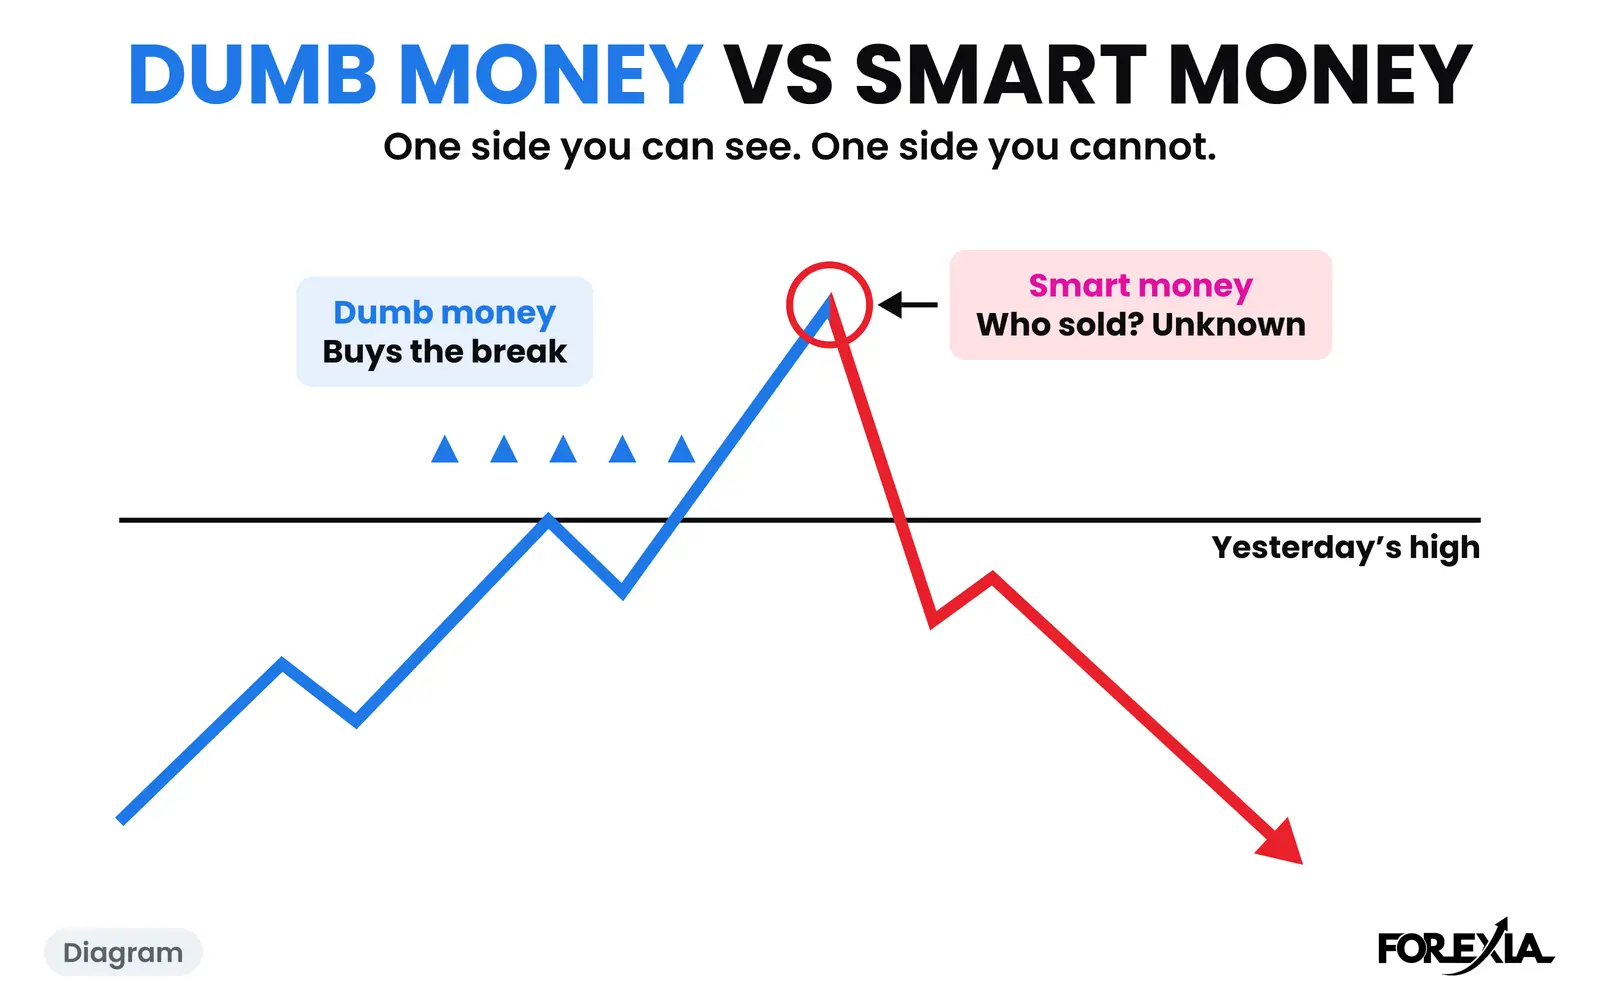
Because a big buyer cannot fill against other buyers. We read the entry at the line as competition: more people wanting the same side at the same price. The pool past the line is the opposite, a pile of sells that all arrive when price gets there. A large buy order can fill against them without chasing the price up. When price goes in to take those orders we call it the stop hunt, which most traders call a liquidity sweep.
That is our read of why the move happens. The chart can show that it happened, and cannot show who did it or why.
A buyer's line: AUD/USD, Tuesday 25 August 2026
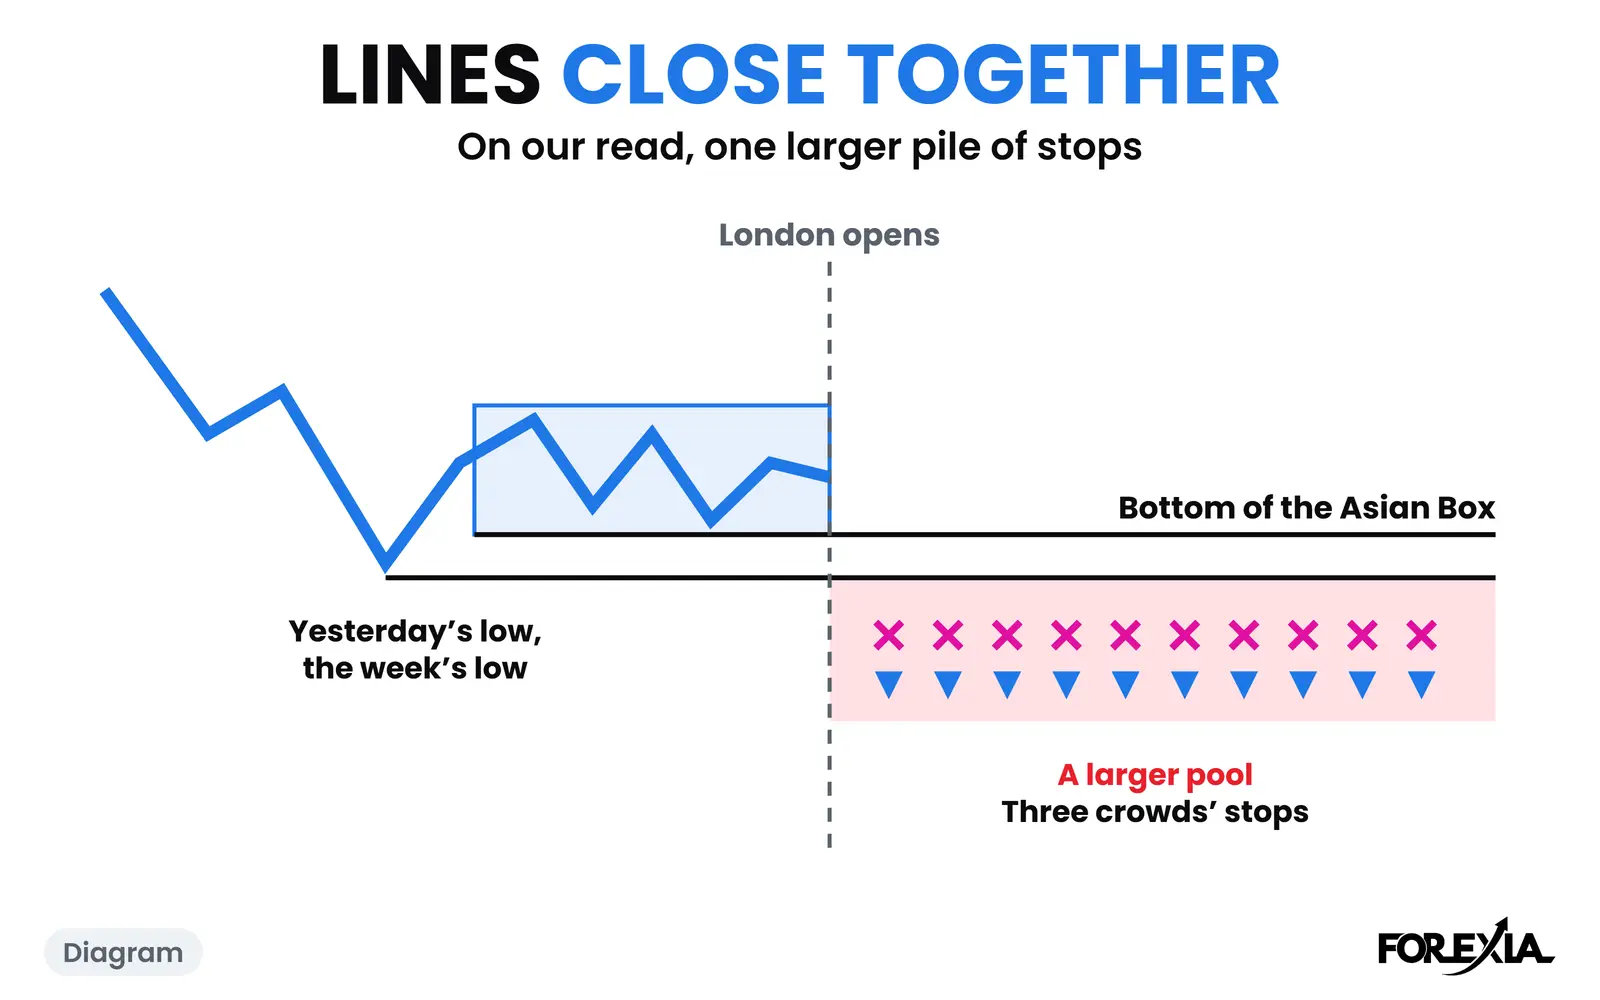
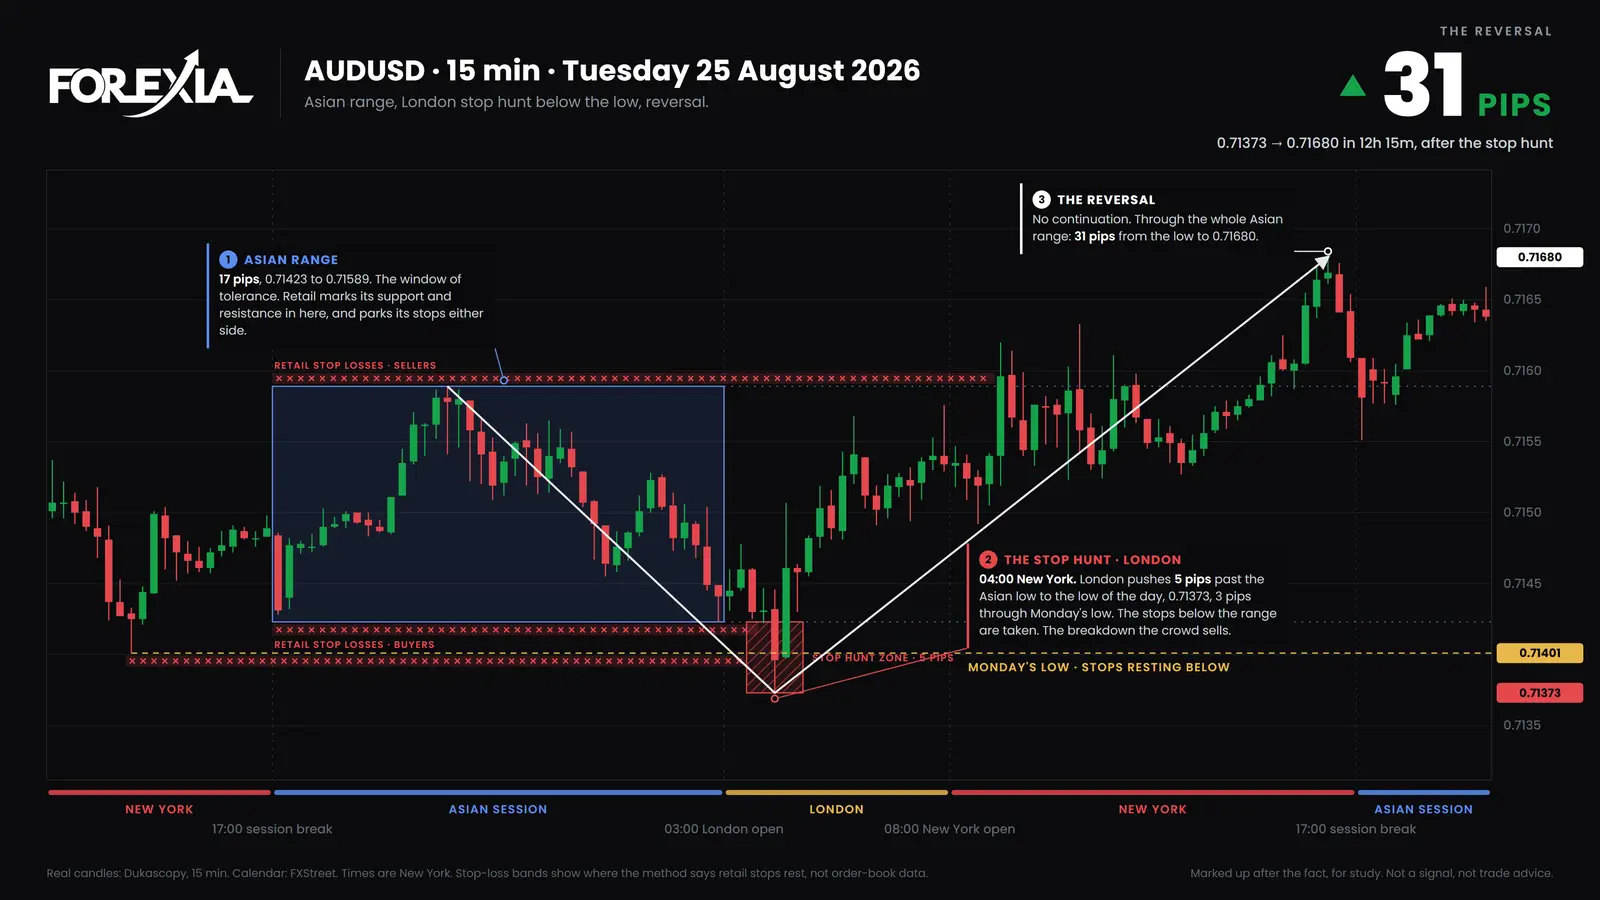
Follow one line through one morning. Asia left a 17-pip range, 0.71423 to 0.71589, which we draw as the Asian Box. Monday's low, 0.71401, sat 2 pips under it. A buyer at the bottom of the box has an entry at the line and a stop somewhere below. A breakout seller is waiting below too. Every order under there is a sell.
London opened at 03:00 New York. The 03:45 candle touched 0.71422 and closed back at 0.71431, so the line had been reached and little else. The 04:00 candle went to 0.71373, 5 pips under the box and 3 under Monday's low, and closed at 0.71396, under both.
Now look at who has done what. The buyer's stop has sold. The breakout seller has sold, and anyone selling that close sold about 2 pips above the low. The next candle closed at 0.71461, back inside the box. No medium or high-impact release came near any of this: the RBA's minutes had come at 21:30, in Asia, and the next was at 08:15.
The first close over the top of the box came at 09:00, at 0.71596. By 16:15 price was at 0.71680, 31 pips off the low. The line went through and the day went up. Monday's high, 0.71764, was also on the chart, and price did not reach it.
The week's other marked-up days are in that week's chart markups.
The same order the other way up: gold, Friday 25 September 2026
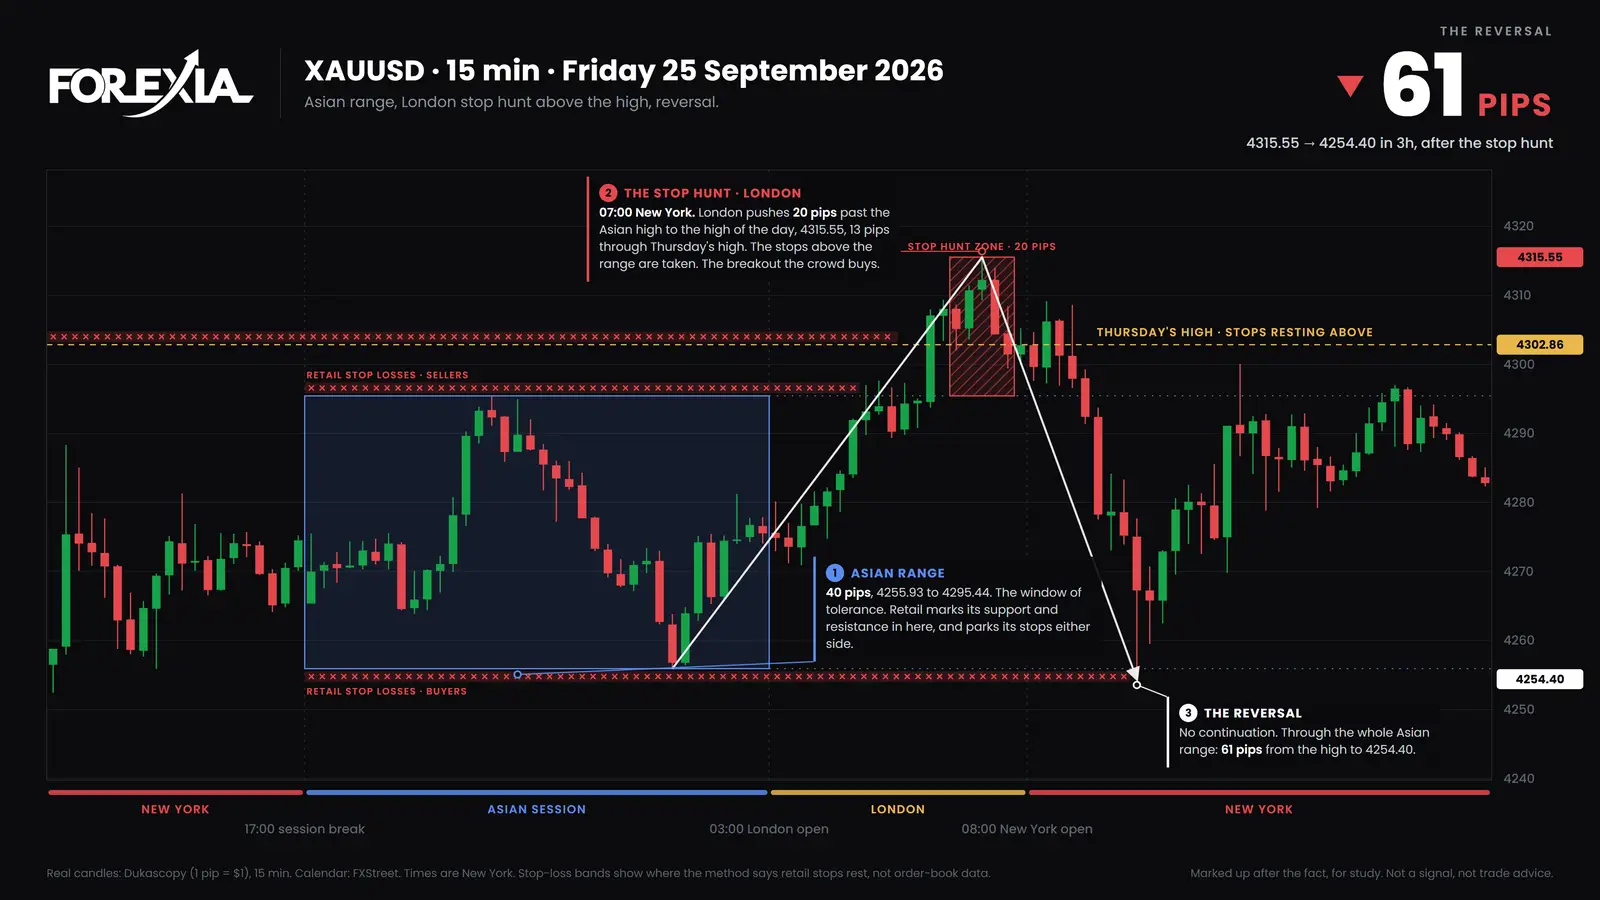
Above a high, the two people who disagree are a seller and a breakout buyer, and they leave the same order. Gold's box ran 40 pips, 4255.93 to 4295.44, counting $1 as 1 pip. Thursday's high, 4302.86, sat 7 pips above it. A seller's stop over those lines is a buy. So is a breakout buyer's entry. Every order up there is a buy, and a large seller needs buyers.
The 06:00 candle closed over both lines at 4307.10. That is the break the crowd buys, and it was not over in a candle: the closes stayed above Thursday's high until 07:15. The high of the day, 4315.55, came at 07:00, 20 pips over the box and 13 over Thursday's high.
The way down was untidy. The 07:30 candle closed under Thursday's high at 4301.44, and the 08:15 candle closed back over it at 4306.23. The first close inside the box came at 09:00, at 4292.40. By 10:00 price was at 4254.40, 61 pips off the high and 2 under the box, on a candle that held the University of Michigan's sentiment figures, a medium-impact release. A pool past a line does not settle anything in one candle.
Both sides of one chart: NZD/USD, Wednesday 9 September 2026
Liquidity is not in one place, so a chart always has a pool on each side of price. NZD/USD's box ran 19 pips, 0.58442 to 0.58630. Tuesday's low, 0.58355, sat 9 pips under it and Tuesday's high, 0.58851, sat 22 pips over it. That makes four lines with orders past each.
London's first candle reached 0.58650, 2 pips over the box, and the 03:15 candle closed back inside at 0.58611. Then price went the other way. At 06:15 it reached 0.58297, 15 pips under the box, 6 under Tuesday's low and 35 off the high. The next candle closed back over Tuesday's low at 0.58358, and by 09:30 price was at 0.58569, 27 pips up.
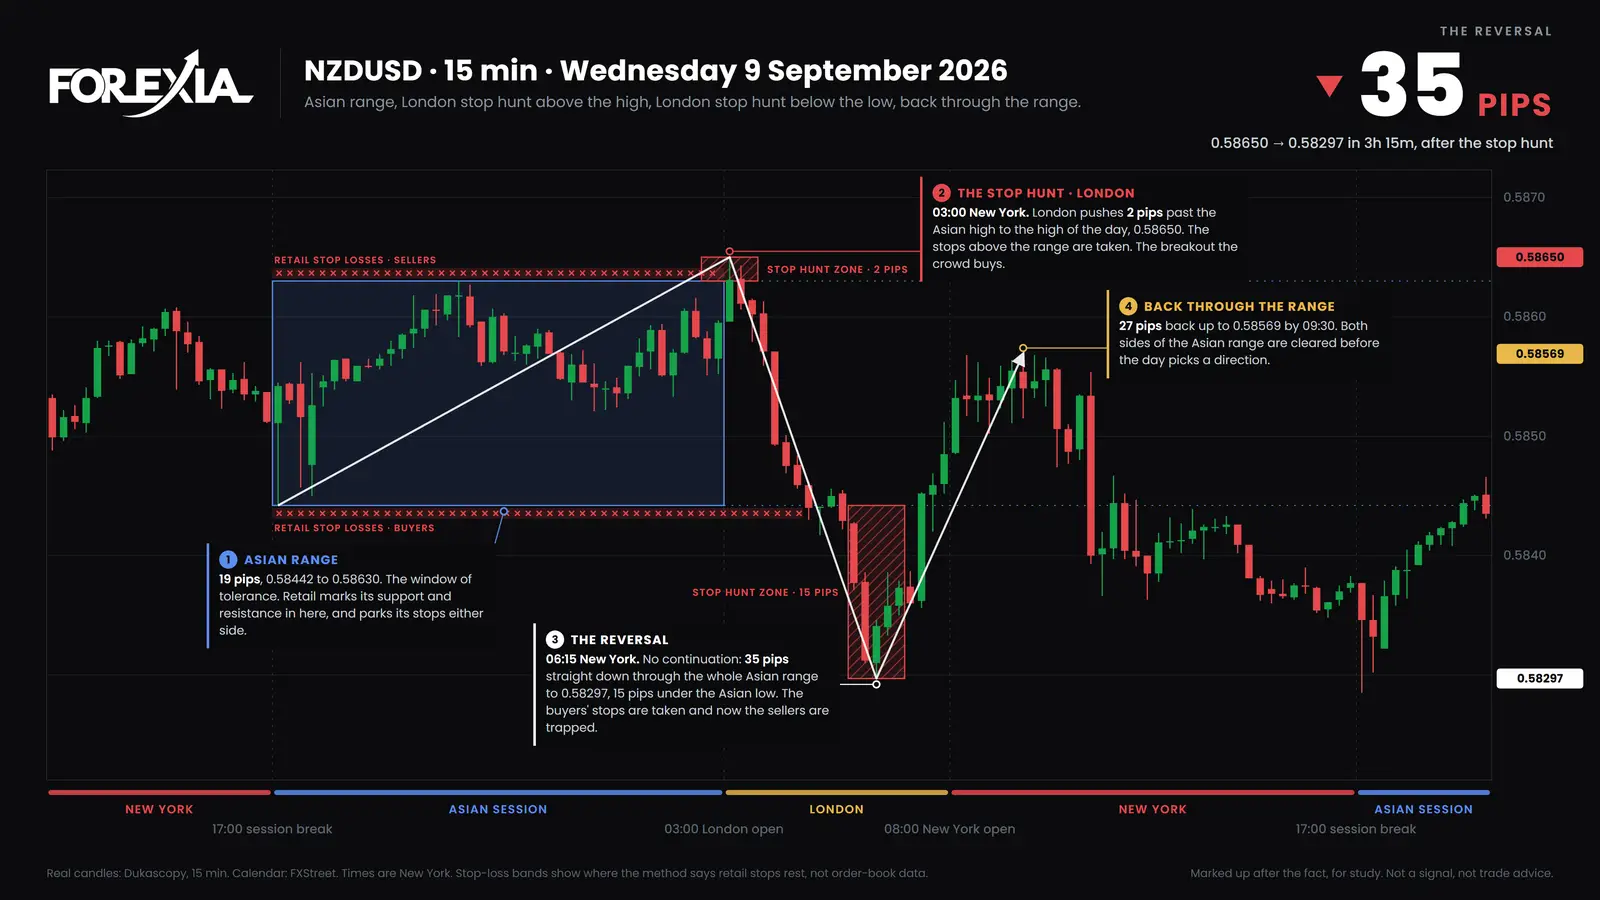
So one pool got 2 pips, one got 15 and one was never reached, and nothing on the chart at 03:00 said which would be which. Tuesday's high had the same kind of orders past it as Tuesday's low. A map of orders says where they may be. It does not say which ones price will go to, or when.
What did each seat see on these days?
The three seats read the same line three ways, here on AUD/USD.
- Retail saw support, then a break. At 0.71423 the textbook buys, and under it the textbook sells. Both trades look complete on their own.
- The market maker, as we read it, saw a pile of sells. A big buyer wants sellers, and the stops and the breakdown entries under 0.71401 were all sellers.
- The observer saw the order of events. A line, a push 5 pips past it, a close back on the next candle. The observer cannot say who bought. The observer can say what closed where.
Does the map tell you what to do?
No. It tells you what is sitting where, and three chosen days show what that can look like, not how often it happens. A reversal seen afterwards is not a setup, and our own test of this setup as a mechanical rule did not make money. The liquidity maps sold as tools shade the chart by a rule, and none of them can see a stop.
Common mistakes
All three come from reading the line and not the orders.
- Counting one order. A trader who marks an entry and nothing else has read half the line. On gold, the seller at Thursday's high and the buyer over it were the same order past it.
- Expecting the first pool reached to be the last. On NZD/USD price took 2 pips over the box first, and the larger trip of that morning came afterwards, on the other side.
- Expecting one candle to settle a pool. On gold the 07:30 candle closed under Thursday's high, the 08:15 closed back over it, and the first close inside the box came at 09:00. Some breaks are real as well, as the Asian range liquidity sweep shows.
Course 1 of ForexiaPRO, Reading the Map, teaches this read step by step in lesson 1.2.1.
Frequently asked questions
Is liquidity above or below price?
Both, at the same time. Above every obvious high sit buy orders: sellers' stops and breakout buyers' entries. Below every obvious low sit sell orders: buyers' stops and breakout sellers' entries. On NZD/USD on 9 September 2026 price went to both in one morning, 2 pips over the Asian range and then 15 pips under it.
What is a liquidity pool in forex?
On a chart, it is the group of orders resting together just past a level: stops and breakout entries that all point the same way. Brokers also use the phrase for the banks and firms that quote them prices, and crypto uses it for tokens held in a smart contract. Neither of those is what a trader's chart shows.
Does price always go to the nearest liquidity?
No. On NZD/USD on 9 September 2026, Tuesday's high sat 22 pips over the Asian range and was not reached that day. On AUD/USD on 25 August 2026, Monday's high was on the chart and was not reached either. A level says where orders may rest, not that price will go there.
Can an indicator show where the liquidity is?
It can draw lines at swing highs and lows, which saves time. It cannot see stops, because spot forex trades over the counter and no public book shows them. A depth-of-market window shows the limit orders at one venue, not the stops at every broker. So a pool on any chart is a reading of the structure, not data.