Why Do Stop Losses Sit Above Highs and Below Lows?
Dylan Forexia9 min read
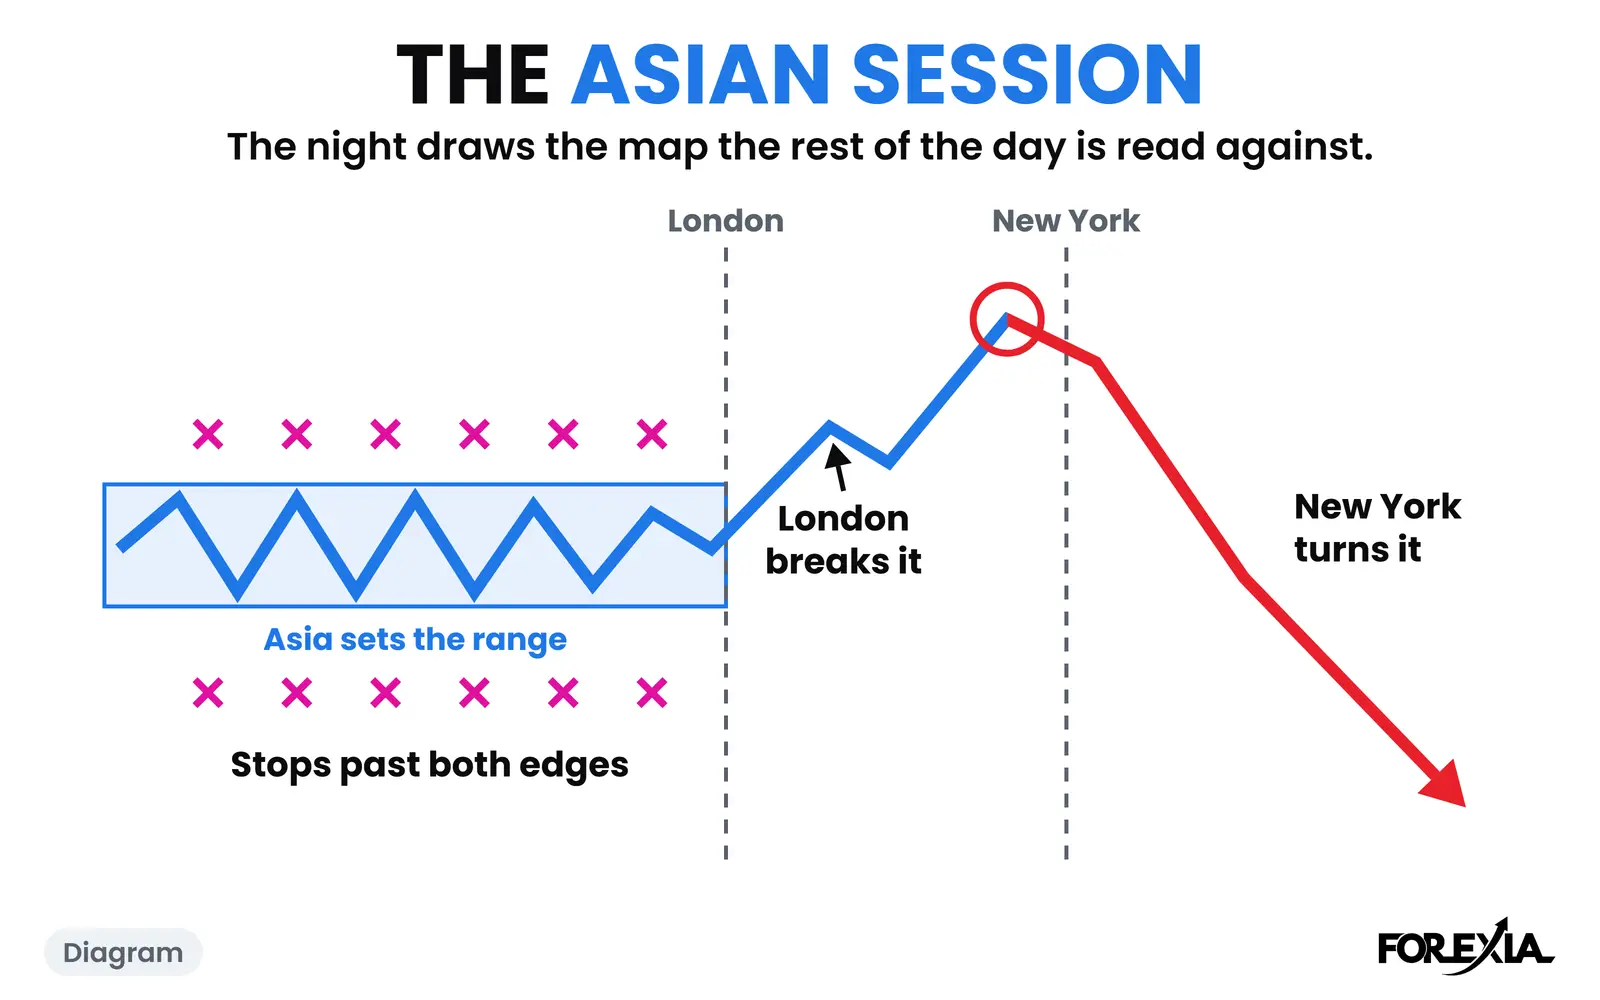
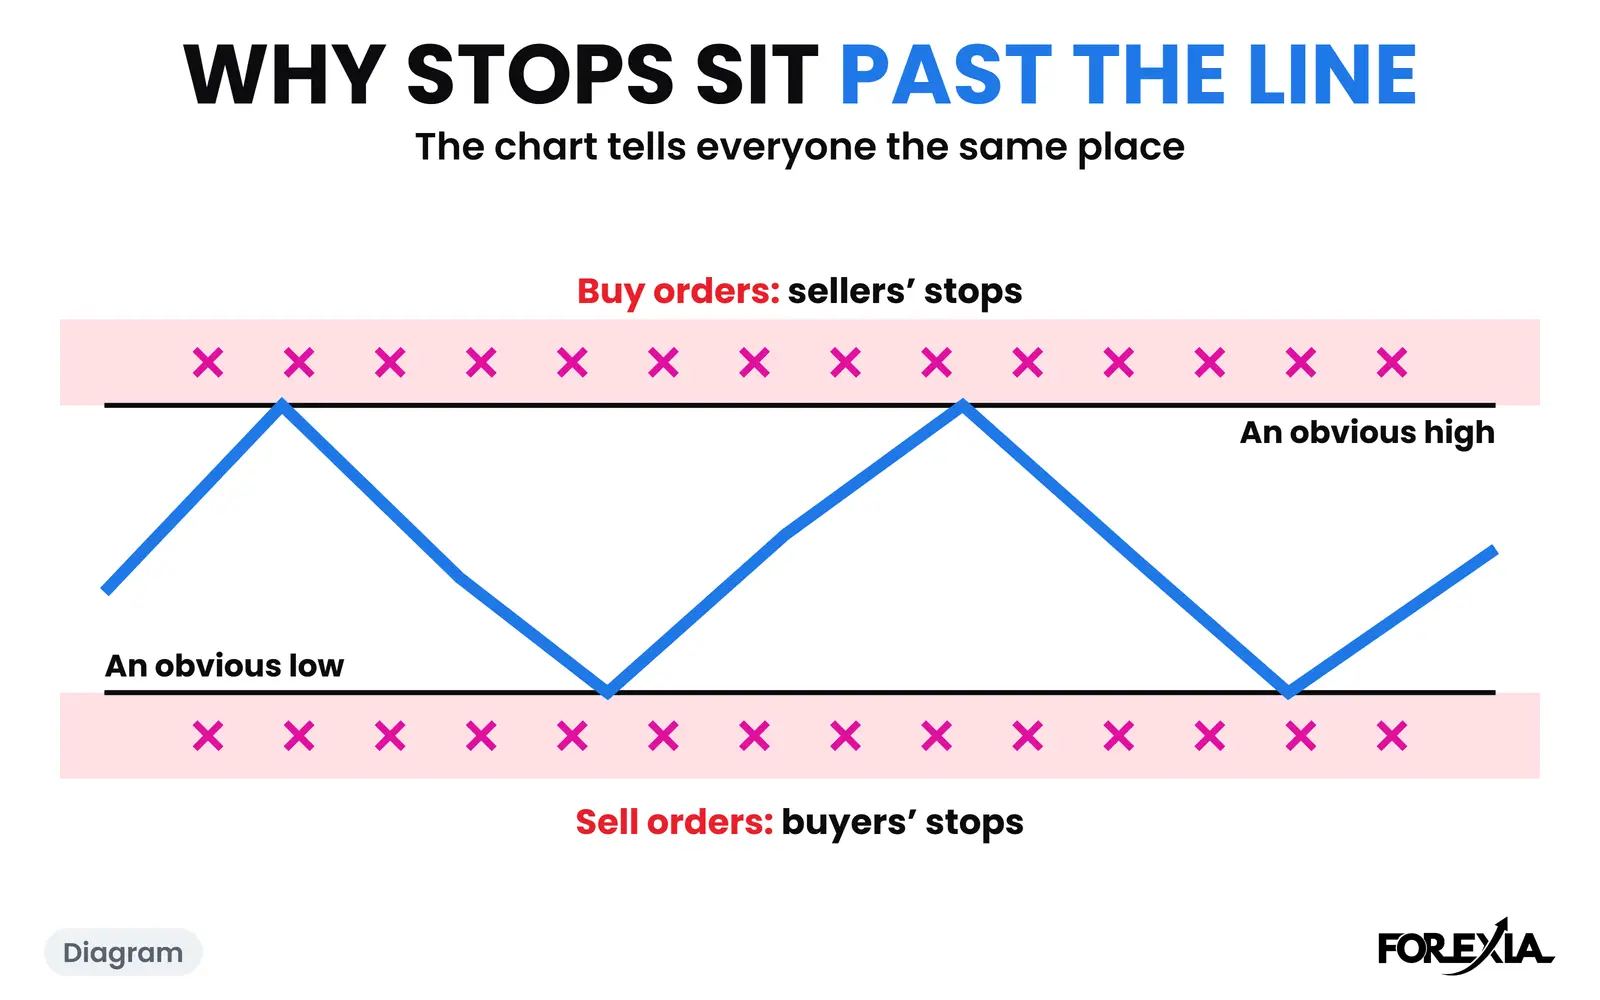
Stop losses sit above highs and below lows because that is where a trade idea is proven wrong, and everyone is taught the same highs and lows. A seller's stop goes just over the last high and a buyer's just under the last low, so the orders pile up in the same few pips.
Nobody outside a broker can see those orders. What follows rests on the logic of how a stop gets chosen, one bank's old order book, and two real days. Where the orders sit on a chart, and which line each one belongs to, is on where liquidity sits on a chart. This page is about why they end up there.
Why do stop losses sit above highs and below lows?
Four pressures push different traders' stops into the same place, and none of them needs anyone to agree on anything.
The idea. A stop marks where the trade is wrong. A trader who sells a double top is saying the high will hold, so the stop goes over the high, because nothing else on the chart says that idea has failed. The books teach it, which is why a double top's stops are so easy to find.
The size. A stop's distance decides how big the trade can be. Risk the same $100 on EUR/USD, with a pip worth $10 on a standard lot, and a 10-pip stop lets you hold one lot, while a 40-pip stop lets you hold a quarter of one. So nobody with a fixed risk chooses a stop further away than the idea needs. Everyone takes the nearest line that still makes sense, and the nearest line is the same one for all of them. This is our reasoning, and we think it is why the pile sits right at the level and not spread out behind it.
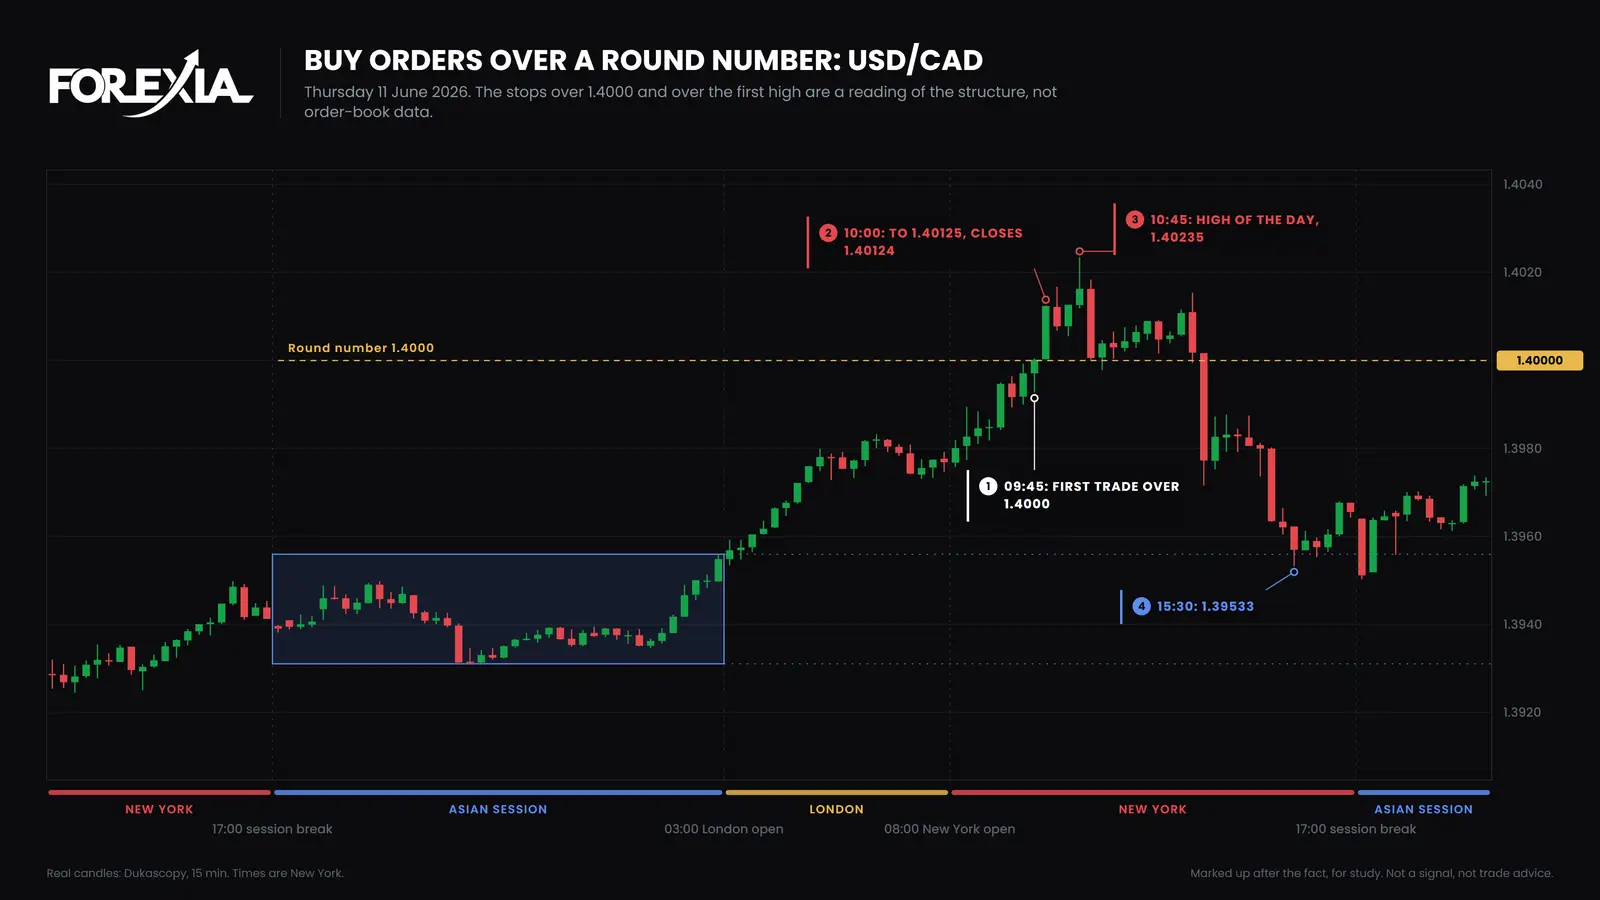
The margin. A stop exactly on the high can be set off by a touch, and on many charts you see only the bid, while a seller's stop fires on the ask. So traders add a few pips. On 11 June, further down, USD/CAD's first trade over 1.4000 went half a pip past it, and the 12-pip candle came after that.
The other order. On that same morning, a seller's stop over 1.4000 and a breakout buyer's entry over 1.4000 were both buys, in the same few pips. Two people who disagree have left the same order. A liquidity sweep is what we call price going through all of them.
Where do stop losses cluster? What one bank's order book showed
The best evidence we know of is about round numbers, and it comes from a New York Fed staff report of 2002. It reports on the complete order book of one major dealing bank from 1 August 1999 to 11 April 2000: 9,655 orders worth over $55 billion, in dollar-yen, dollar-pound and euro-dollar. Stop-loss orders were 43% of them by volume.
| Order | Where it clustered | The figure, by value |
|---|---|---|
| Executed stop-loss buys | Just above round numbers | Near a rate ending 00, 14.3% had rates ending 01 to 10 and 6.9% ending 90 to 99 |
| Executed stop-loss sells | The report says they "tend to" cluster just below | Near a rate ending 00, 10.0% had rates ending 90 to 99 and 5.0% ending 01 to 10, in its Table III |
| Executed take-profits | On the exact number | 9.9% at rates ending 00, against 3.8% for stops |
That fits the margin above, and it adds something most guides leave out. Take-profit orders stop a move and stop-loss orders feed one, and they do not sit in the same place. The first wait on the number and the second a little past it.
Now the limits. The data is more than 25 years old. It is one bank's orders, from its customers and its own desks, not retail traders. And it covers round numbers, ending in 00 or 50. It says nothing about swing highs and lows, so the claim that stops pile up above highs is a reasoned reading, not a finding. Other guides also name equal highs and lows and trendlines, and we have no data for those. How to find liquidity pools sets out what each is worth.
Why is price drawn to stop losses? It may not be
A stop does not pull price from a distance. What is documented is what happens once price gets there.
A stop becomes a market order when it fires. That order pushes price toward the next stop, which fires too. The report calls this a price cascade. On quotes from 1996 to 1998 it found rates moving unusually fast after crossing round numbers, statistically significant over hours and not days. The size is worth seeing: dollar-mark moved an average 0.061% in the 15 minutes after crossing a round number and 0.054% after crossing an arbitrary one. That is real, and it is small. The author says statistics cannot prove the link is causal, and that many large moves have nothing to do with stops. It also found rates reversing relatively often at take-profit clusters, which is a different order doing a different thing.
Our read goes further, and it is a read. A large buyer wants sellers, a pile of stops under a low is a pile of sell orders, and so those stops are worth going to. We call that move The Stop Hunt.
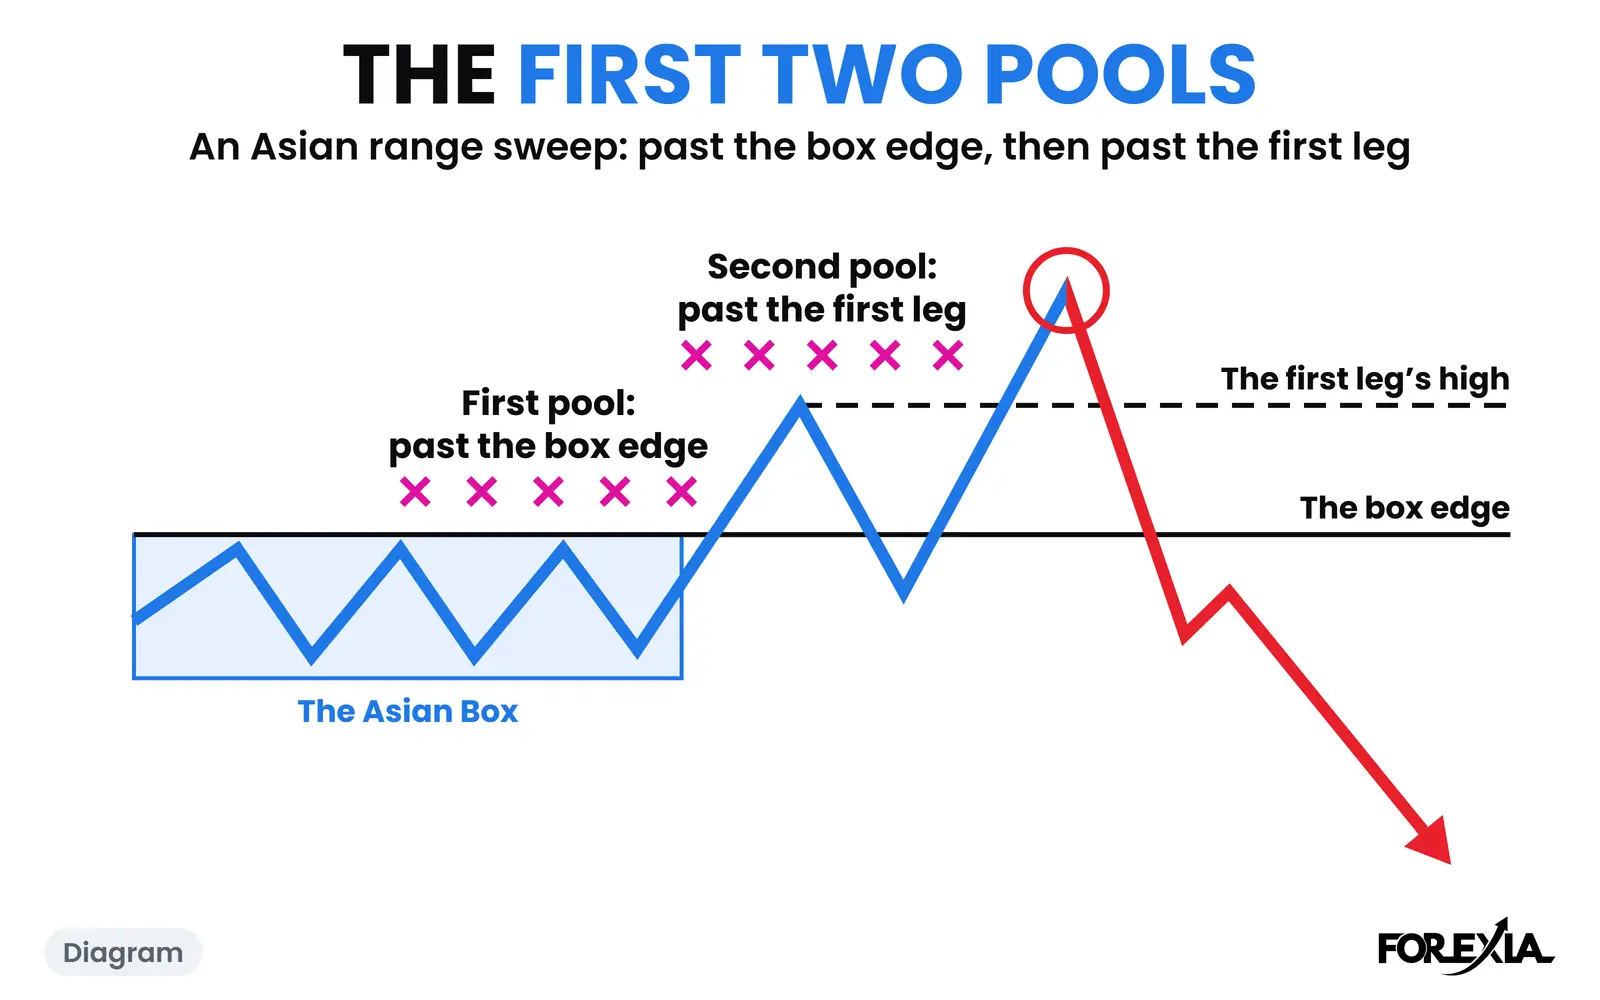
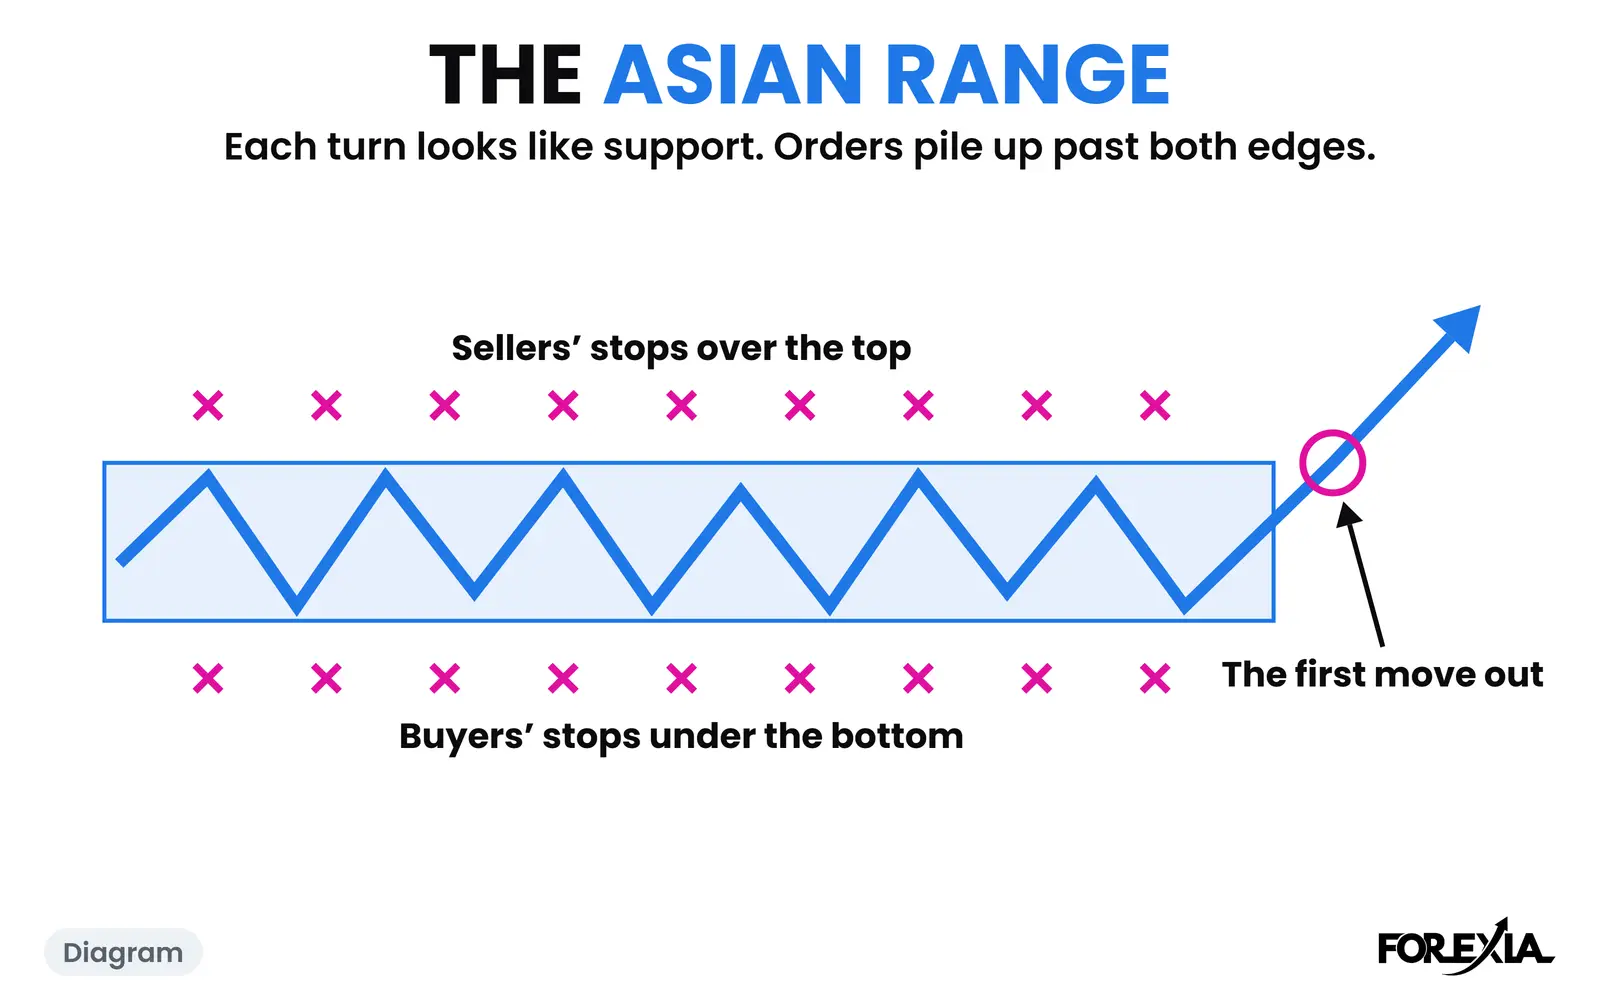
Whether price really goes there more than chance would is another matter. In our count of seven dollar majors and gold on 15-minute candles, from 6 April to 1 October 2026, there were 1,030 market-days and so 2,060 edges of the Asian Box. Price went past 1,179 of them by at least 3% of the average daily range, between the London open and 17:00 New York. It sounds like a magnet. But the median box is only 40% to 52% of a market's average day, so a normal day has room to leave it. We have not separated pull from wandering, and our stop hunt page says what follows from that.
The same round number from below: USD/CAD, 11 June 2026
On Thursday 11 June 2026 USD/CAD climbed all morning toward 1.4000, a number it had not traded through that week. Asia's 25-pip box, 1.39311 to 1.39560, was long gone. The 09:45 candle made the first trade over the number, at 1.40005, and closed at 1.40002.
The next candle ran to 1.40125 and closed at 1.40124, 12 pips in 15 minutes, with no medium or high-impact release for either currency since 08:30. Sellers' stops just over the number and breakout buyers' orders would all be buys, and all in those pips. A cascade would look like this, though one candle cannot show that it was one.
The 10:45 candle reached 1.40235, the high of the week. The 11:15 candle traded back under the number, and by 15:30 price was at 1.39533, 70 pips off the high.
The same round number from above: USD/CAD, 6 August 2026
Eight weeks later the same number was underneath price, with two more lines stacked on top of it. Wednesday's low was 1.40045, and the low of a 15-pip Asian box was 1.40022. That is three lines inside five pips. A buyer's stop just under the round number sits under all three. Marking the previous day's high and low and a round number together shows that at a glance, and we call the habit Liquidity Mapping.
The 06:45 candle made the first trade under the number that day, at 1.39980, and closed at 1.39989. Price worked lower in stages, closed back on the number's upper side at 07:30, then fell again. The 08:00 candle reached 1.39901, the low of the day, 10 pips under 1.4000 and 12 under the box. The 07:15 low at 1.39940 had left a line of its own, which we call the High and Low of the Day. The 07:45 candle first went past it, and the 08:00 candle went 4 pips past it.
No medium or high-impact release for either currency came in that hour. The US claims figures were due at 08:30, and that candle barely moved. The 08:45 candle closed over all three lines at 1.40065, and by 11:30 price was at 1.40375, 47 pips off the low. It then gave back 26 pips by 14:15.
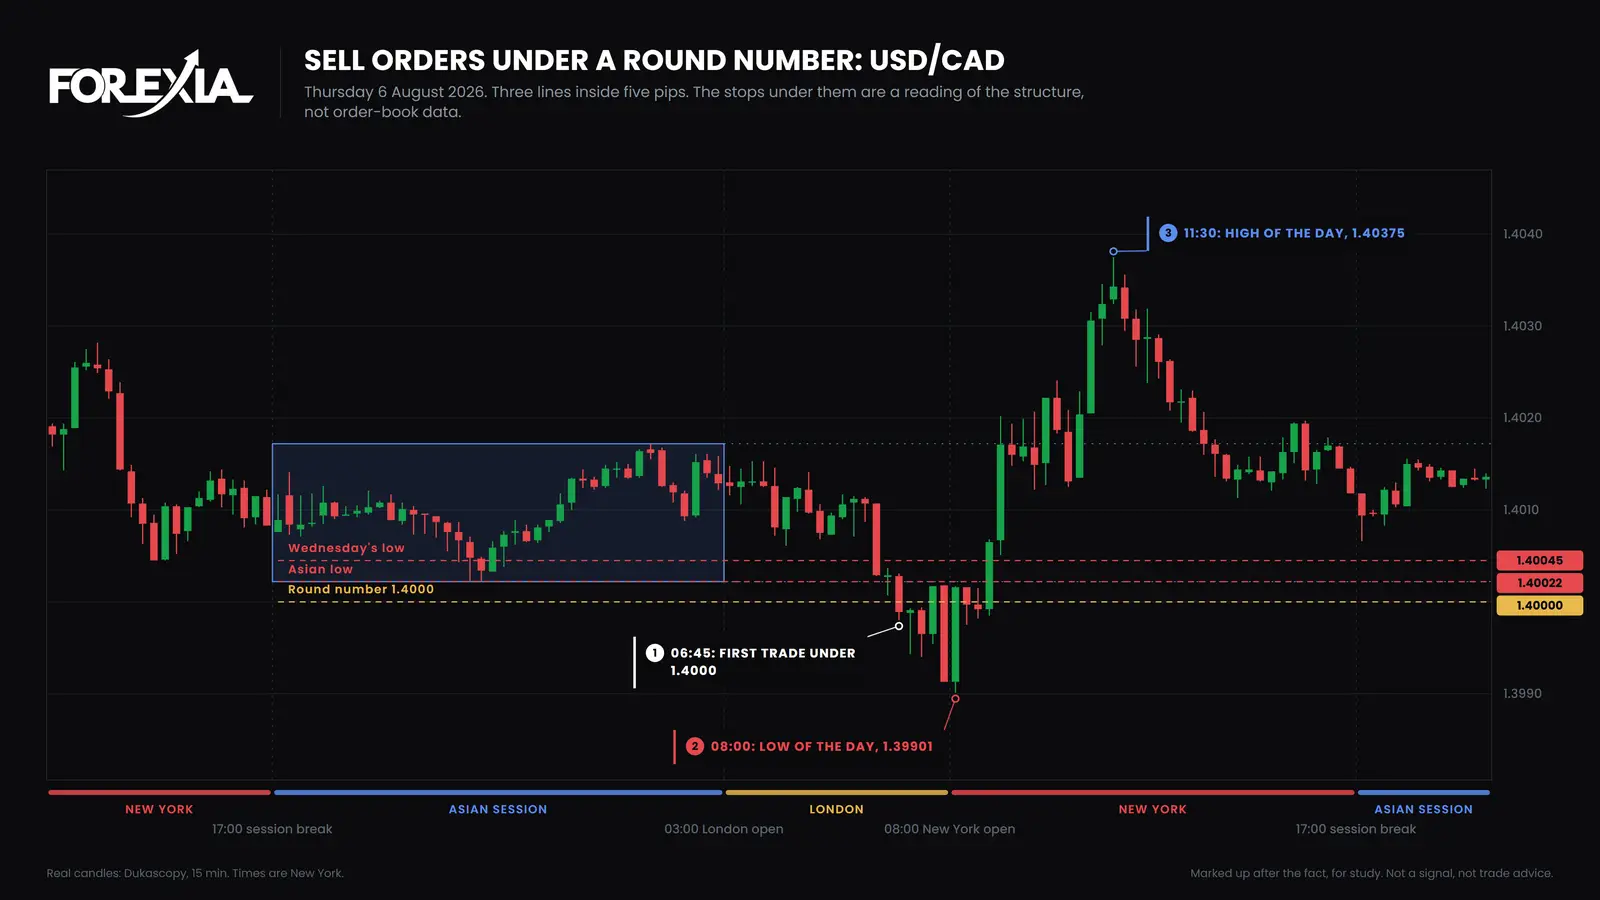
So one pair and one number gave two days, with buy orders on one side and sell orders on the other. The first morning at the Asian range is where many of these lines get made. Neither day proves a stop sat where we say. The candles only show that price went there and what it did after.
What does each seat see at an obvious high?
The three seats read the same line differently, and 1.4000 on 11 June will do for the high.
- Retail, short under the number, sees a place to be wrong. The stop goes just over 1.4000 because the book says so and the account likes a small stop.
- The market maker, as we read it, sees buy orders over 1.4000 that all arrive within moments of each other, which is what a large seller needs. Price went on to 1.40235 and then fell 70 pips.
- The observer sees that the first two follow from the same picture, and that neither can see the other's orders.
What this does not tell you
It does not say where your stop should go, and moving it a few pips does not leave the crowd if the next few pips are where the crowd's margin ends. If you are asking because your stops keep going, start with why your stop loss always gets hit, which works from your own losses. Which highs and lows count as obvious has its own page, and the meaning of the word sweep elsewhere is split out on the banking and trading meanings.
It also does not hand you a trade. These two days were picked afterwards, a reversal seen afterwards is not a setup, and our own test of trading against the hunt as a fixed rule did not make money.
Course 1 of ForexiaPRO, Reading the Map, teaches this read step by step from lesson 1.2.1.
Frequently asked questions
Where do stop losses cluster?
Just past the lines most traders can see: over a recent high, under a recent low, and just beyond a round number. Only the round numbers have order-book research behind them, from one dealing bank in 1999 and 2000. For highs and lows the clustering is a reasoned reading of how traders are taught, not data.
Why do stops sit just past a round number and not on it?
A stop on the number itself can be set off by a touch, so traders leave a small margin. In the New York Fed staff report, executed stop-loss buy orders clustered just above round numbers and sell orders just below. Take-profit orders behaved differently, clustering more strongly on the exact number.
Do stop losses really move the market?
They can add to a move, because a stop becomes a market order when it fires. The research found exchange rates moving unusually fast after reaching round numbers, statistically significant over hours and not days. Its author says statistics cannot prove the link is causal, and that many large moves have nothing to do with stops.
Can you see where stop losses are?
No. Spot forex trades over the counter, so no public book shows them, and a broker sees only its own clients' orders. Any indicator that marks stop clusters is drawing lines at likely places by a rule. It is the same reading you can make from the chart yourself, and it can be wrong.
Is price attracted to stop losses?
A stop does not pull price from a distance. Our read is that a large order wants the other side, so stops are worth going to. But a normal day's range is about twice the Asian range, so price leaves that range often whether stops sit there or not. We have not separated the two.