Asian Session Strategy: How Asia Sets the Day, London Breaks It and New York Turns It
Dylan Forexia8 min read
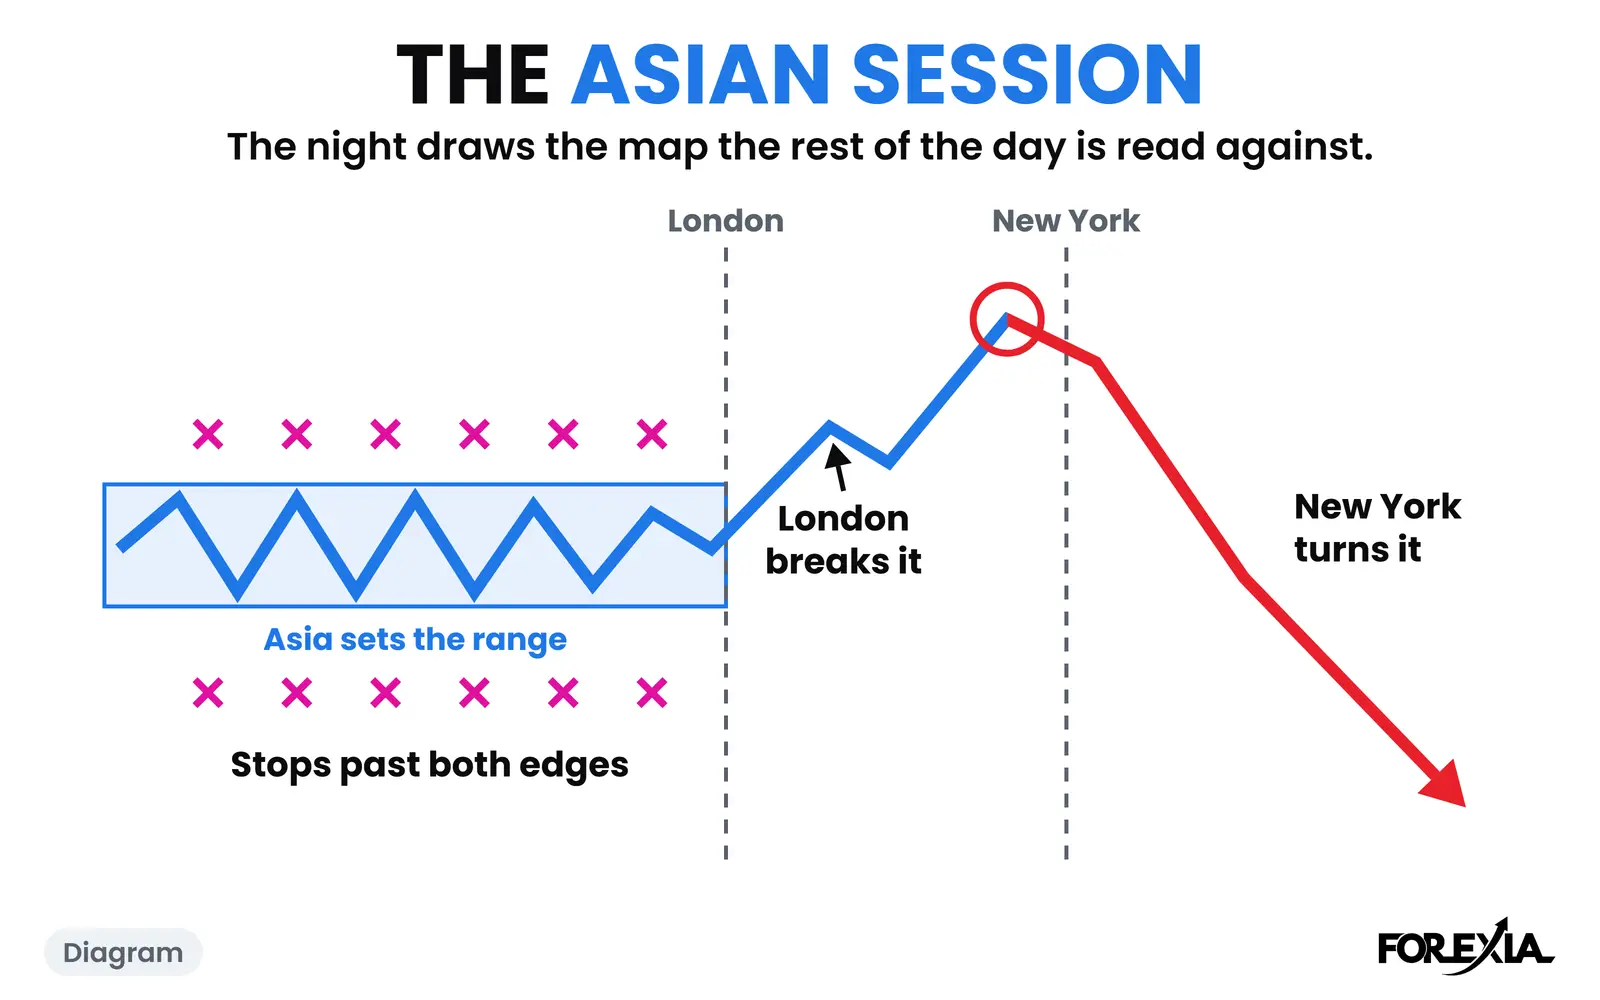
An Asian session strategy is a plan built on the quiet hours before London. Most guides either trade inside that range or trade its break at the London open. We start with what the night leaves behind: Asia sets a range, London breaks it and New York may turn it. Here is what each part did on three real days.
This page has no entries, stops or targets of ours. A reversal seen afterwards is not a setup, and our own test of the setup as a mechanical rule did not make money. It shows what the session did, and why we read it the way we do. The clock itself lives on our forex market hours page.
What does an Asian session strategy usually mean?
It usually means one of two trades. The first treats the night as a range: buy near the bottom, sell near the top, close before London. The second waits: mark the high and low, then trade the first break once London opens, the Asian session breakout strategy most guides end up on. A third kind hands the quiet hours to a robot.
The guides tend to name the same pairs (USD/JPY, AUD/USD, NZD/USD and the yen crosses) and warn about wide spreads and thin hours. They disagree about when the session starts, and some quote win figures with no source. That is the retail seat, and it is a reasonable place to begin. It asks what to do with the night. We ask what the night has done to everyone else.
What does the Asian session actually do?
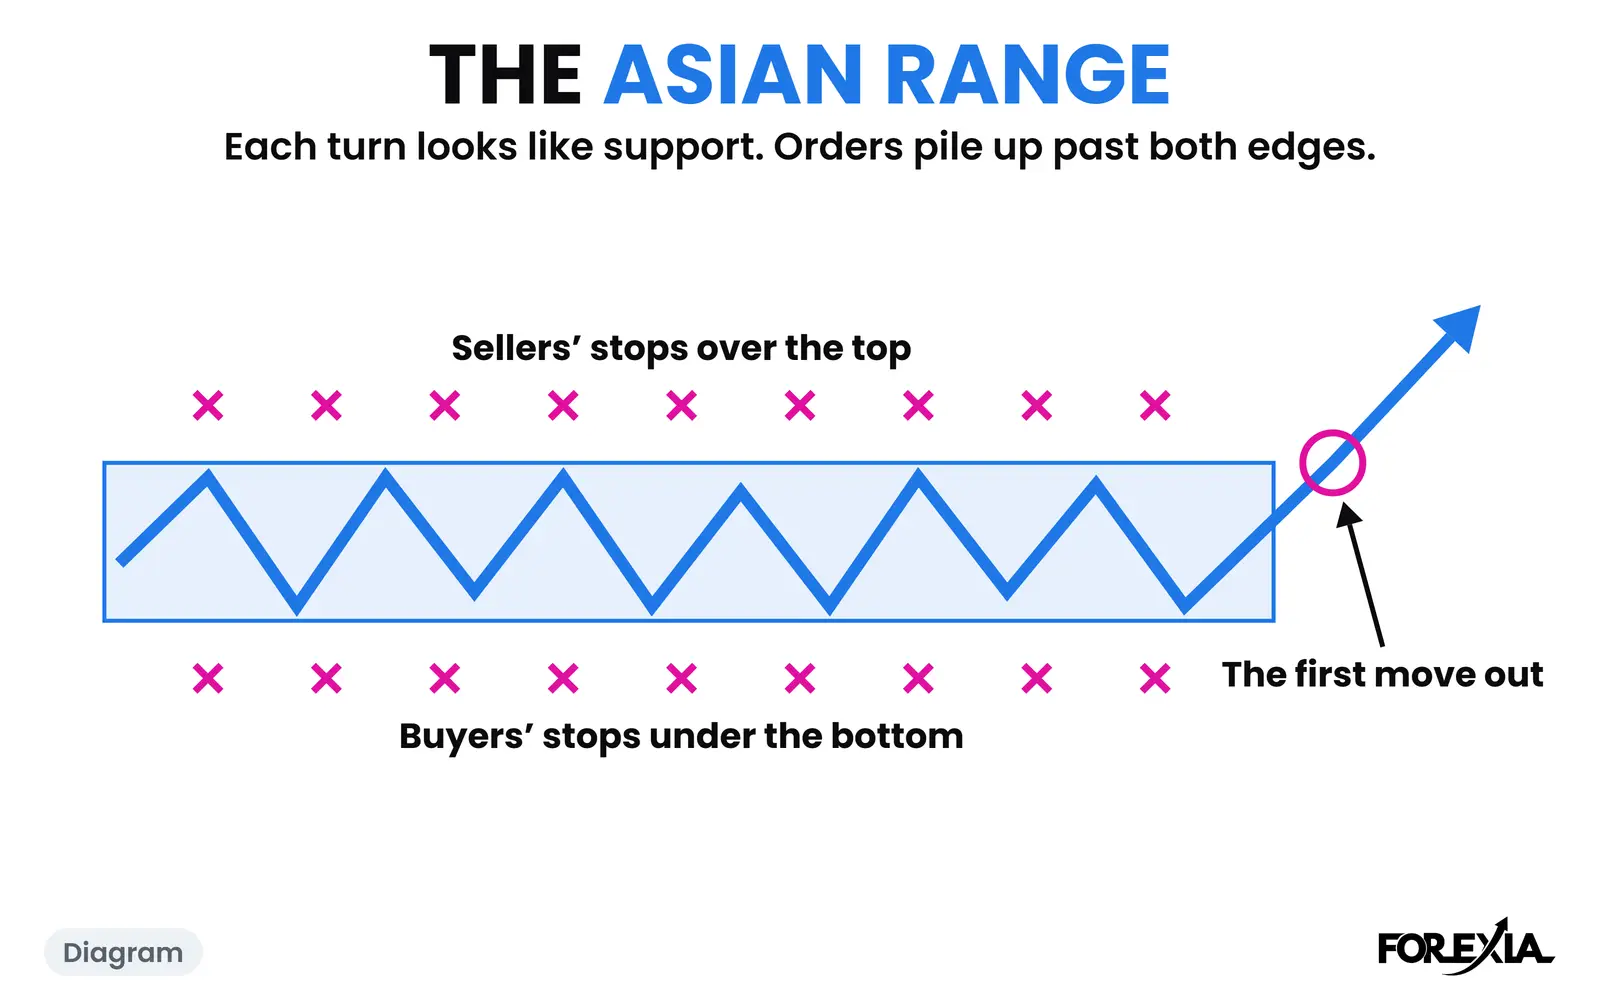
It leaves two lines on the chart. Drawn on the wicks from the session break to the London open, the night's high and low are the Asian Box. Its median size was 23 pips on EUR/USD, 30 on GBP/USD, 41 on USD/JPY and 54 on gold, where we count $1 as 1 pip. That is 40% to 52% of each market's average day, over 1,030 market-days from 6 April to 1 October 2026.
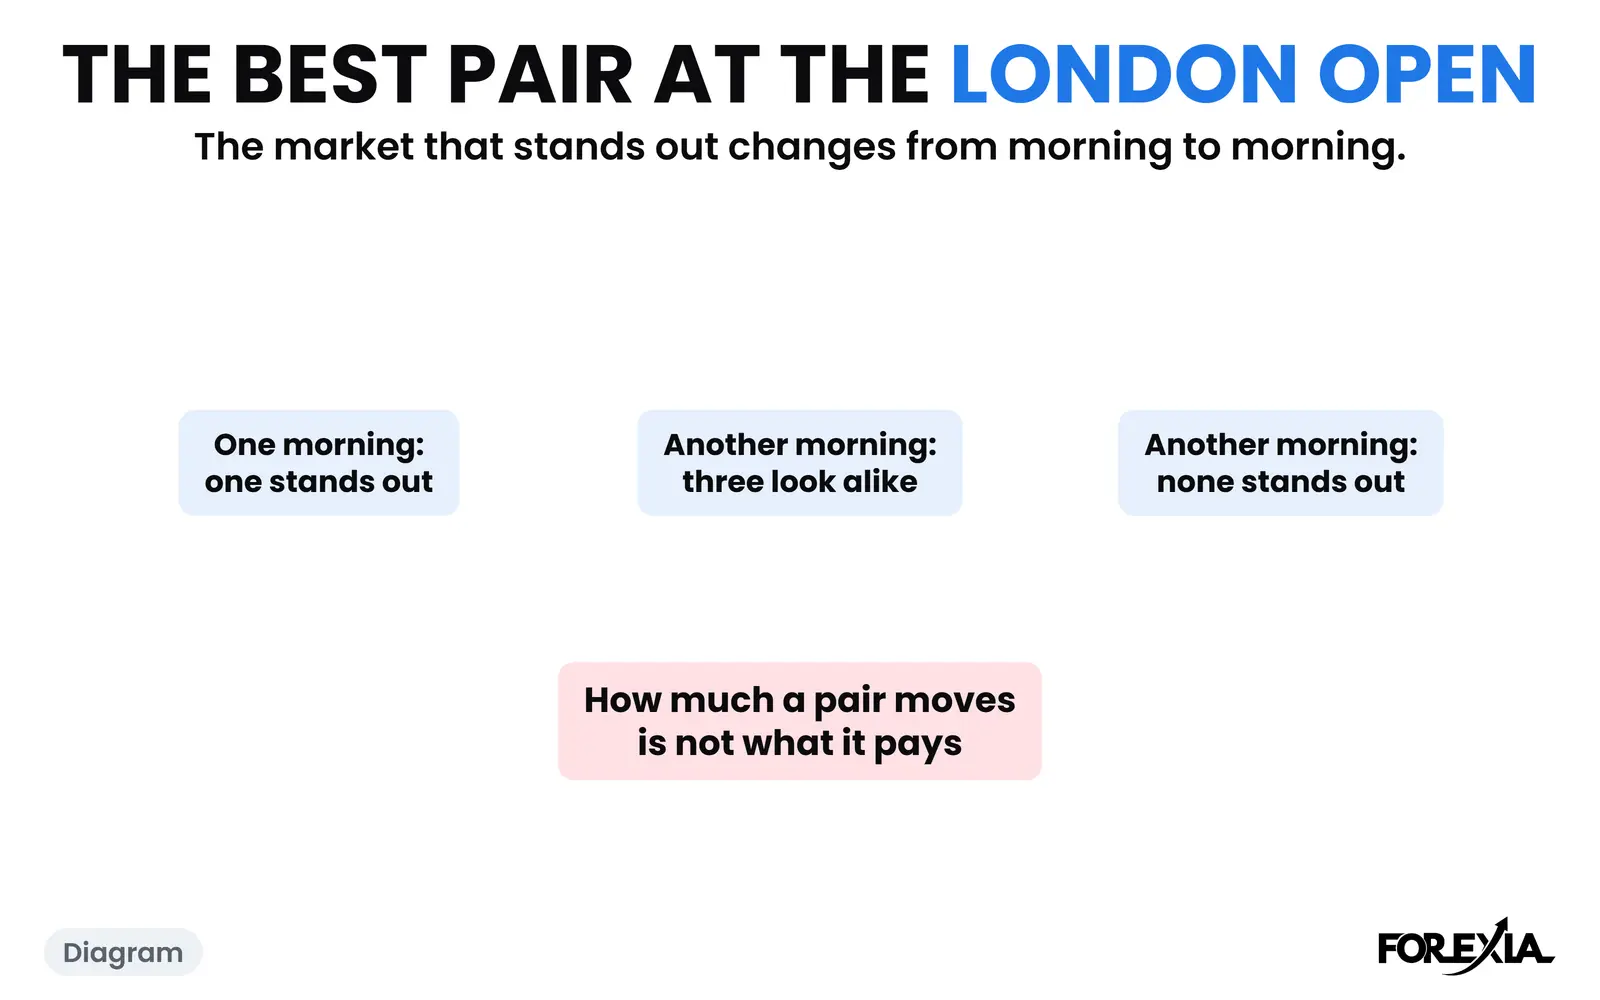
Those hours are not equally quiet everywhere. Asia's median range was 63% of the day's range on NZD/USD, 62% on USD/JPY and 60% on AUD/USD, against 45% to 46% on GBP/USD, EUR/USD and USD/CAD. So the pairs the guides name really do more of their moving at night. The range is still a range: our page on the Asian range goes through what builds inside it, pair by pair.
We read those hours as the point. Part of the quiet is simple: in the BIS's April 2025 survey, desks in the UK and the US handled more than half of FX turnover. The rest is our reading: every few pips someone buys near the bottom or sells near the top, each trade leaves a stop just outside, and by London those stops are sitting a few pips from the market. Nobody outside a broker's book can see them.
How does the Asian session set up the day?
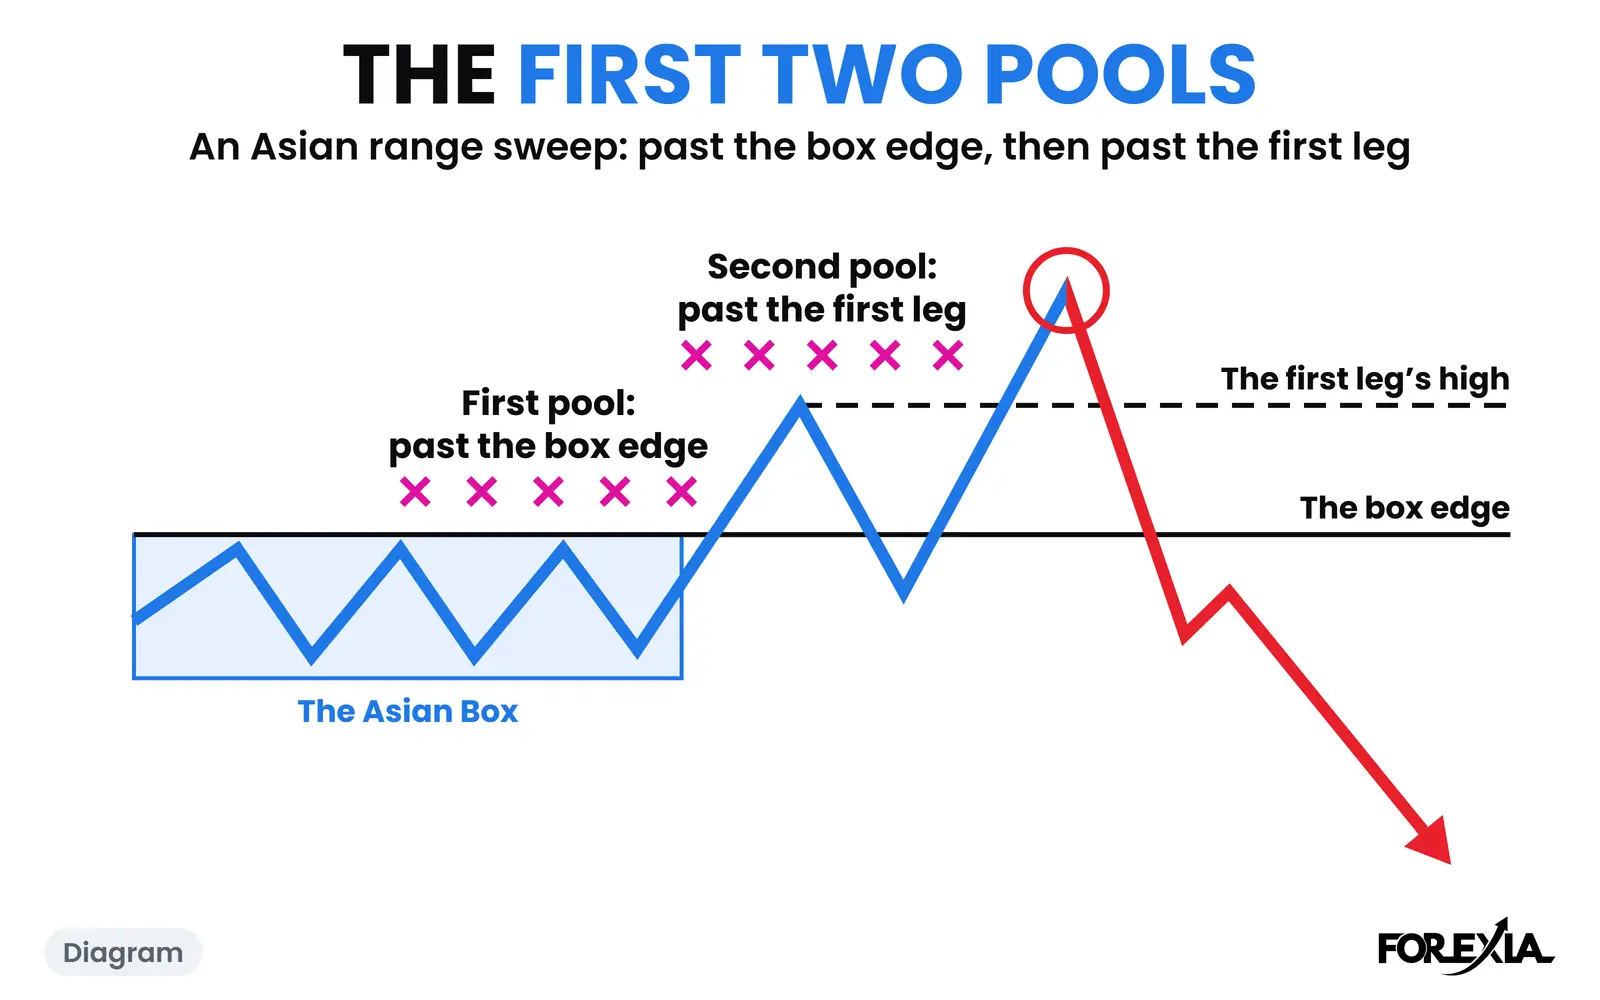
It gives the next two sessions something to break and something to return to. We call the whole sequence the Chaos Pattern: consolidation, breakout, reversal. The next part is the London Breakout, where the crowd enters for the continuation. The last is the New York Reversal, where New York takes that move back.
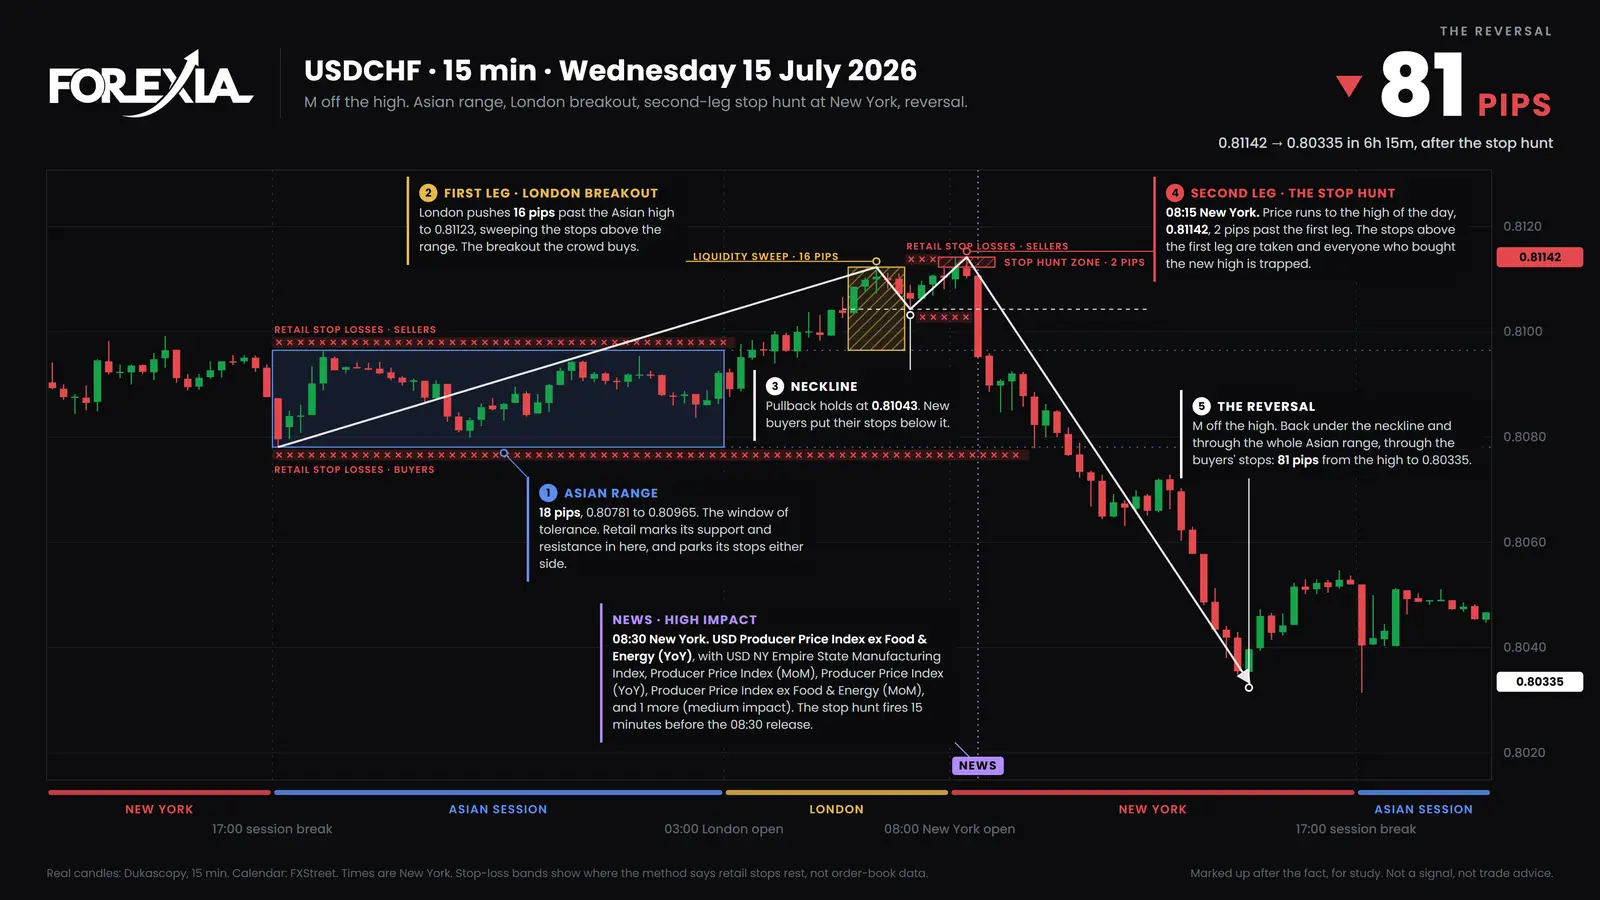
USD/CHF on Wednesday 15 July 2026 ran all three, off the high. On this page a candle is named by the New York time it opens. Asia left 18 pips, 0.80781 to 0.80965. That low is the wick of the very first candle after the session break, when spreads widen, so another feed may draw the bottom a little higher.
London traded over the box on its second candle, and the 04:00 candle closed clear of it at 0.80995. By 06:15 London had reached 0.81123, 16 pips over the box. To anyone watching, that was the trend. New York's 08:15 candle made the high of the day at 0.81142, 18 pips over the box and 2 past London's high. The next candle, on US producer prices, ran from 0.81108 to 0.80952 and closed back inside the box. That is the close back. The 10:30 candle closed under the whole box at 0.80766, and by 14:30 price was at 0.80335, 81 pips off the high and 45 under the box.
Does it work the same way off a low?
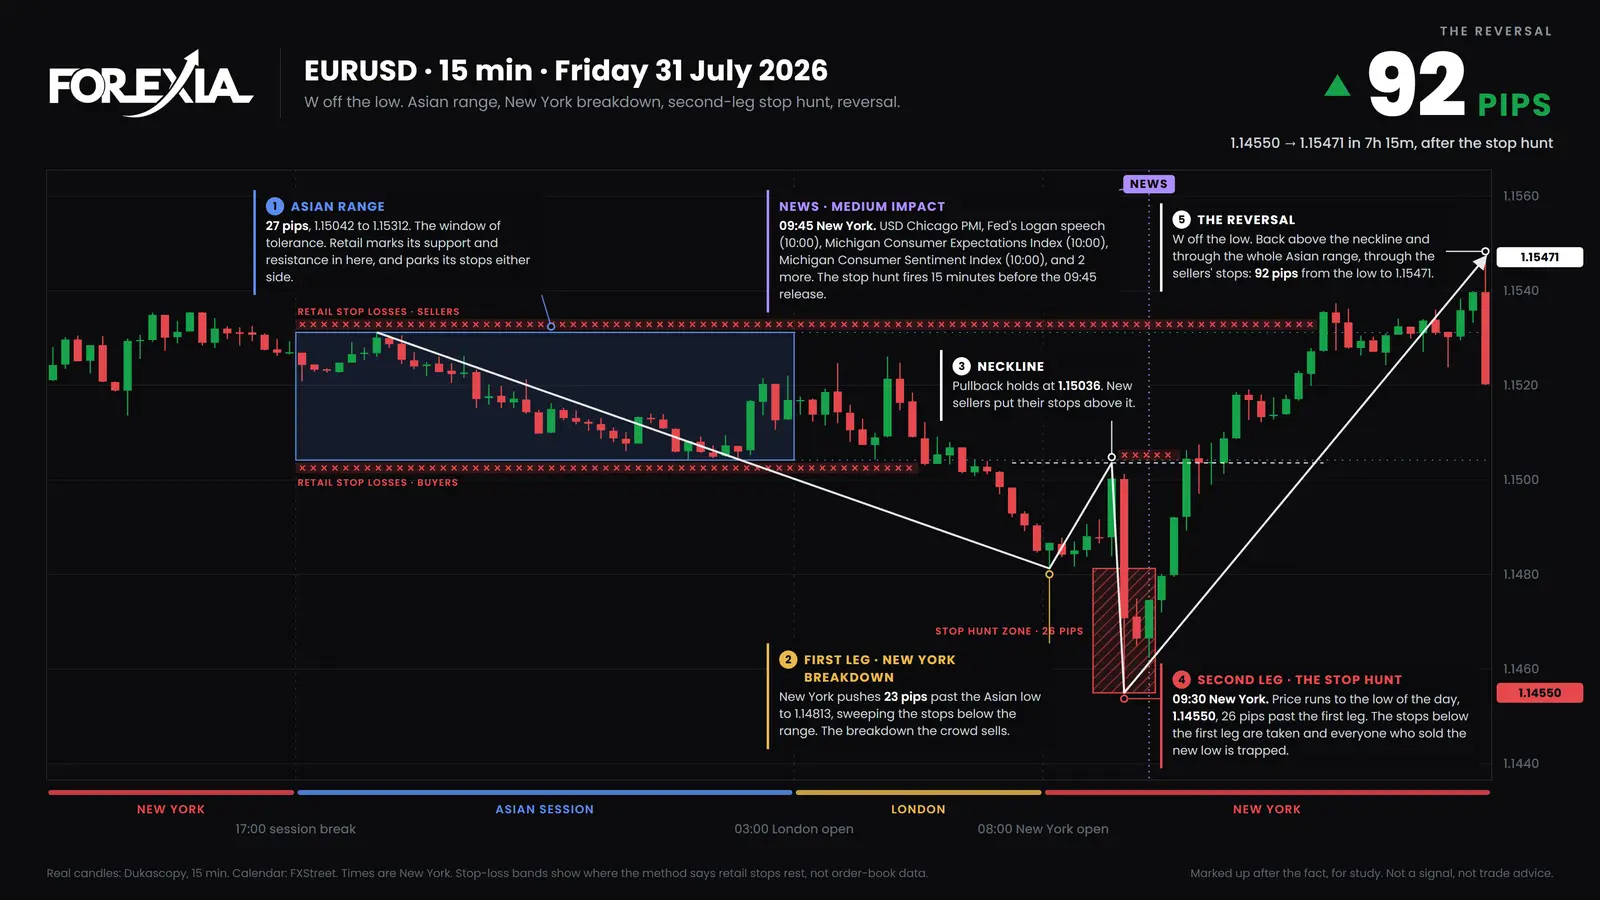
Yes, the order is the same the other way up, and the distances are not. EUR/USD on Friday 31 July 2026 spent the night in 27 pips, 1.15042 to 1.15312. Eight candles came within 2 pips of the bottom, the kind of edge a chart reader starts to trust.
Eurozone inflation came out at 05:00, and the 05:30 candle closed under the box at 1.15034. London carried it to 1.14846 by 07:45, 20 pips under, and New York's first candle went on to 1.14813, which is why our chart labels that leg as New York's. The 09:15 candle climbed back to 1.15036, under a pip short of the box, without closing inside. The next candle fell to 1.14550, the low of the day: 49 pips under the box and 30 past London's low. No release landed on that candle. Chicago's survey came 15 minutes later.
The 10:45 candle closed back inside at 1.15045. The 13:30 candle closed over the box at 1.15355, and the day's last candle reached 1.15471, 92 pips off the low.
Marked up afterwards, both days look obvious. Neither looked it at the time, and two chosen days cannot tell you how often this happens.
How often does a day run all three phases?
About a quarter of the time, on a loose reading. We counted seven majors and gold on 15-minute closes, 1,030 market-days from 6 April to 1 October 2026, with the rollover wick left out of the box.
London closed outside the box on 745 of those days and never did on 285. On 287 of the 745 it had undone its own break by New York's open. That left 458 days with the break still standing, and a New York candle closed back inside on 264 of them. So 264 of 1,030 fit the three phases in order, and on 91 of those New York first ran past London's extreme, as both days above did. The table is on our forex sessions page, and the NY session reversal has its own guide.
The Chaos Pattern is a way to ask which phase the chart is in. It is not a forecast of the day.
What does a day look like when nothing breaks?
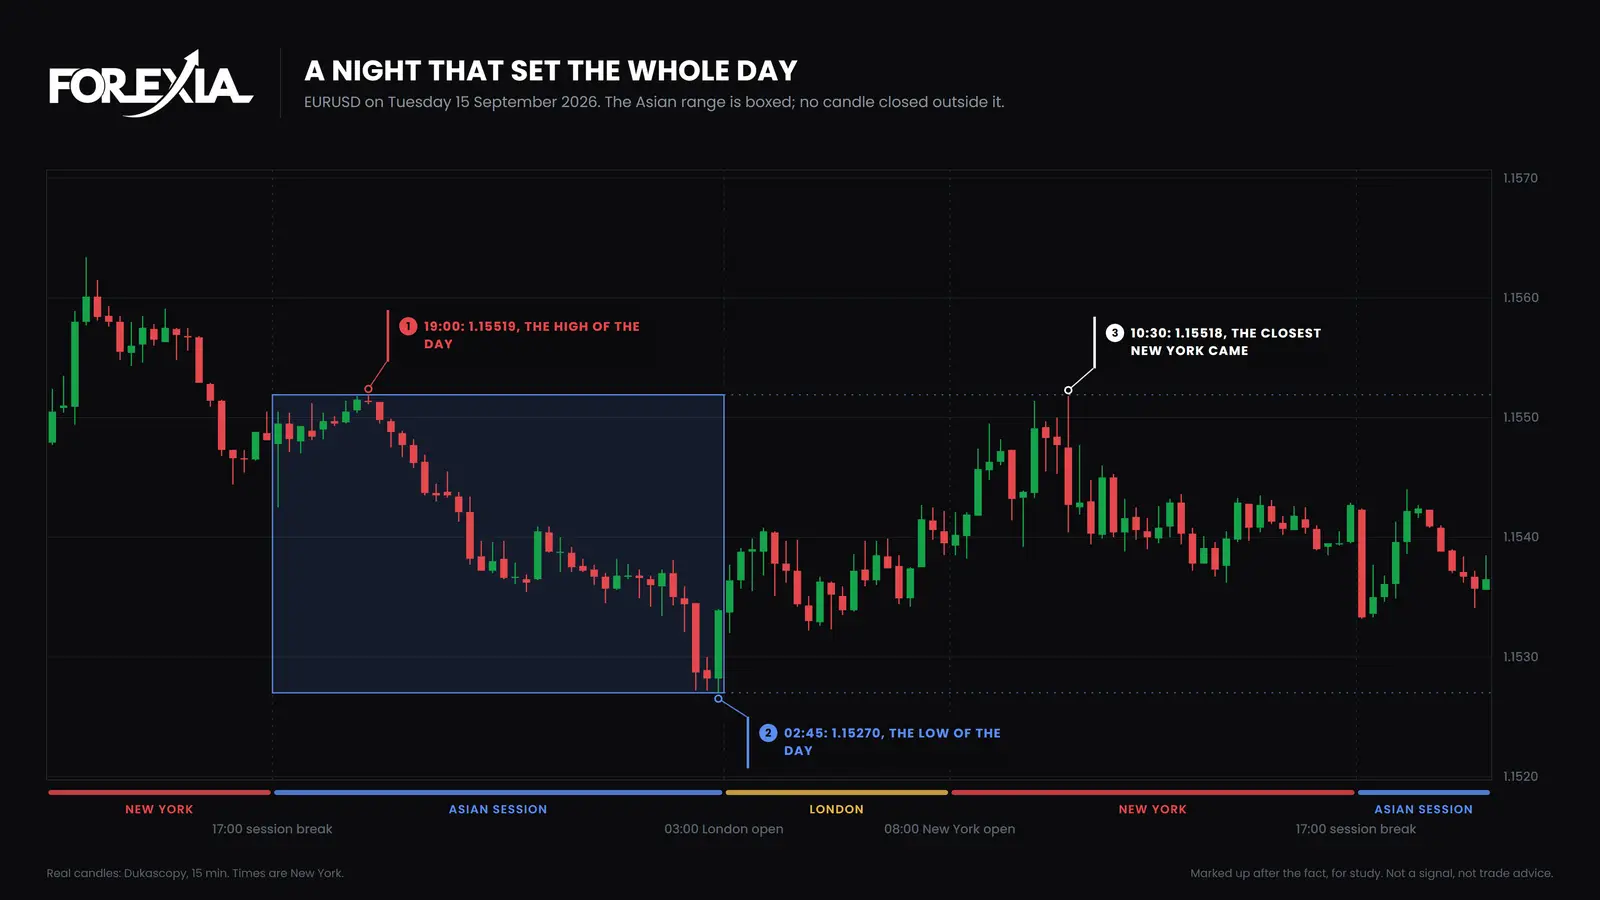
It looks like EUR/USD on Tuesday 15 September 2026. Asia ran 25 pips, from 1.15519 at 19:00 Monday to 1.15270 at 02:45, and that was the whole day. No candle closed outside the box. London stayed between 1.15320 and 1.15427. New York came closest on the 10:30 candle, at 1.15518, a tenth of a pip short of the high.
Nothing big was scheduled for it either: the calendar held only medium-impact items, including the ZEW survey and New York's manufacturing survey. Every strategy that waits for a break had nothing to do.
That night's high still mattered. The next morning London ran through it, in a London open stop hunt that closed back on the same candle. A level can wait a day.
What do the three seats see in the Asian session?
The Three Seats read one night three ways.
- Retail sees a dull night, then a breakout, then a reversal from nowhere. Those are three separate events, and the second looks like the one worth joining.
- The market maker, as we read it, sees one plan. Orders build on both sides of a quiet range, London's break brings the crowd in on one side, and that crowd becomes the other side of a large position.
- The observer calls no direction. The observer asks which phase has been reached and what closed where. On USD/CHF that meant reading London's 16 pips as the second phase and not the last.
Nobody can see who sold at 0.81142. We can see where it closed.
Is an Asian session strategy worth trading?
Not on anything we can show you. We have not tested the night's range trade, so we cannot say whether it pays. We did test the setup built on this range: run as a mechanical rule, it did not make money, in London or in New York. Many breaks carry, and many hunts have another leg. If you want to test one yourself, write it down first and count every day, including days like 15 September.
The breakout version also has a problem of its own, which is who else is in it: why the London breakout fails follows that crowd. For more dated examples, the USD/CHF markup from the week of 21 September 2026 is a later USD/CHF day, marked up the same way.
Common mistakes
All three come from reading a part of the day as the whole of it.
- Taking 16 pips for the whole day. On USD/CHF London was 16 pips over the box by 06:15, and by 14:30 price was 81 pips off the high. On 194 of 745 days the break did stand, and the break alone cannot tell you which day it is.
- Going by a candle that only came close. EUR/USD's 09:15 candle came back to under a pip from the box and did not close inside. The next candle went 49 pips under it.
- Expecting all three phases every day. On 285 of 1,030 market-days London never closed outside the box, and on 15 September neither did New York.
Course 2 of ForexiaPRO, The Chaos Pattern, teaches this read step by step, from lesson 2.1.1, Asia Sets It, London Breaks It, New York Turns It.
Frequently asked questions
What is the best Asian session strategy?
We cannot name one. Guides teach two: trade inside the night's range, or trade its break at the London open. We have not tested the first. Run as a mechanical rule, our own setup built on this range did not make money in London or in New York. This page shows what the session did, not a rule to trade it.
Which pairs move most in the Asian session?
As a share of their own day, NZD/USD, USD/JPY and AUD/USD. Asia's median range was 63%, 62% and 60% of the day's range on those three, against about 45% on EUR/USD, GBP/USD and USD/CAD, from 6 April to 1 October 2026. More of the day's range does not mean more profit.
Does London always break the Asian range?
No. On 285 of 1,030 market-days from 6 April to 1 October 2026, no London candle closed outside the range. On EUR/USD on 15 September 2026 no candle of the whole day did: the night's high and low were the day's.
Does New York always reverse London?
No. Of the 458 market-days when London's break still stood at New York's open, a New York candle closed back inside the range on 264 and did not on 194. New York pushed past London's extreme before closing back on 91 of them.