London Open Stop Hunt: What the Break of Yesterday's Extreme Looked Like
Dylan Forexia7 min read
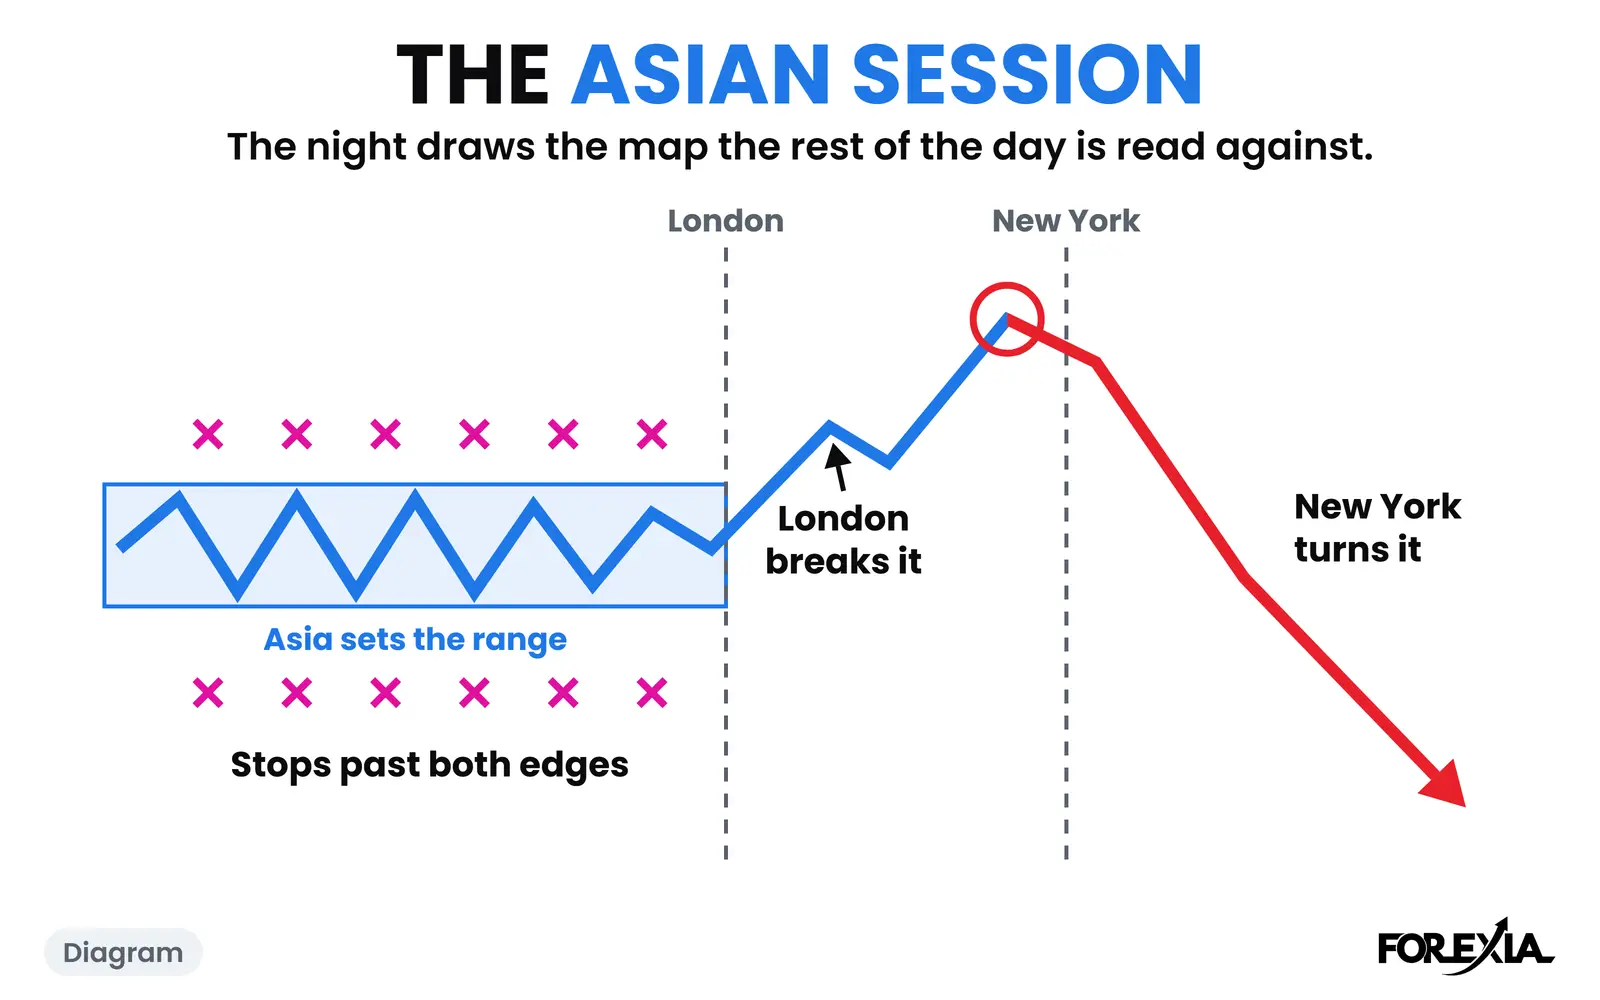
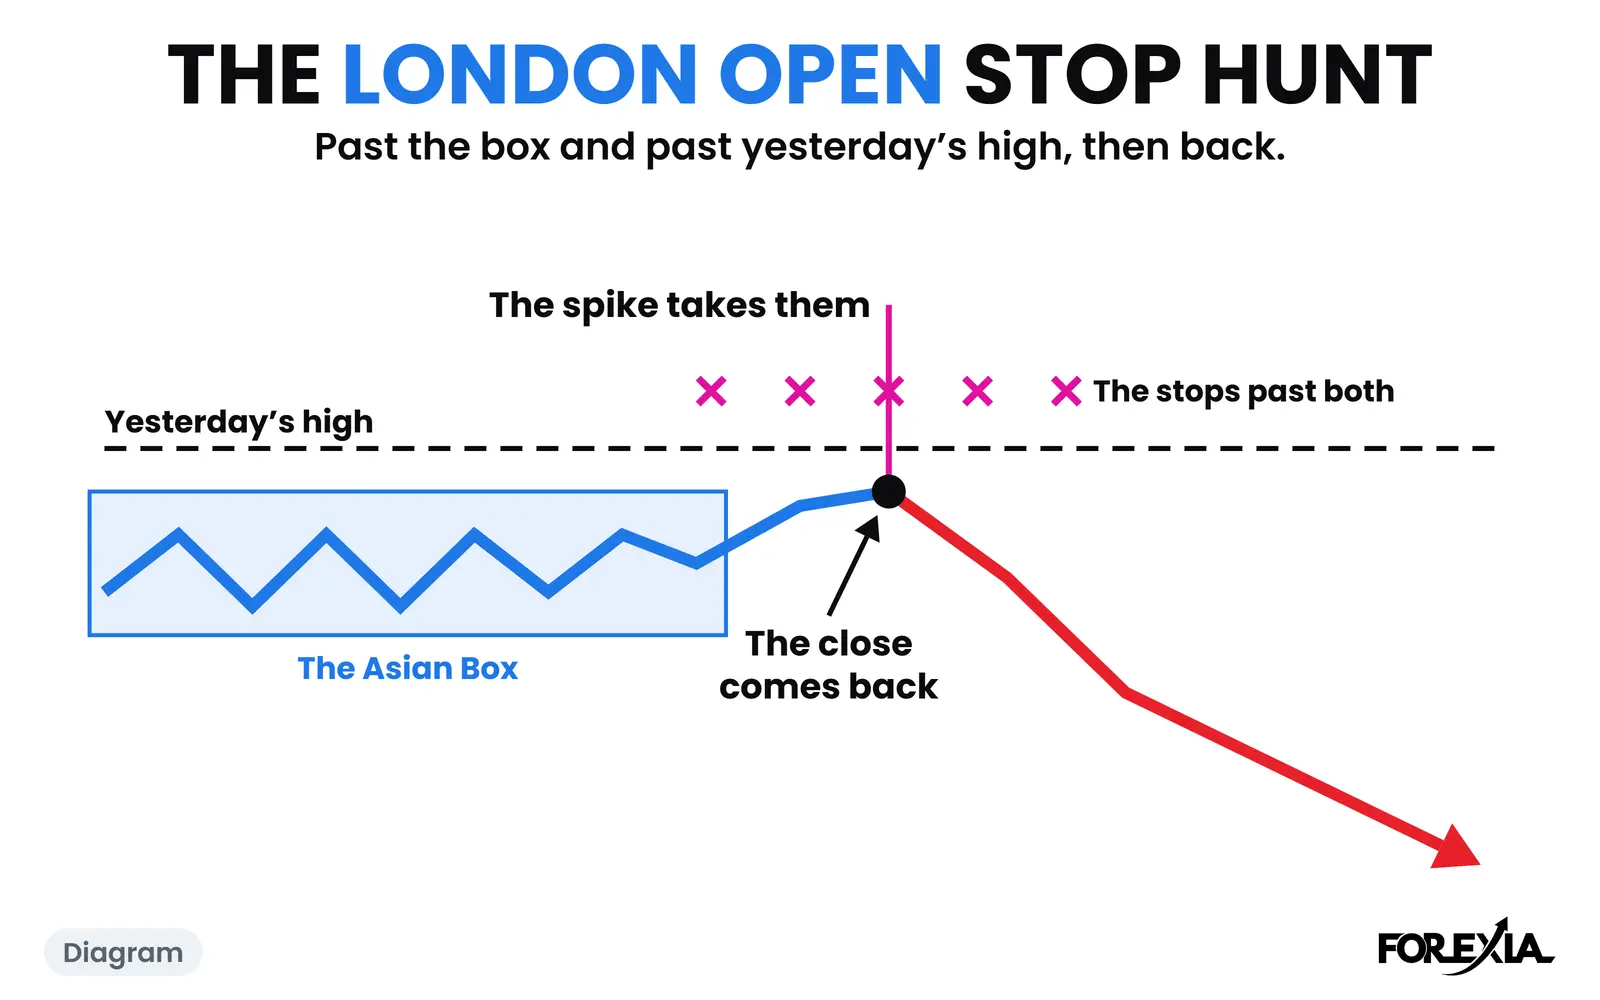
A London open stop hunt is a run past a level in London's first hours that takes the stops resting there and then closes back behind it. The clearest go past the Asian range and yesterday's high or low together. Here is what that looked like on EUR/USD and on gold, and on a day when the break stayed.
What is a London open stop hunt?
It is the Stop Hunt, what most traders call a liquidity sweep, happening where two pools sit close together. The UK's desks were the largest in the FX market in the BIS's April 2025 survey, and by the time they open the night's stops are a few pips from the price.
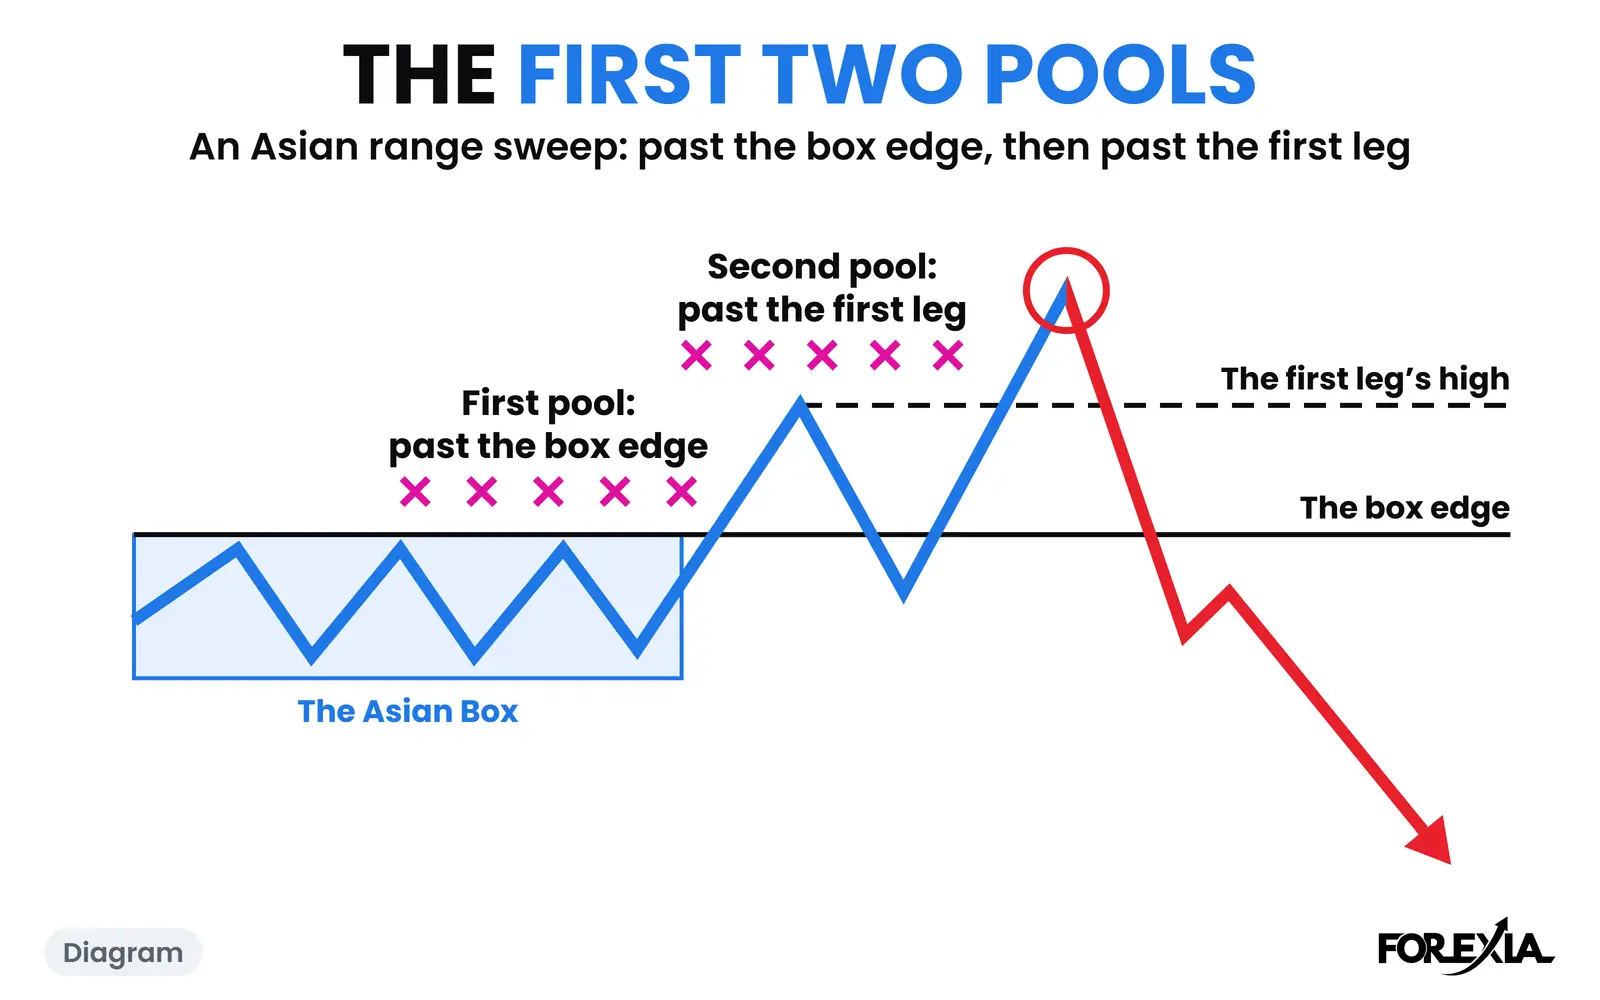
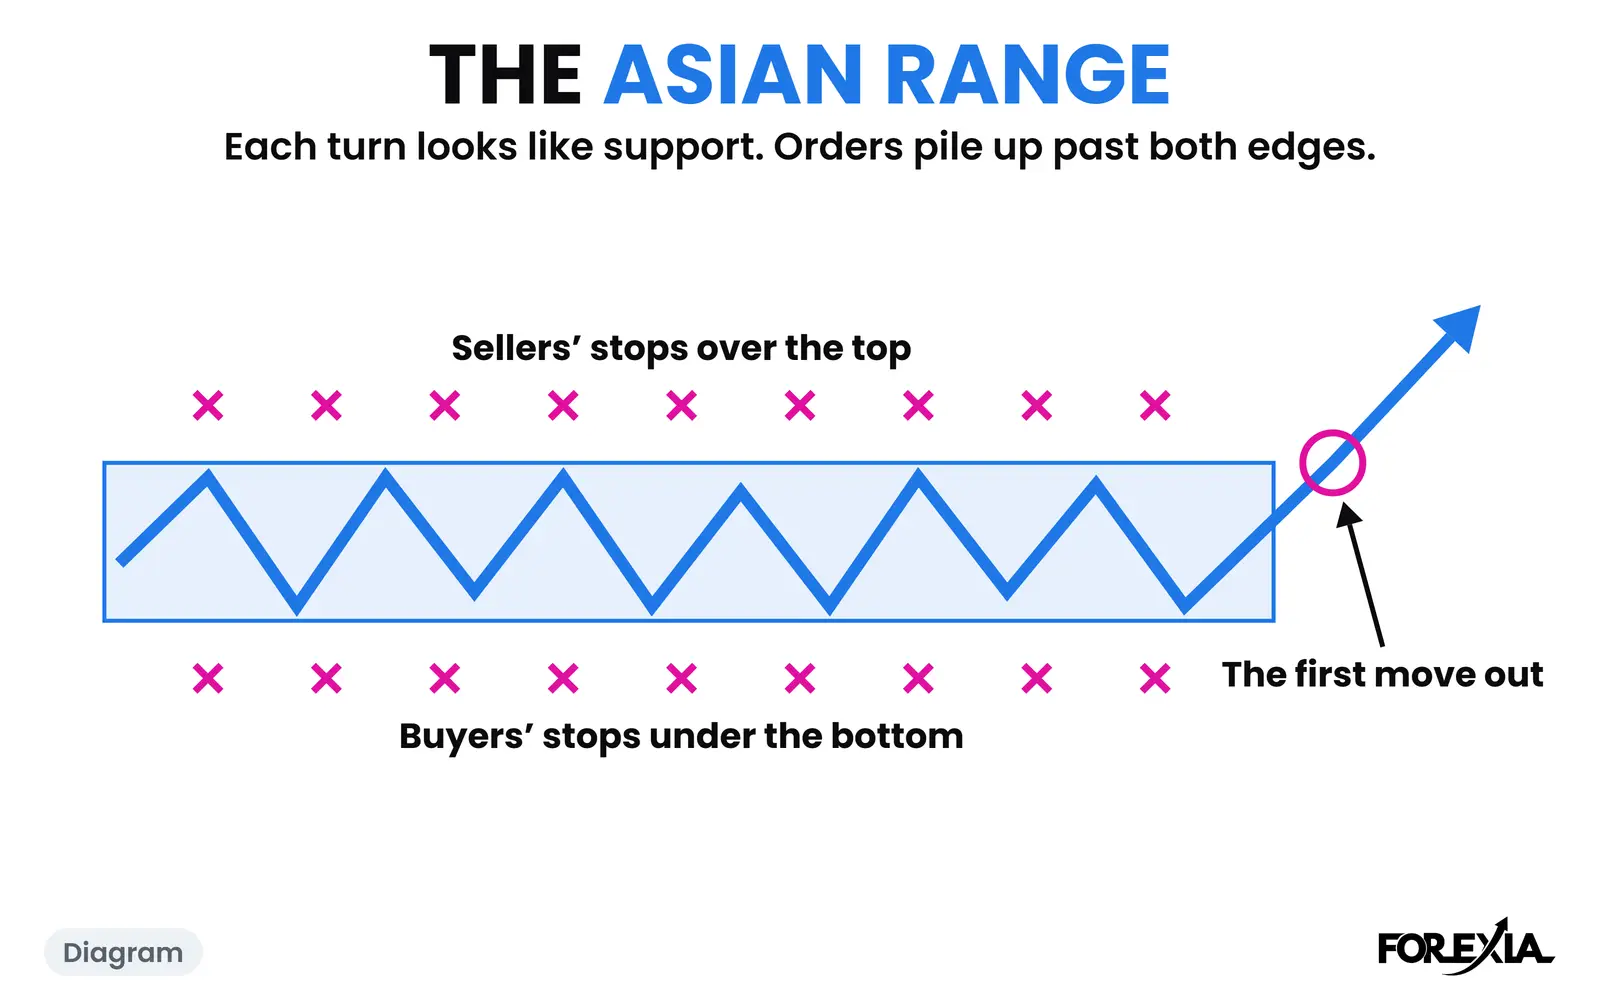
Yesterday's high is two sets of orders. Over it rest the stops of everyone who sold under it. Over it too wait the buy orders of everyone who will trade its break. Our page on the previous day's high and low has more on that. When the Asian Box sits just under that line, the box's stops and yesterday's sit almost together, and a small move can reach both.
Other guides file this under one hour on the clock and treat the hour as the event. We look at what the candles did past the level, and those hours are on our forex market hours page if you need them.
What did a London open stop hunt look like on EUR/USD?
It took one candle. EUR/USD on Wednesday 16 September 2026 spent the night in 20 pips, 1.15318 to 1.15516. Tuesday's high sat almost exactly on the top of that box, at 1.15519, and Tuesday's low was 5 pips under the bottom. On this page a candle is named by the New York time it opens.
London's third candle, at 03:30, ran from 1.15502 to 1.15565: 5 pips past the box and past Tuesday's high, on a 6-pip candle. It closed at 1.15516, back under Tuesday's high and on the top of the box. The run and the return came on one candle, and that return is the close back. That candle's high was the high of the day.
By 07:00 price had reached 1.15308, 26 pips under that high. Then came the things the crowd was watching. US retail sales at 08:30 took price to 1.15278, and that candle closed back in the box at 1.15357. The Fed's decision at 14:00 printed a candle from 1.15469 to 1.15006. By 16:15 price was at 1.14607, 96 pips under the high and 71 under the box.
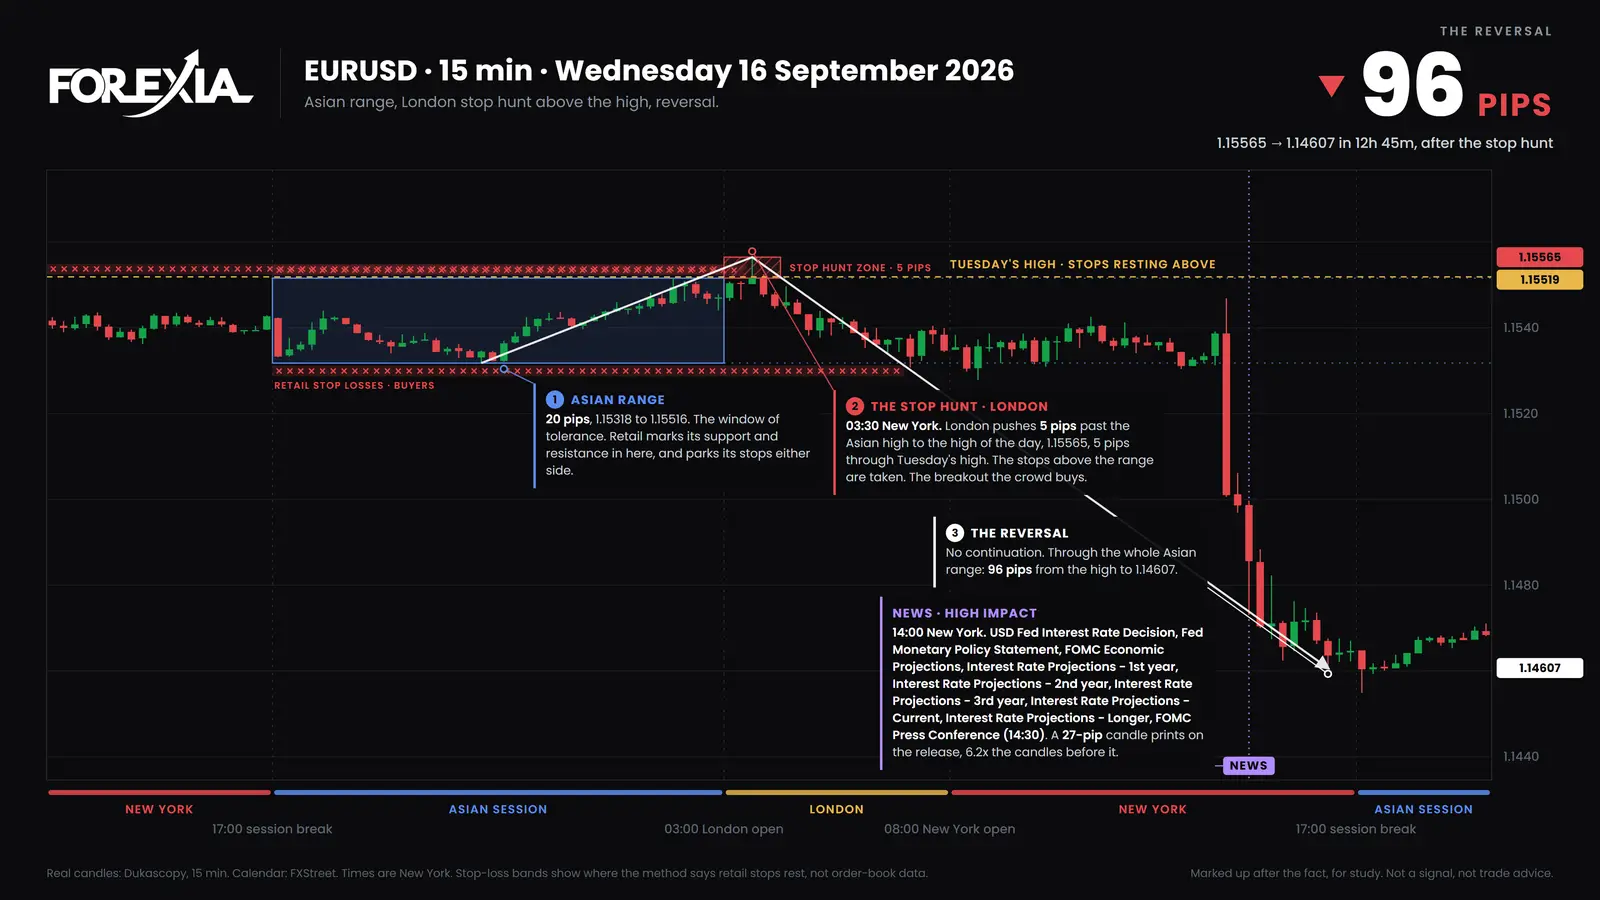
Keep a caution beside that 96. Much of it came on the Fed's candles, and a rate decision moves the dollar for its own reasons. What the morning shows is smaller: the level went, the candle came back, and that high was not reached again that day.
Does gold do the same thing at London's open?
It can, and it did so later and more slowly. On gold on Friday 25 September 2026 the box ran $40, 4255.93 to 4295.44, and we count $1 as 1 pip. Thursday's high sat $7 over it, at 4302.86, and Thursday's low $12 under it.
Every close of London's first three hours stayed inside the box. Then the 06:00 candle ran from 4294.56 to 4307.98 and closed at 4307.10: $12 over the box and $4 past Thursday's high. It did not come back. An hour later the 07:00 candle reached 4315.55, $20 over the box and $13 past the level.
The 07:30 candle closed under Thursday's high at 4301.44, an hour and a half after the level went. That was not tidy either: the 08:15 candle closed over it again at 4306.23, before the 09:00 candle closed back inside the box at 4292.40. By 10:00 gold was at 4254.40, $61 under the high and $2 under the box. Only medium-impact US releases fell in that stretch.
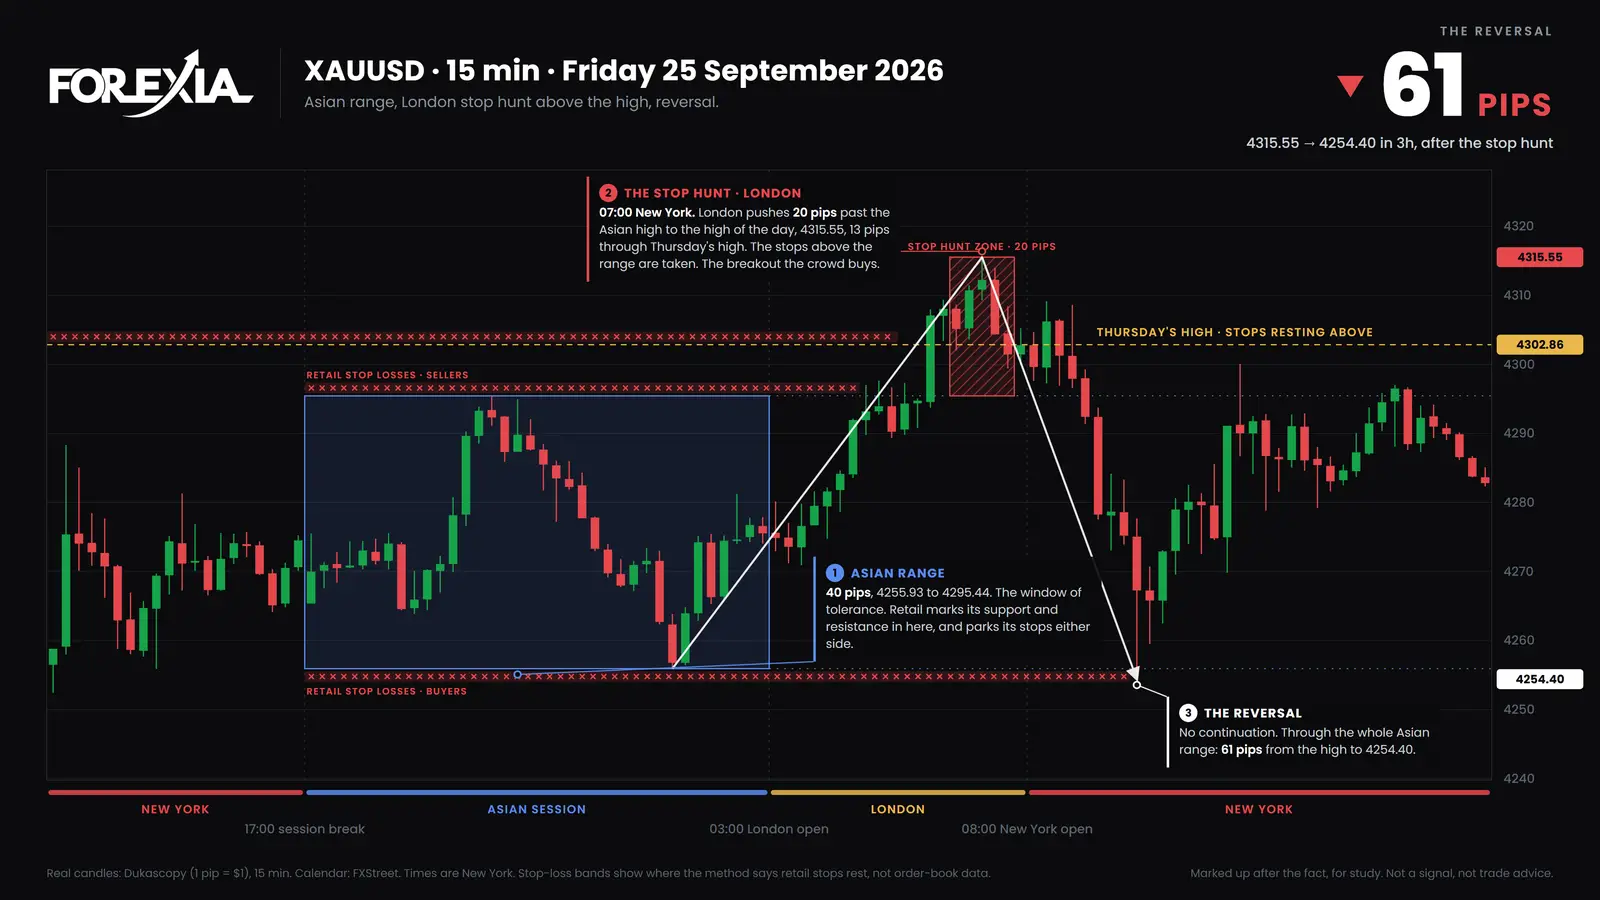
So one level closed back on its own candle and one took ninety minutes and a retest. Our chart markups show more days like these.
What about the day it does not close back?
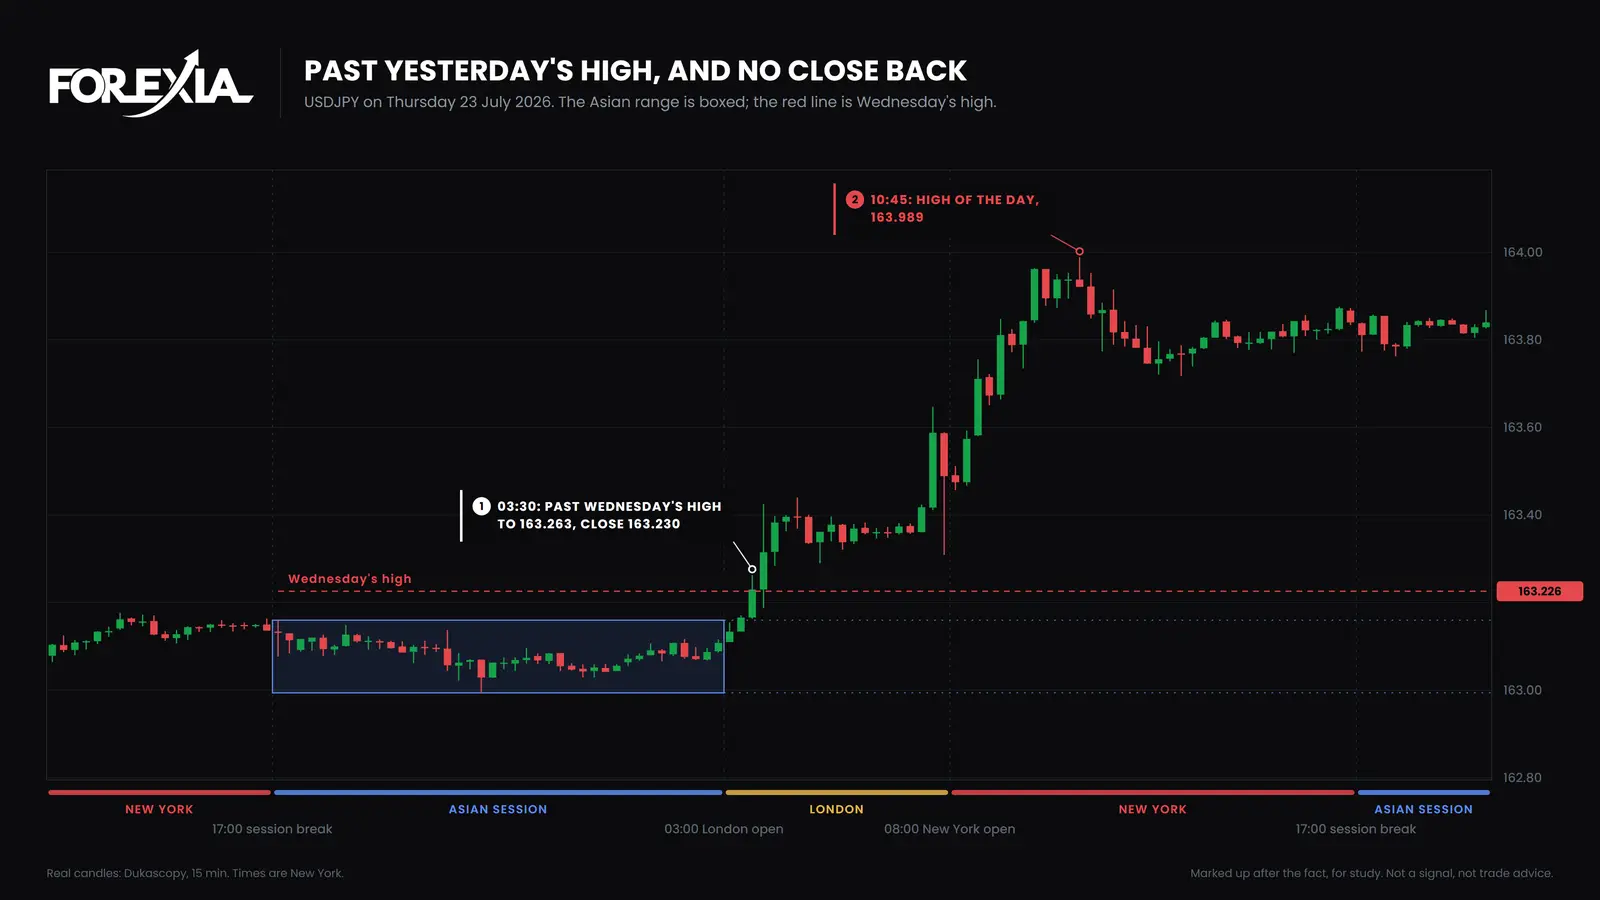
Then the level broke, and there was no hunt to read. USD/JPY on Thursday 23 July 2026 looked the same at first. The night's box ran 17 pips, 162.994 to 163.160, with Wednesday's high 7 pips over it at 163.226.
The 03:30 candle ran past that high to 163.263 and closed at 163.230, less than half a pip beyond it. At that moment it looks like the start of what EUR/USD did. Instead the 03:45 candle closed at 163.315, and no candle closed back under Wednesday's high for the rest of the day. The high was 163.989 at 10:45, 76 pips past the level, and the only item on the calendar was medium-impact US jobless claims.
How often does yesterday's high or low close back?
Usually, on the same day, and that does not make it a signal. We counted seven majors and gold on 15-minute candles from 6 April to 1 October 2026. A level is taken when a candle from the London open to 17:00 New York trades past it by at least 3% of the market's average day. A level Asia had already passed is left out. That gives 422 previous-day levels taken. Of those 422:
| First close back behind the level | Levels |
|---|---|
| On the candle that took it | 118 |
| Within the next hour | 146 |
| Later that day | 77 |
| Not by 17:00 | 81 |
Depth is the clearest difference. The ones that closed back on the same candle went a median 5% of the average day past the level. The 81 that never closed back went a median 68%. That is known only afterwards, because every level starts out shallow, as USD/JPY's did at 03:30.
Two more limits. This covers the whole of London and New York, not just the first hours, and a release can do the taking. And a close back does not end it: on 205 of the 341 that closed back, price traded past the same wick again later that day. These are candles and not trades. Run as a mechanical rule, our own test of the setup did not make money. The full picture of stop hunts is on its own page.
What did each seat see?
The Three Seats read that 03:30 candle on EUR/USD differently.
- Retail saw the strongest signal on the chart. The range broke and yesterday's high broke with it, so the trend must have started.
- The market maker, as we read it, saw both piles fill at once. Every stop and every breakout buy arrive in the same few pips, which is the moment to sell size. Nobody can show that anyone did. The chart shows only where the candle closed.
- The observer watched what the next candles did. On EUR/USD that was one candle, on gold six, and on USD/JPY the answer was that it kept going.
The next step for a day like EUR/USD's is a London session reversal, when London does the whole turn itself.
Common mistakes
All three treat the break as the news.
- Reading the break of yesterday's high as strength. On the euro that candle held the high of the day. On USD/JPY price went on another 76 pips past the level. Both candles were London's third, and both closed within half a pip of the level, one on each side.
- Expecting the high on the first candle past the level. On gold that candle closed beyond Thursday's high, and the high came an hour later, $8 higher than that candle's own high.
- Treating the open as a minute. The euro's level went on London's third candle and gold's three hours in. London's open is a stretch of hours.
Course 2 of ForexiaPRO, The Chaos Pattern, teaches this read step by step in lesson 2.2.2.
Frequently asked questions
Does a stop hunt happen at the exact London open?
Not at a fixed minute. On EUR/USD on 16 September 2026 it came on London's third candle. On gold on 25 September 2026 the level went three hours in. Usually at the open means London's first hours, and a chart shows it only as it happens.
How do you tell a London open stop hunt from a real break?
Only by what closes next, and only afterwards. EUR/USD closed back under yesterday's high on the candle that took it. Gold took an hour and a half. USD/JPY on 23 July 2026 never closed back. The first candles of those three days do not tell you which you are watching.
How often does yesterday's high or low close back the same day?
Often, and that is no signal by itself. Of 422 previous-day levels traded through by at least 3% of the average day, from 6 April to 1 October 2026, 341 closed back by 17:00 New York and 81 did not. Of those 341, 205 traded past the same wick again later that day.
Is a London open stop hunt a setup?
Not by itself. A reversal seen afterwards is not a setup. Run as a mechanical rule, our own setup built on hunts like these did not make money in London or in New York. Treat these days as study of what happened.