Asian Range Forex: Why Ten Quiet Hours Are Where the Orders Sit
Dylan Forexia8 min read
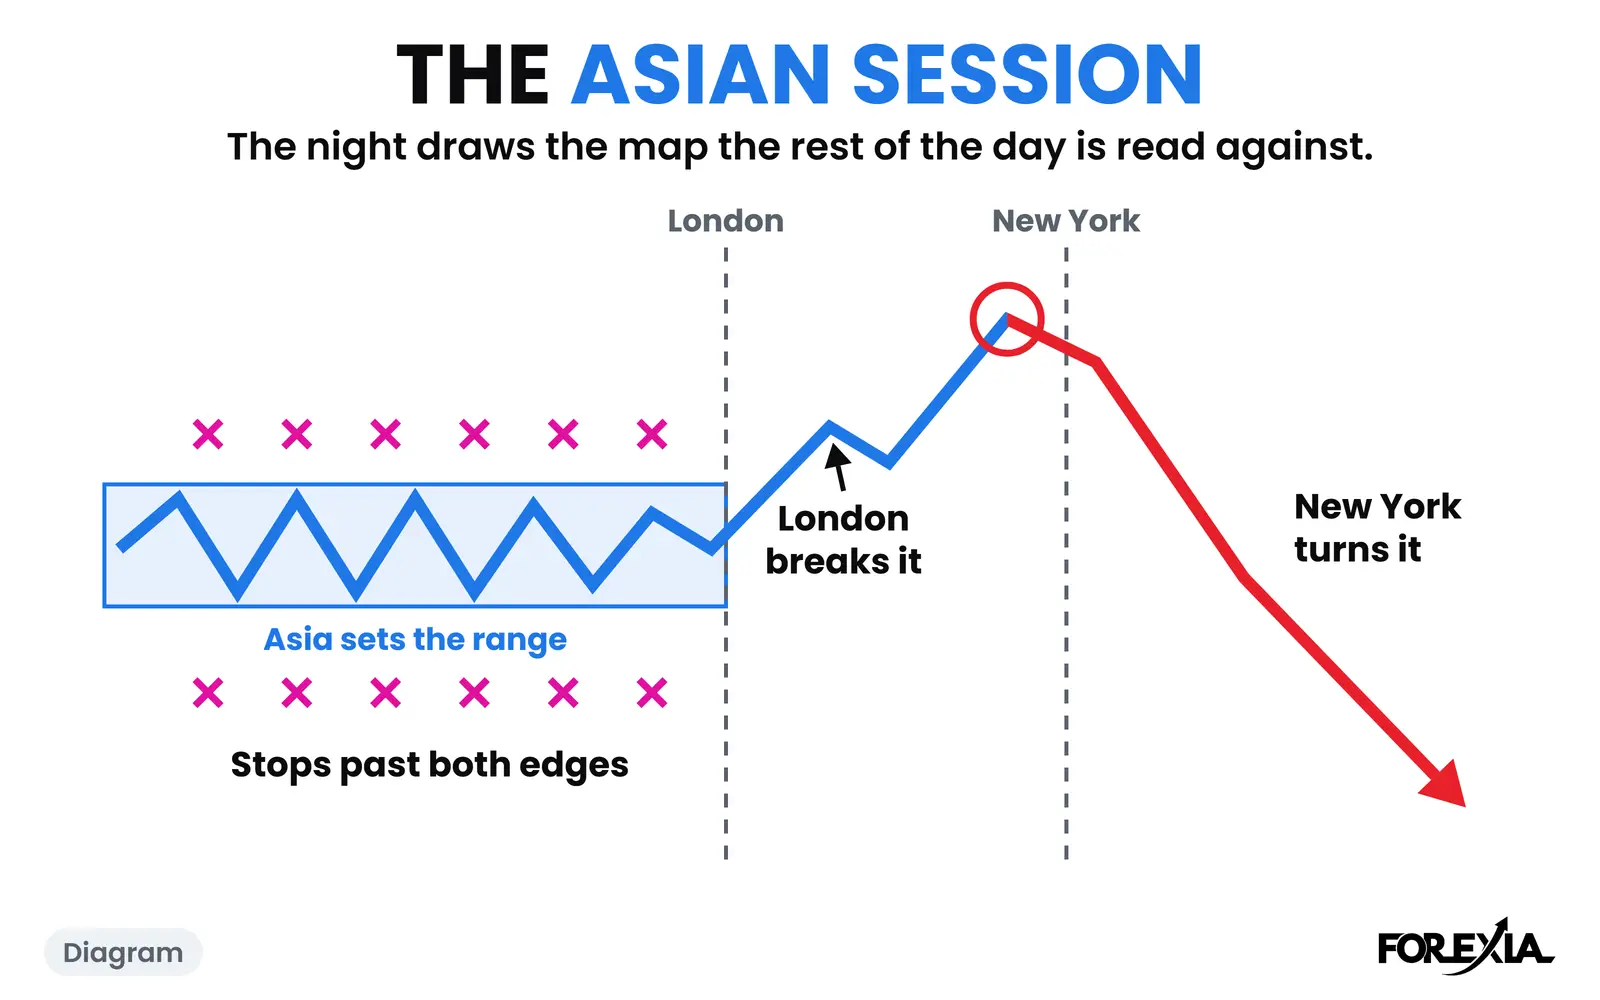
The Asian range in forex is the high and low of the quiet hours between the session break and the London open. It is only a measurement. What matters is what those hours do: orders pile up, stops settle past both edges, and the first move out looks like the one everyone waited for.
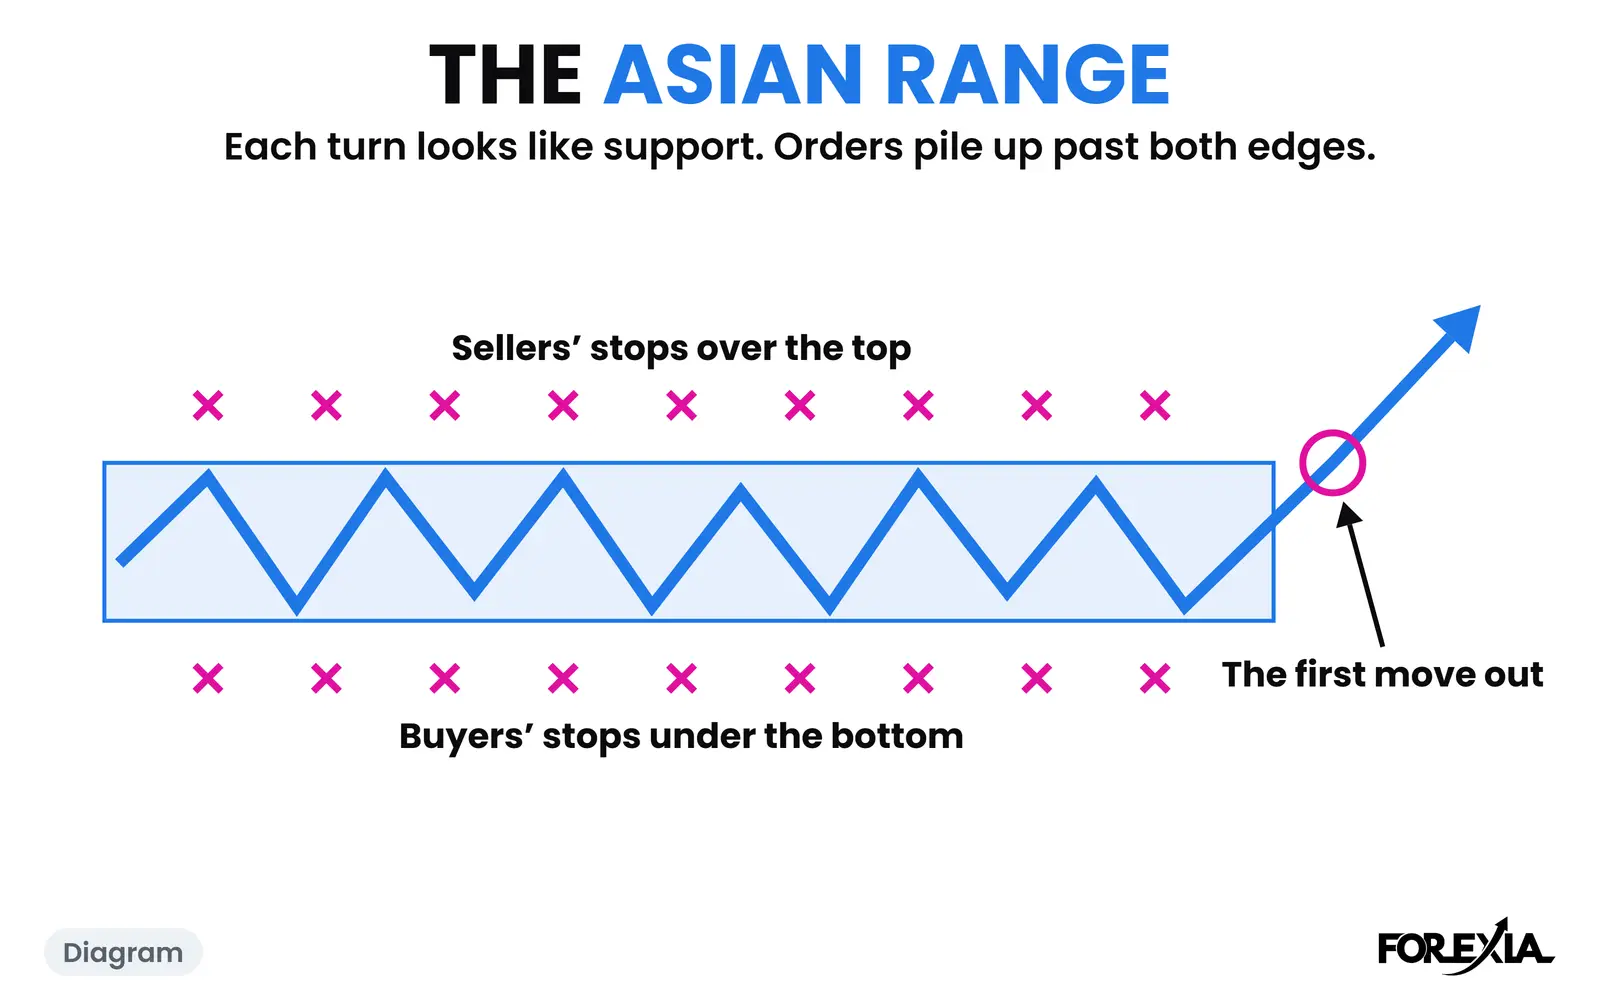
Drawn on the chart, that range is the Asian Box. The hours inside it, seen as what they do to traders, are the Window of Tolerance. This page is about what those ten hours are for.
What is the Asian range in forex, and what is it for?
It is a pair of lines most traders can agree on by the time London opens, and we read those hours as a slow build. Every few pips someone buys near the bottom or sells near the top, and each of those trades leaves a stop just outside the range. The more often price turns at an edge, the more the crowd trusts it, and the more stops sit just past it. Ten hours of a few pips also wears traders down, so the first real move looks like the one they were waiting for.
The orders we cannot show you: nobody outside a broker's book sees them, so that part is a reading of the structure. The trust and the impatience you can check against your own trading.
The window differs from guide to guide: 19:00 to midnight New York on one page, 20:00 to midnight on another. We count from the session break to the London open, which is ten hours on the line a chart can draw for you, so nothing needs converting. How to mark it on the wicks has its own page, and the hours in your own time are on our page about forex market hours.
What does a tight Asian range look like?
It looks like nothing at all. GBP/USD on Wednesday 12 August 2026 spent the night in 10 pips, 1.35008 to 1.35112. Its 40 candles averaged 2.5 pips each, against a pair whose median night is 30 pips. On this page a candle is named by the New York time it opens.
Price came back within a pip of the top on five candles and within a pip of the bottom on three, and every close sat inside 8 pips. London's open changed nothing. Twelve hours after the session break, price was still inside about 11 pips.
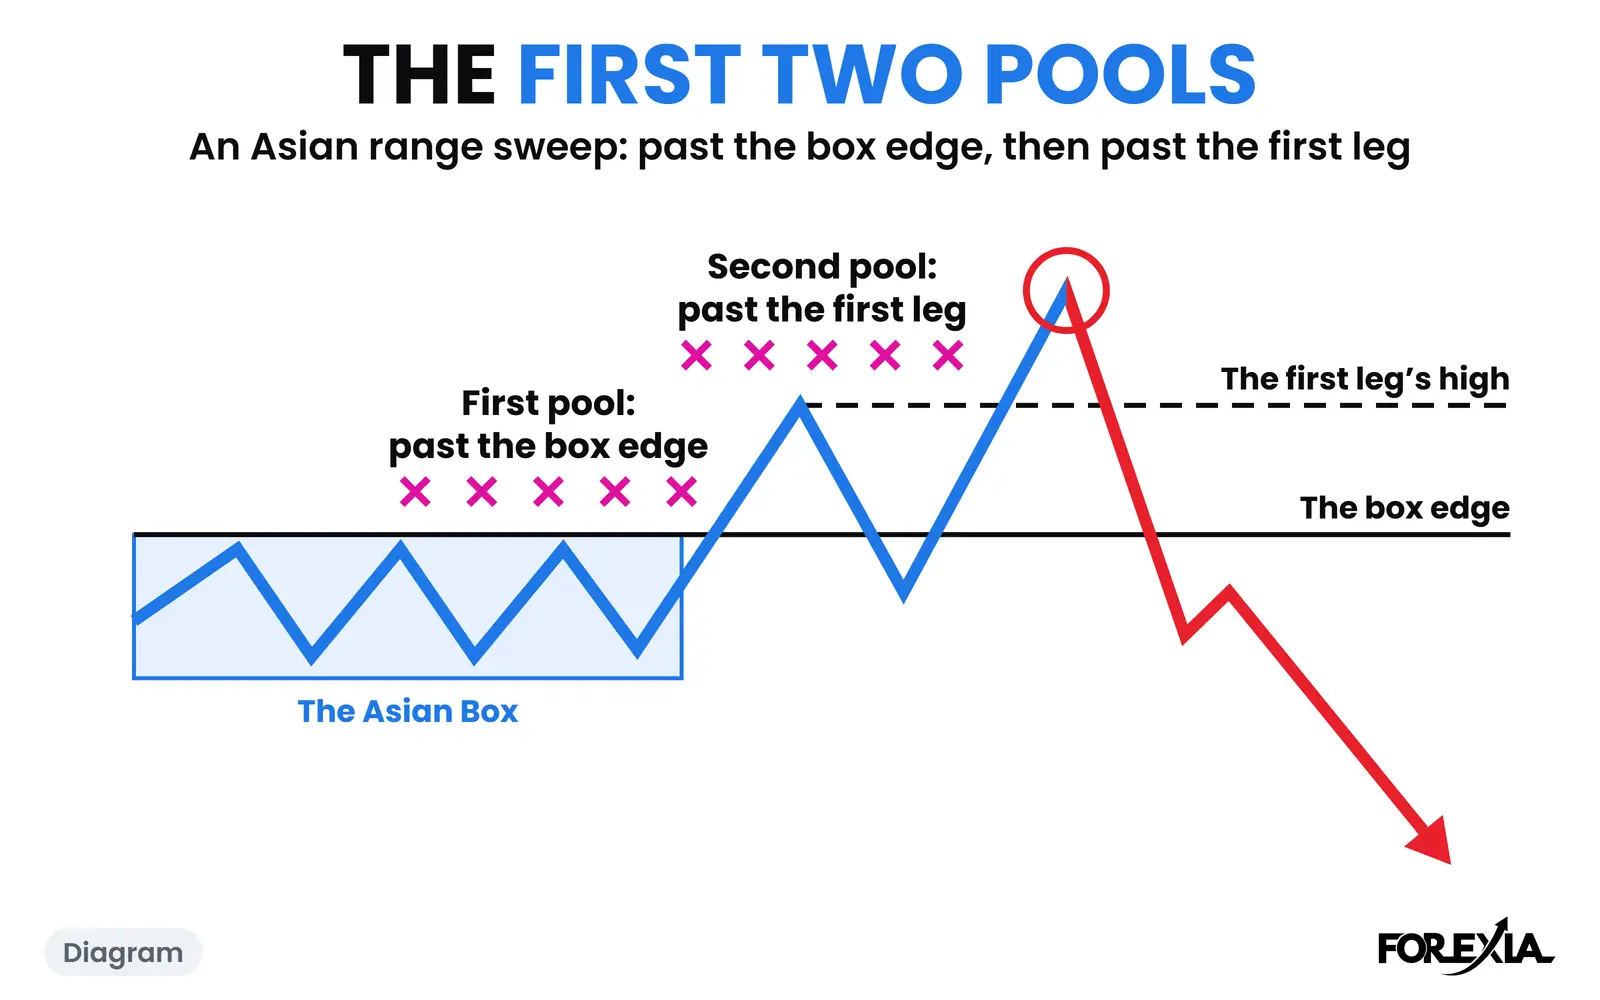
The 05:00 candle was the first to close out, at 1.35185, 7 pips over the top. After twelve hours of waiting, that was the move. The next candle ran to 1.35292, 18 pips over the box. US inflation figures at 08:30 took it to 1.35454, 34 over, in a candle that also dipped to 1.35070 and closed at 1.35377.
The 10:45 candle closed back inside at 1.35088. The 12:45 candle closed under the box at 1.34968, and by 15:00 price was at 1.34874: 58 pips under the high, 13 under the box, and 31 under the candle that had looked like the move everyone waited for.
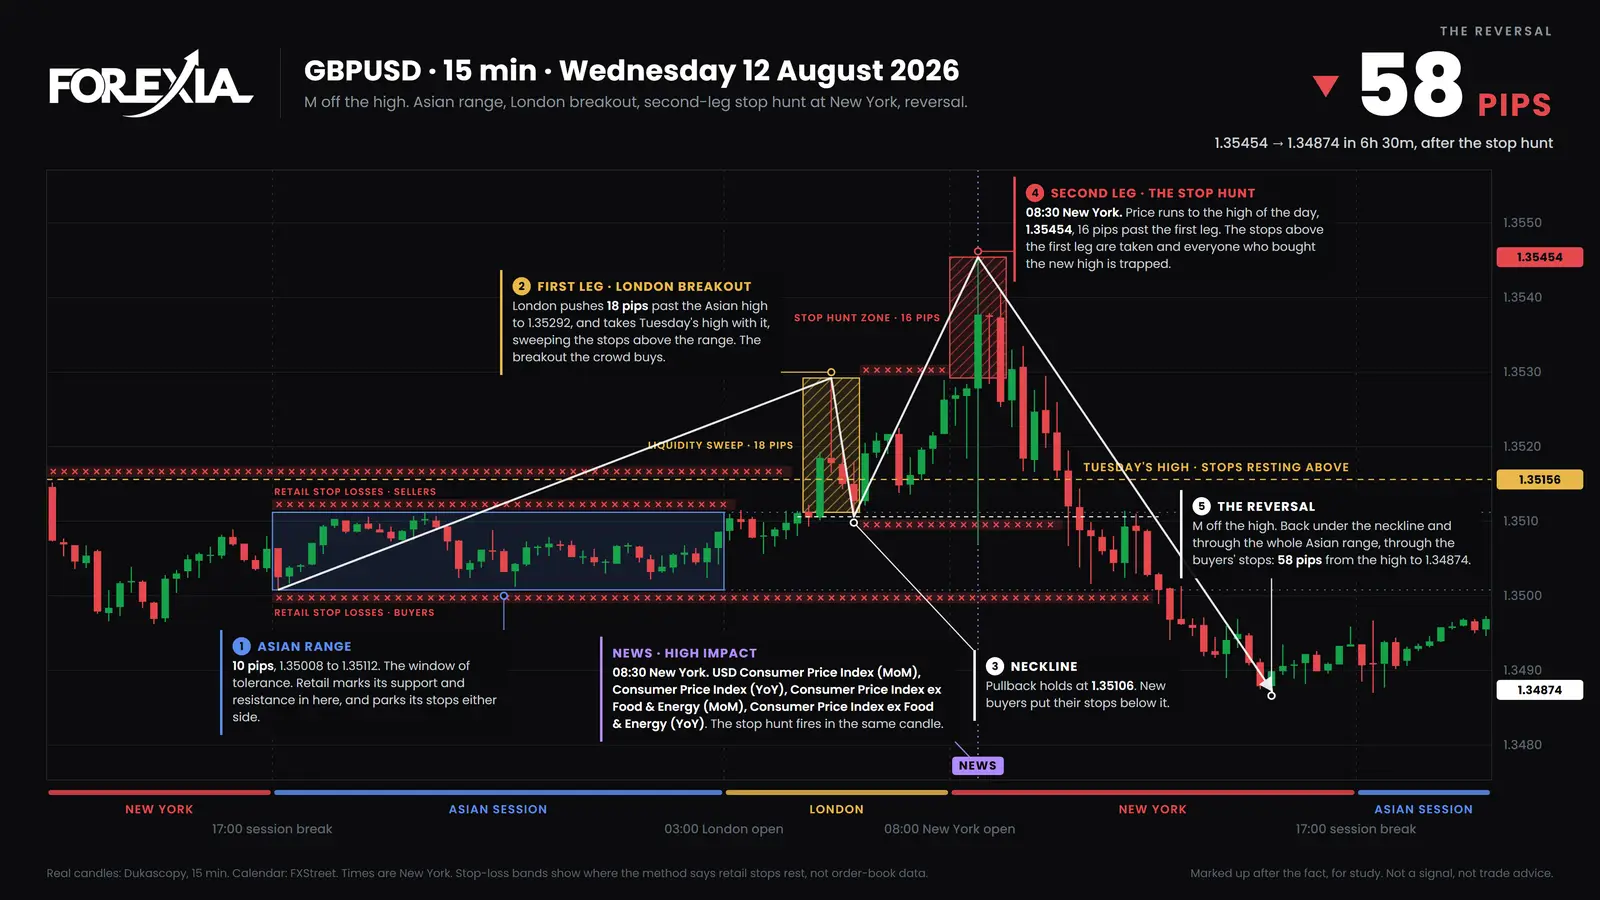
Keep the release in mind. CPI moved every dollar pair that morning, and that candle did much of the work. The chart shows where price went, not who sent it there.
What did each seat see?
The Three Seats read that night differently.
- Retail saw a dull night and an edge that held. Then a breakout, the first thing in twelve hours worth doing. That crowd is Dumb Money, which is our word for a predictable crowd and not a comment on anyone's brains.
- The market maker, as we read it, saw orders piling up on both sides, held there by time. Sellers' stops over 1.35112, buyers' stops under 1.35008, and breakout orders waiting beyond each.
- The observer wrote down what the night had done. Ten hours, 10 pips, five trips to within a pip of the top and three to the bottom. Marking such places before the session is Liquidity Mapping.
What happens to the support the night builds?
It gets used, as often as not. GBP/USD on Thursday 27 August 2026 ran a 13-pip night, 1.35850 to 1.35977, and in its last hours it went back to the bottom edge again and again. It came within a pip at 01:15 and at 02:45. To a chart reader that is support, tested and held.
The 04:30 candle, an hour and a half into London, closed under it at 1.35843. The stops of anyone who had bought that support sat just there, and anyone selling the break was now in. By 06:00 price had reached 1.35705, 15 pips under the box and past Wednesday's low of 1.35829.
Then the other side. The 09:00 candle closed back inside at 1.35873, and the 09:15 candle reached 1.36024, 32 pips off the low and 5 over the top. By 10:45 price was back at 1.35798. Both edges had been traded through within seven hours of the London open, and no high-impact release lined up with any of it.
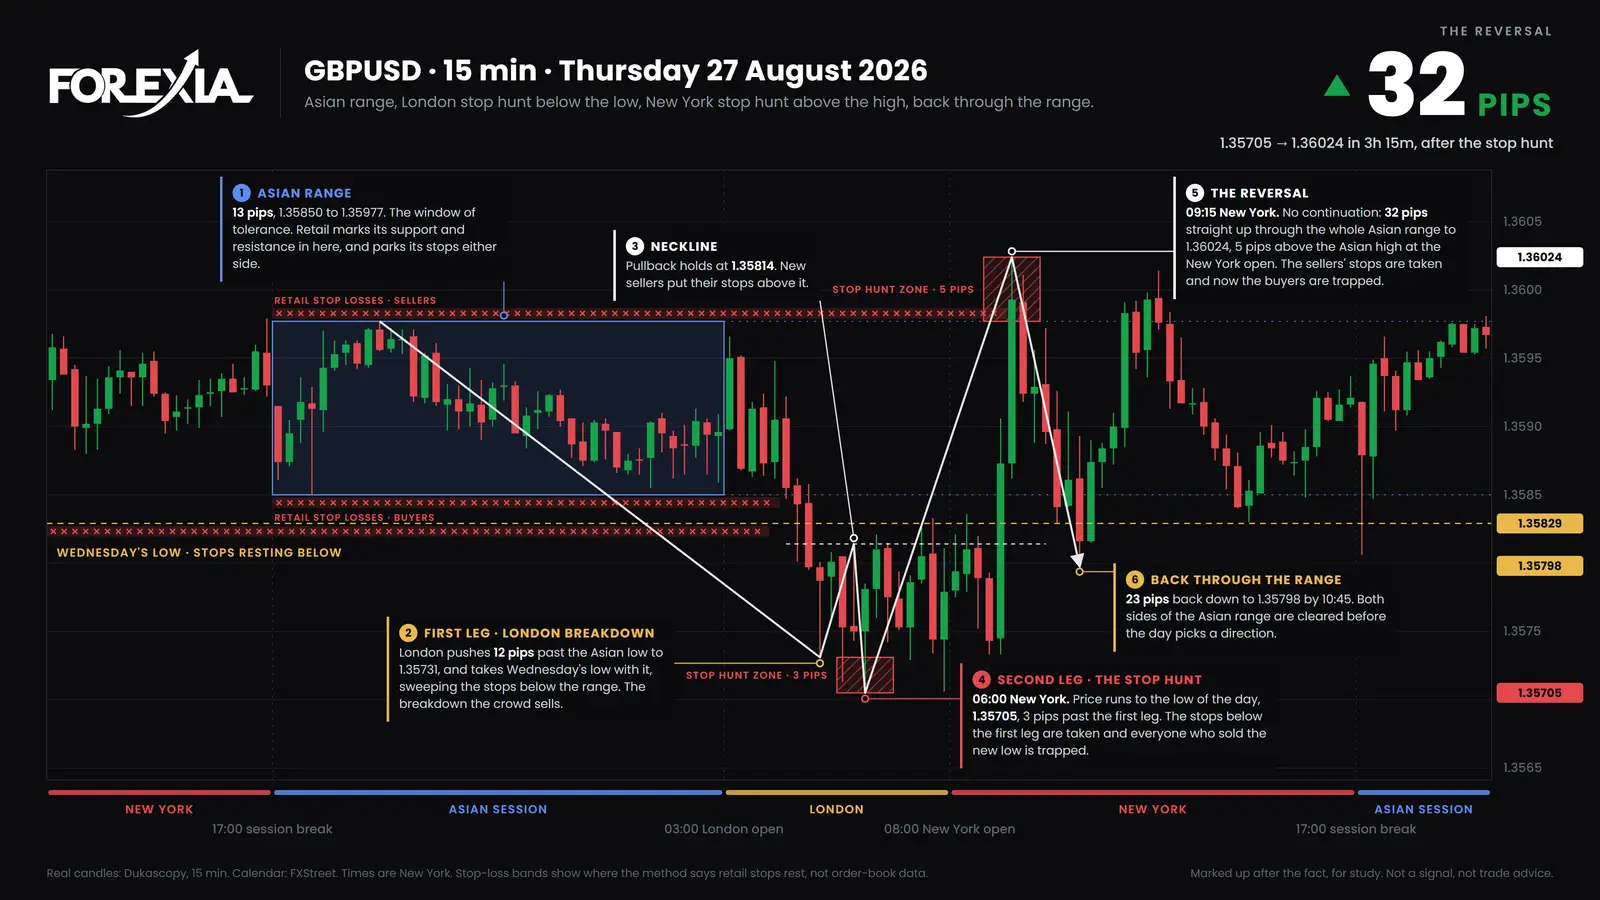
The first move out is not always false. Our guide to why the London breakout fails has the count and a dated break that held.
Is every Asian range a window of quiet?
No, and a night with a move in it is a different thing. GBP/USD on Tuesday 12 May 2026 fell for most of the night. Its box ran 65 pips, 1.35441 to 1.36094, more than twice the pair's median. The top was the first candle after the session break, and the bottom was the last candle before London. In the calendar for those hours we find one medium-impact item, a UK retail survey at 19:01, and nothing that explains it.
That box has two edges, and the bottom was one candle's low. Nobody had hours to come to trust it, and no one bought it three times. The 03:00 candle closed under it, and price reached 1.35001 at 11:15, 44 pips lower, with US inflation figures along the way.
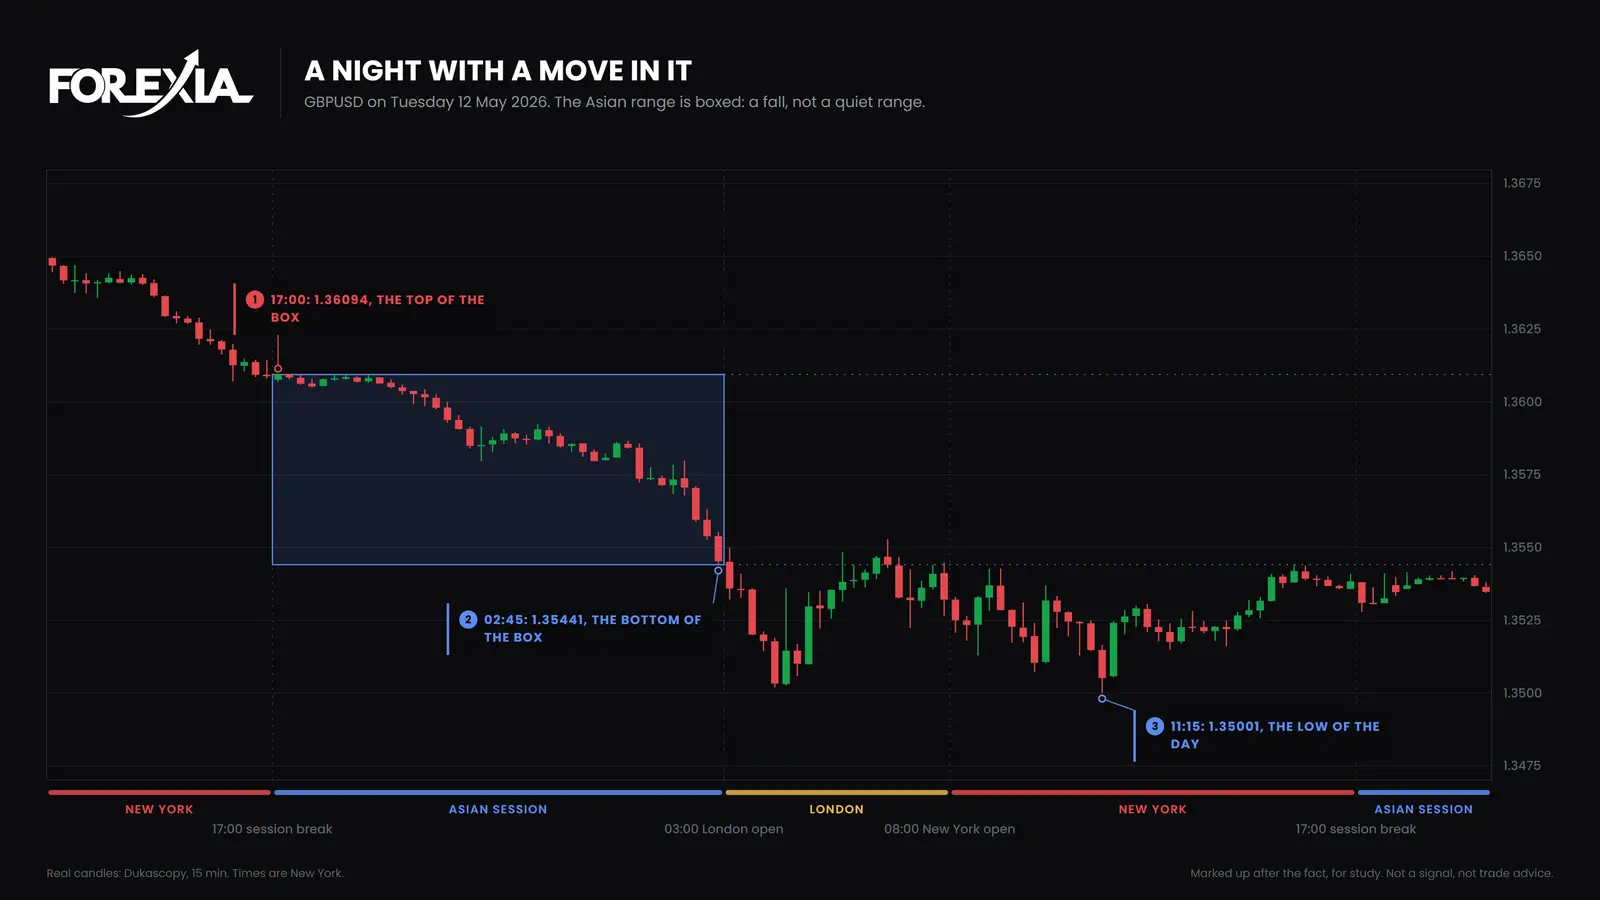
A box like that is still a pair of lines, and the Asian Box page shows how wide a normal one runs on each market. It just did not build what the quiet nights build.
Which pairs set the day in the Asian session?
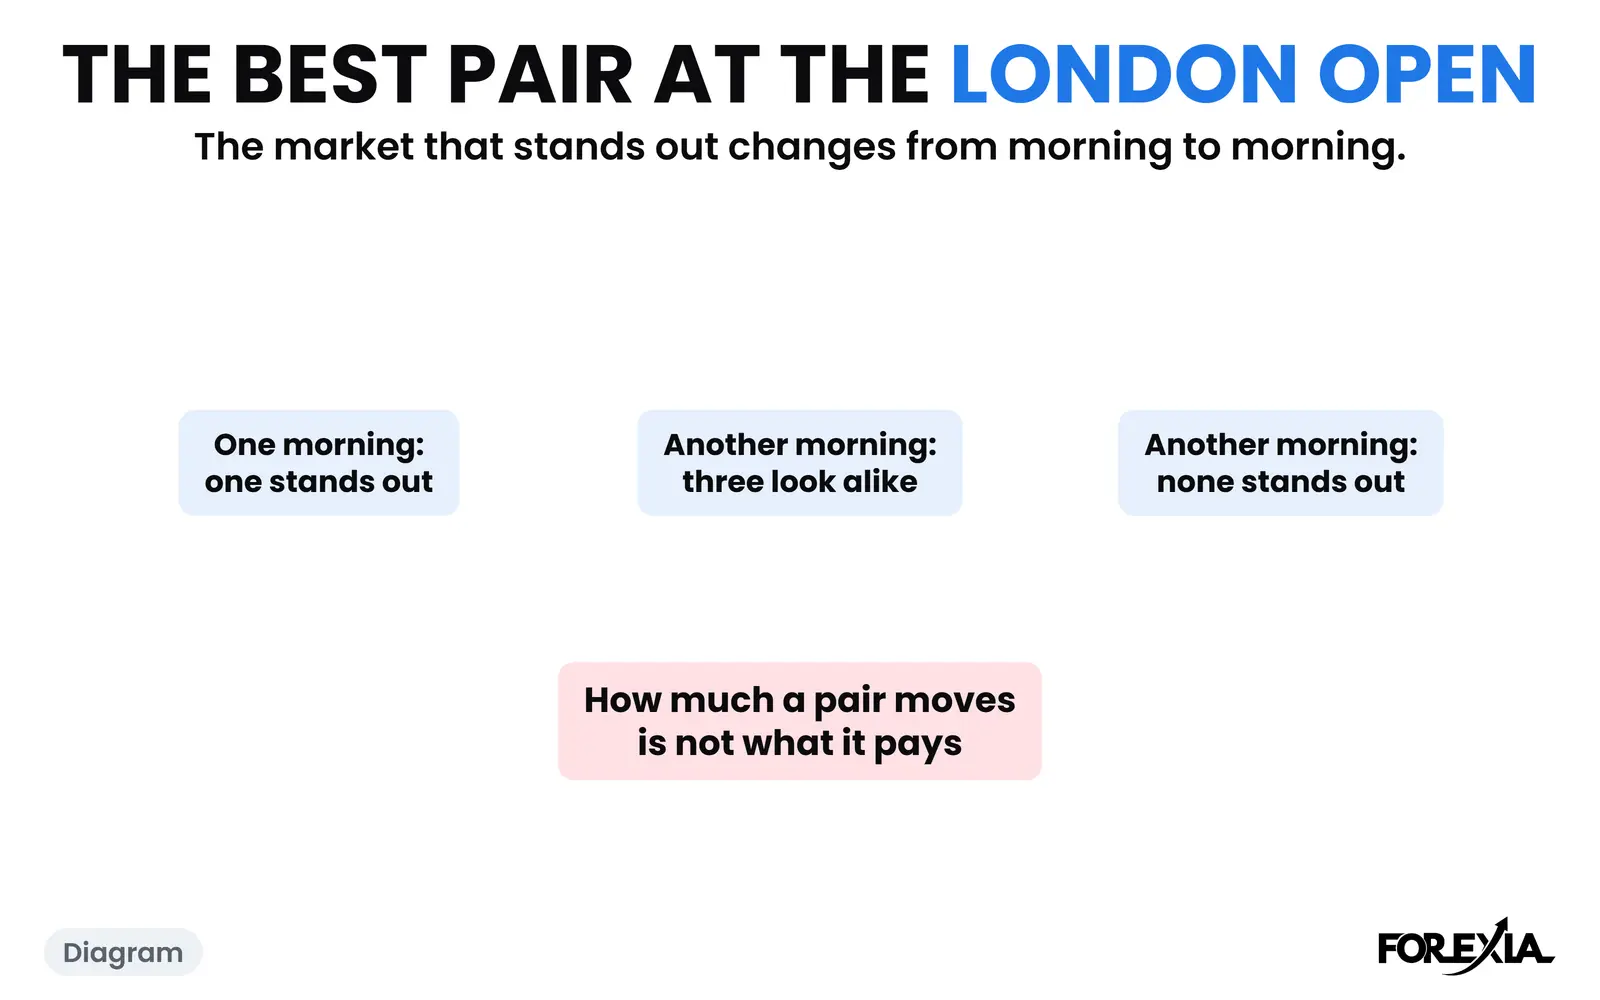
Some more than others, and this is the count most pages leave out. Over 129 market-days from 6 April to 1 October 2026 (127 on gold), we took each market-day's high and low and asked whether it printed in the ten hours from the session break to the London open. The rollover spike is taken off the first candle's low.
| Market | Asia's median range, share of the day's | Day's high set in Asia | Day's low set in Asia |
|---|---|---|---|
| EUR/USD | 46% | 44 | 44 |
| GBP/USD | 45% | 43 | 46 |
| USD/JPY | 62% | 44 | 68 |
| USD/CHF | 52% | 39 | 51 |
| AUD/USD | 60% | 44 | 63 |
| USD/CAD | 46% | 38 | 47 |
| NZD/USD | 63% | 60 | 60 |
| Gold | 59% | 59 | 54 |
So the guides that send you to USD/JPY, AUD/USD and NZD/USD at night have a point about movement. Across all eight, 804 of 2,060 highs and lows (39%) printed in Asia, which has 42% of the day's clock.
Read it with its limits. A high or low in Asia is known only once the day is over. It is one six-month sample, and USD/JPY's lopsided 68 and 44 may be nothing more than which way it trended that half-year. None of it is a figure for profit. Our own test of the setup as a mechanical rule did not make money.
Common mistakes
All three come from believing what the quiet seems to say.
- Believing the night's last touches. On 27 August the bottom turned price at 01:15 and at 02:45, and the 04:30 candle closed through it, 105 minutes after that last touch.
- Expecting much from 2.5-pip candles. That was the average on 12 August, and we have not tested a range strategy, so treat it as a reason to count before you try one.
- Reading twelve hours of waiting as a signal. On 12 August the first close out was 7 pips over the top, and by 15:00 price was 31 pips under that close. On other days it holds. The first close alone does not say which.
Course 2 of ForexiaPRO, The Chaos Pattern, teaches this read step by step in lesson 2.1.2, The Window of Tolerance: Ten Hours of Quiet. Our Asian session strategy guide takes the same night through London and New York.
Frequently asked questions
What is the Asian range in forex?
It is the high and low of the quiet hours before London. We draw it on the wicks, from the 17:00 New York session break to the London open, about ten hours. It is a trader's measurement, not an official market figure, and guides draw it over different windows.
Is the Asian range bullish or bearish?
Neither. It has no direction of its own. On GBP/USD on 12 August 2026 the first close out of a 10-pip range was over the top, and price ended the afternoon under the bottom. On 27 August the first close out was under the bottom, and the next high was over the top.
How often does the day's high or low come from the Asian range?
Fairly often. Of 2,060 highs and lows on seven majors and gold from 6 April to 1 October 2026, 804 printed in Asia. That is 39%, for ten of the day's 24 hours. NZD/USD set its day's high in Asia on 60 of 129 days, and USD/JPY its low on 68. It is known only afterwards.
Can I trade the Asian range itself?
You can try, and we have not tested it. The candles are small: GBP/USD's averaged 2.5 pips on 12 August 2026. We read those hours as where other people's orders build, and what they mean comes after London opens.