Best Forex Pairs to Trade During the London Session: What We Counted, and Three Real Mornings
Dylan Forexia8 min read
The best forex pairs to trade during the London session depend on what you mean by best, and no pair pays by itself. In movement, gold, GBP/USD and USD/JPY led our eight markets. EUR/USD and gold cost least against that movement. And on three real mornings the market that stood out changed each time, and most of that was plain only afterwards.
What are the best forex pairs to trade during the London session?
The guides answer with a list: EUR/USD, GBP/USD, USD/JPY, USD/CHF, and often EUR/GBP or GBP/JPY for extra movement. Their reason is sound as far as it goes. In the BIS's April 2025 survey UK desks handled the largest share of FX turnover, 38%, so spreads on the majors tend to be low while London is open. None we read gives a measured range per pair for those hours, so we counted.
Two samples sit behind this table. The first three columns cover 129 market-days from 6 April to 1 October 2026 (127 on gold), on 15-minute candles. "London alone" is the five hours from the London open to New York's open. The last two columns come from a longer study of 1,488 trading days, from 4 January 2021 to 1 October 2026.
| Market | London alone: median range, pips | Its share of the day's range | Day's highs and lows set in London alone | Typical spread, pips | Hunts that printed in London |
|---|---|---|---|---|---|
| EUR/USD | 24 | 48% | 37 of 258 | 0.30 | 44% |
| GBP/USD | 32 | 53% | 40 of 258 | 0.90 | 49% |
| USD/JPY | 31 | 43% | 42 of 258 | 0.60 | 45% |
| USD/CHF | 21 | 48% | 32 of 258 | 0.90 | 48% |
| AUD/USD | 20 | 41% | 36 of 258 | 1.00 | 37% |
| USD/CAD | 22 | 44% | 38 of 258 | 1.20 | 33% |
| NZD/USD | 18 | 43% | 27 of 258 | 1.10 | 39% |
| Gold | 33 | 38% | 22 of 254 | 0.39 | 33% |
On gold $1 counts as 1 pip. A hunt here has one strict meaning: the day's high or low prints in London or New York beyond the Asian range, then price reverses at least 0.4 of the average day, back inside the range. That is known only once the day is over.
What do those numbers say, and what do they not?
They say how pairs behave, not what they pay. Three readings hold up.
GBP/USD is London's pair by share. It moved 32 pips at the median and did 53% of a day's range in those hours, the most of the eight. It also printed the largest share of its hunts in London, 49%.
Cost changes the ranking. A spread comes off before anything else. EUR/USD's 0.30 is about 1% of its median London range, and gold's $0.39 about 1%. GBP/USD's 0.90 is about 3%, and NZD/USD's 1.10 about 6%.
New York takes most hunts on every market. Even on GBP/USD, 51% printed in New York. USD/CAD and gold printed two thirds of theirs there, and no market set more than 42 of its 258 highs and lows in those five hours alone. If you want gold for movement, its median range in the four-hour overlap with New York was 50 pips against London's 33, and our gold hub goes further.
The limits matter as much as the table:
- Range is not profit. Run as a fixed rule, our own test of the setup lost money in London and in New York alike. Nothing in this table suggests any pair pays.
- Two samples, two periods. The first is one six-month stretch. The spreads and hunts cover nearly six years, in which gold's daily range changed a great deal, so comparing across columns is rough.
- Spreads are one data feed's. They are the median in that study, and your broker's will differ.
- Crosses are missing. We hold no count on GBP/JPY or EUR/GBP, so we cannot tell you whether the guides are right to name them.
- The rollover spike is taken off the first candle's low in the first three columns, all of which fall in one setting of the clocks. Our forex market hours page covers the rest.
What did the pairs look like on three real mornings?
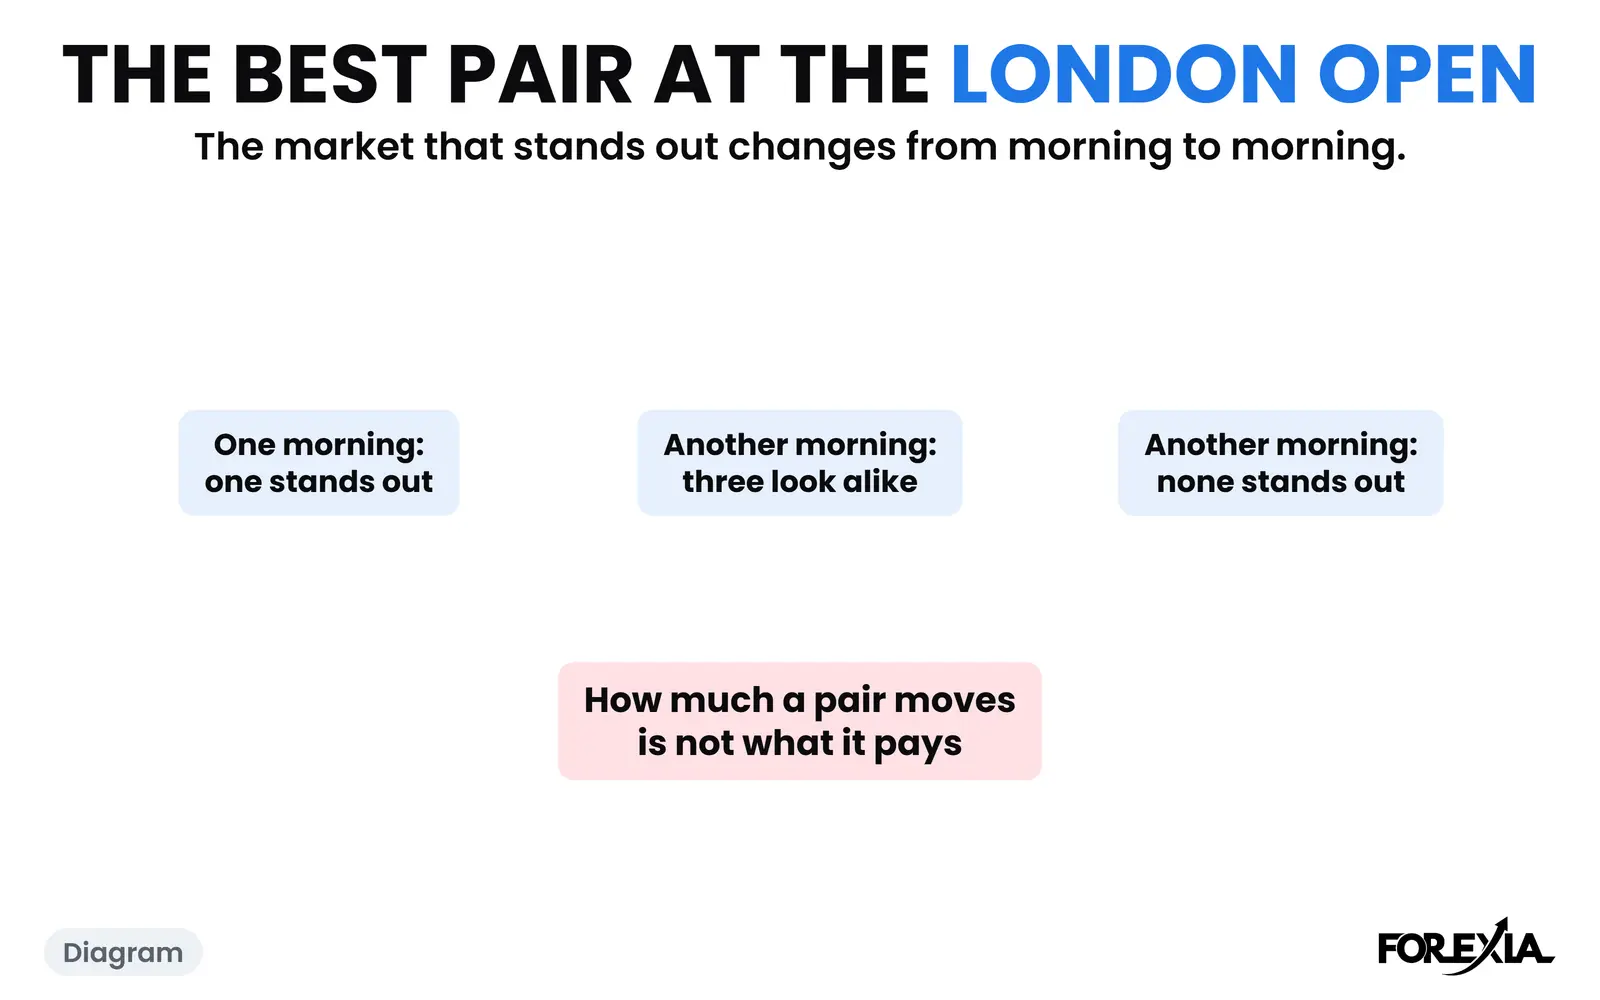
Different each time, and that is why a fixed list falls short. Here is every market's Asian Box in pips on three London mornings, with the rollover spike taken off the first candle's low.
| Market | Thu 30 July | Tue 25 August | Thu 1 October |
|---|---|---|---|
| EUR/USD | 32 | 20 | 30 |
| GBP/USD | 42 | 19 | 28 |
| USD/JPY | 44 | 39 | 107 |
| USD/CHF | 31 | 22 | 37 |
| AUD/USD | 20 | 17 | 16 |
| USD/CAD | 29 | 31 | 31 |
| NZD/USD | 26 | 16 | 27 |
| Gold | 71 | 80 | 54 |
The Three Seats read that table differently. Retail sees room: a big box looks like more pips. The market maker, as we read it, cares where the orders rest, and marking those places before the session is Liquidity Mapping. The observer reads what each market did overnight and what it did next. How we go about that stays in the course, and it is a judgement that will sometimes be wrong. Here is what the mornings looked like.
Thursday 30 July 2026: a $71 box on gold, a fall on USD/CAD
Gold had the biggest box by far, $71 against its median of $54. GBP/USD slid 25 pips through the night, and USD/JPY and USD/CHF each climbed about 26.
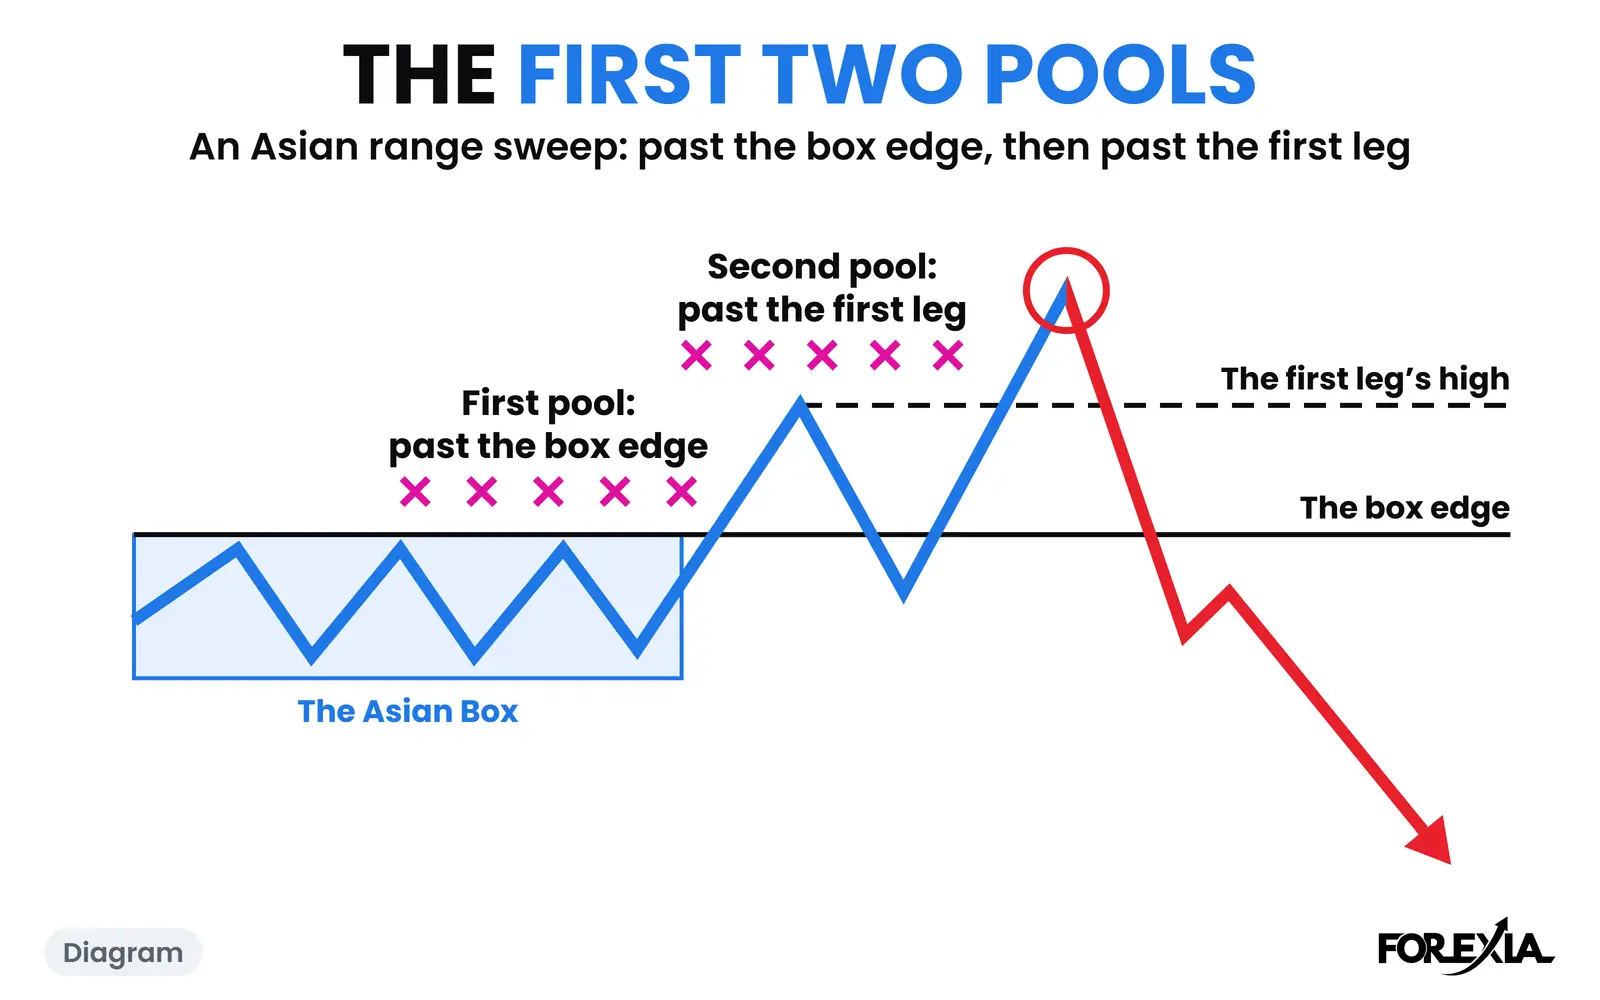
USD/CAD spent the night inside 29 pips, 1.40305 to 1.40590, with Wednesday's low of 1.40228 just 8 pips under it. London's fourth candle ran 8 pips the other way, over the top, to 1.40674. Then the day fell through the box and through Wednesday's low, to 1.39903 by 14:15, 77 pips off the high. Why the London breakout fails follows that day from the crowd's seat.
Tuesday 25 August 2026: three like nights, two kinds of day
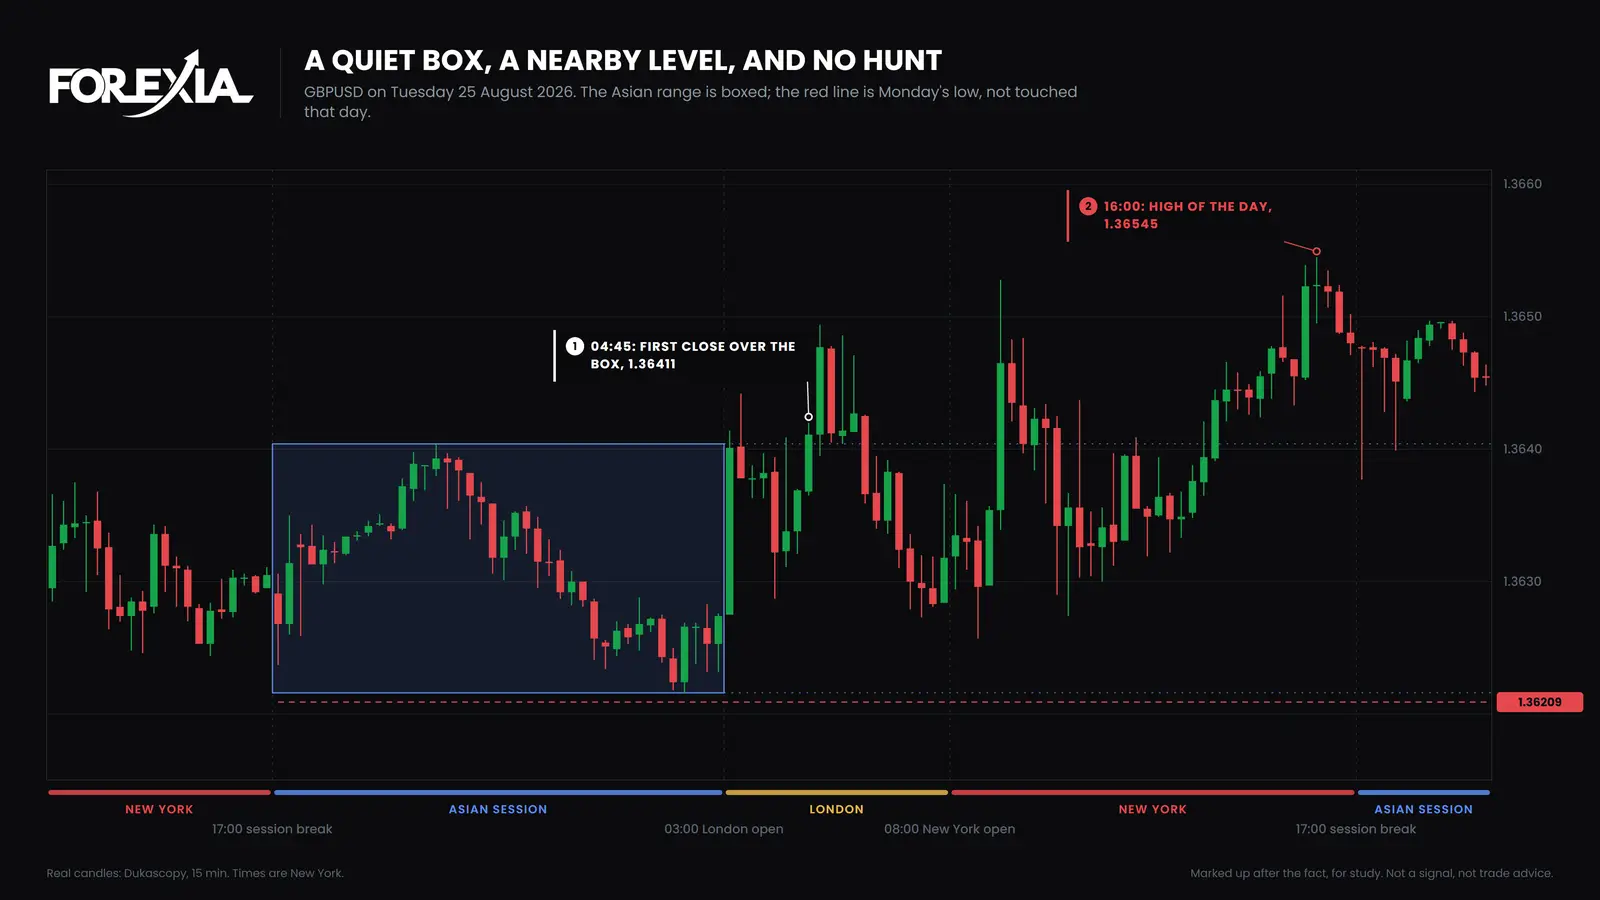
Three nights looked much alike: GBP/USD at 19 pips, AUD/USD at 17 and NZD/USD at 16, each a range, and each with Monday's low within about 2 pips of the bottom of its box. Nothing on the chart separated them before London. Australia's central bank minutes came out in AUD/USD's night and made neither edge.
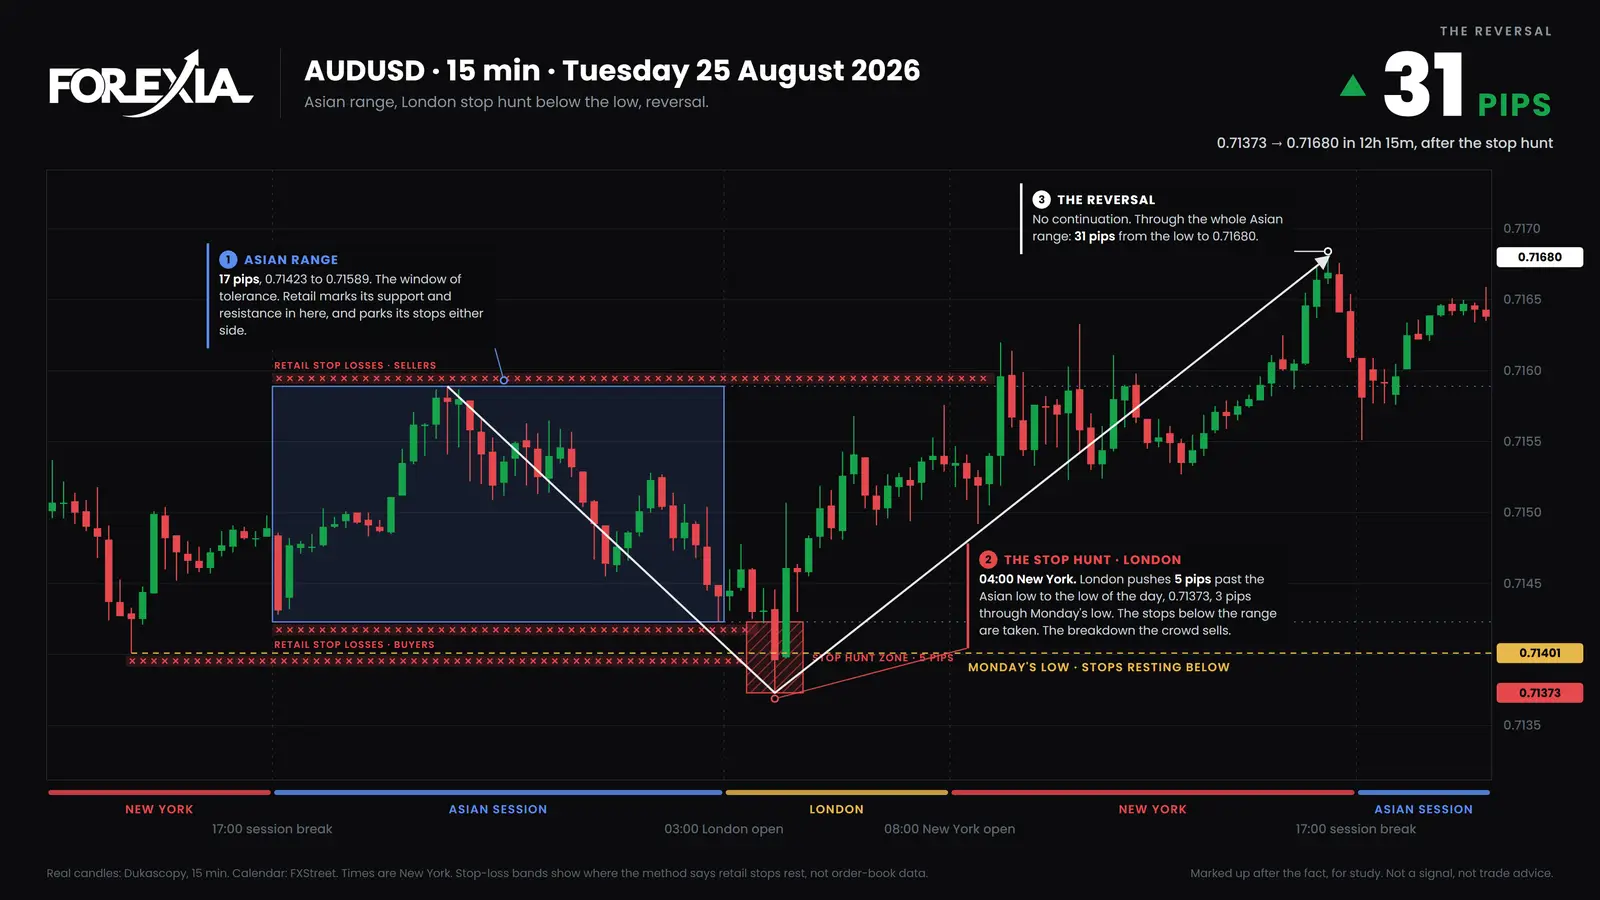
Then they parted. AUD/USD's 04:00 candle reached 0.71373, 5 pips under its box and 3 past Monday's low, and the next candle closed back inside at 0.71461. By 16:15 it was at 0.71680, 31 pips off the low. NZD/USD did the same on the same candle, to 0.59459, and rose 36 pips by 16:00. No medium or high-impact release lined up with either low.
GBP/USD did neither. It never traded under its box after London opened, and Monday's low of 1.36209 stayed untouched. The 04:45 candle was its first close over the box, at 1.36411. The 05:00 candle reached 1.36494, 9 pips over, and the day's high was 1.36545 at 16:00. There was no hunt and no turn.
Seen afterwards, AUD/USD looks like the obvious choice. Before London, it did not.
Thursday 1 October 2026: a 107-pip box, and a break that stayed
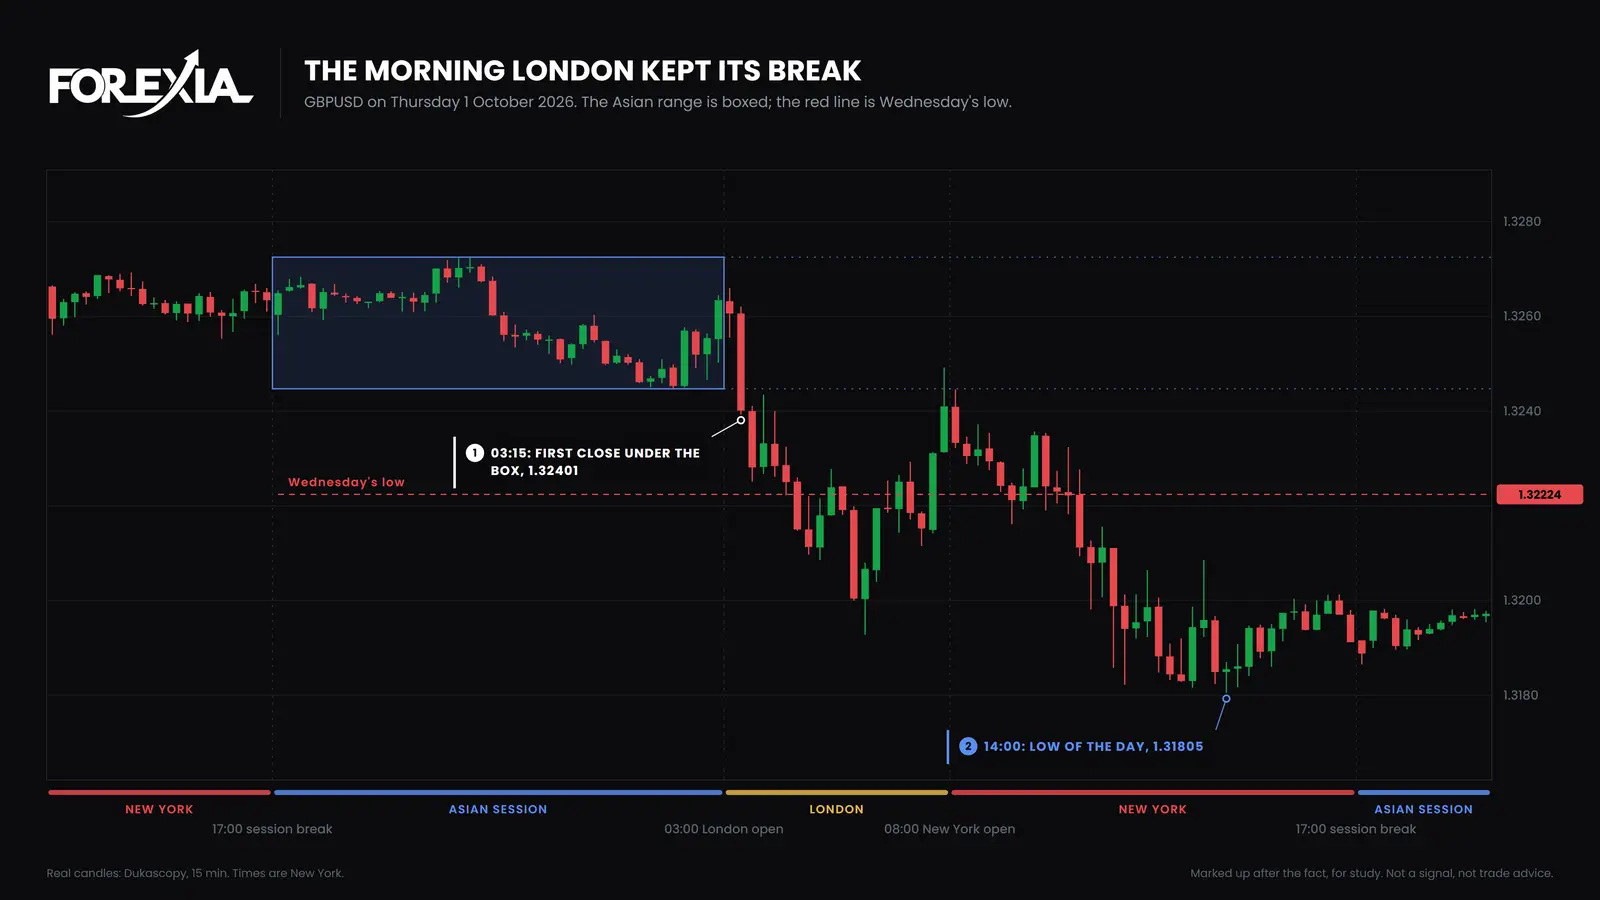
Nothing stood out to us before London. USD/JPY's box was 107 pips, a climb of 76 pips and more than twice its median. GBP/USD's was 28 pips, with Wednesday's low 22 pips under it.
London broke the pound and kept the break. The 03:15 candle closed under the box at 1.32401, the 04:15 candle traded through Wednesday's low of 1.32224, and every close from the break to 17:00 stayed under the box. By 14:00 price was at 1.31805, 64 pips under the box and 42 under Wednesday's low.
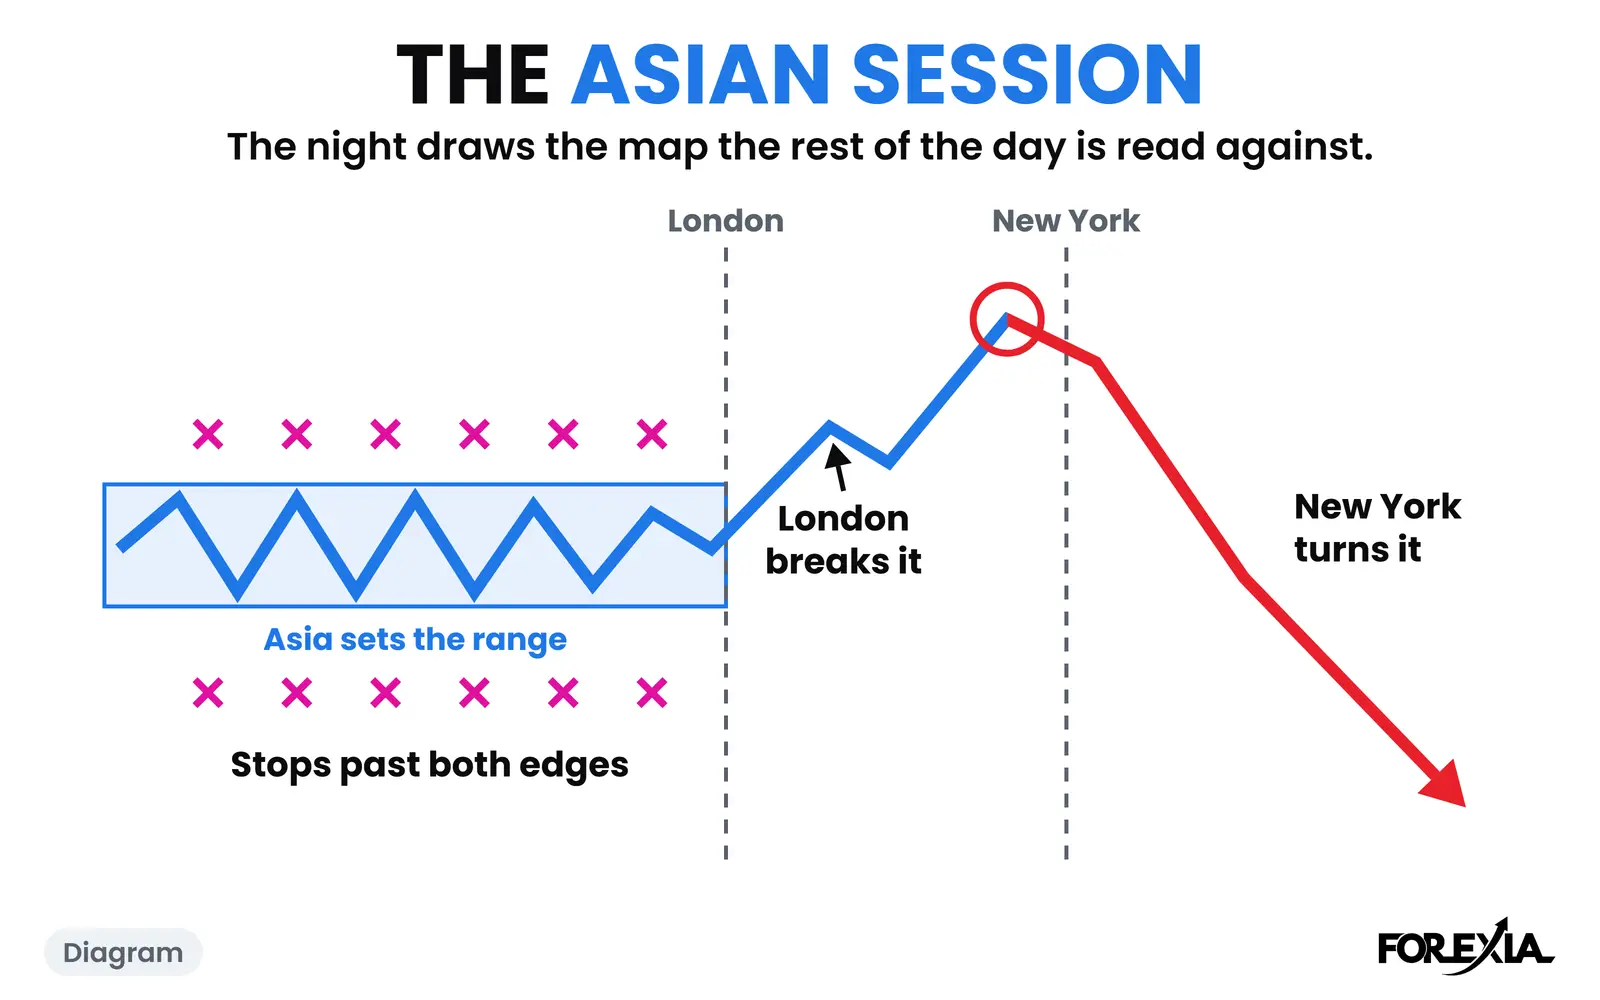
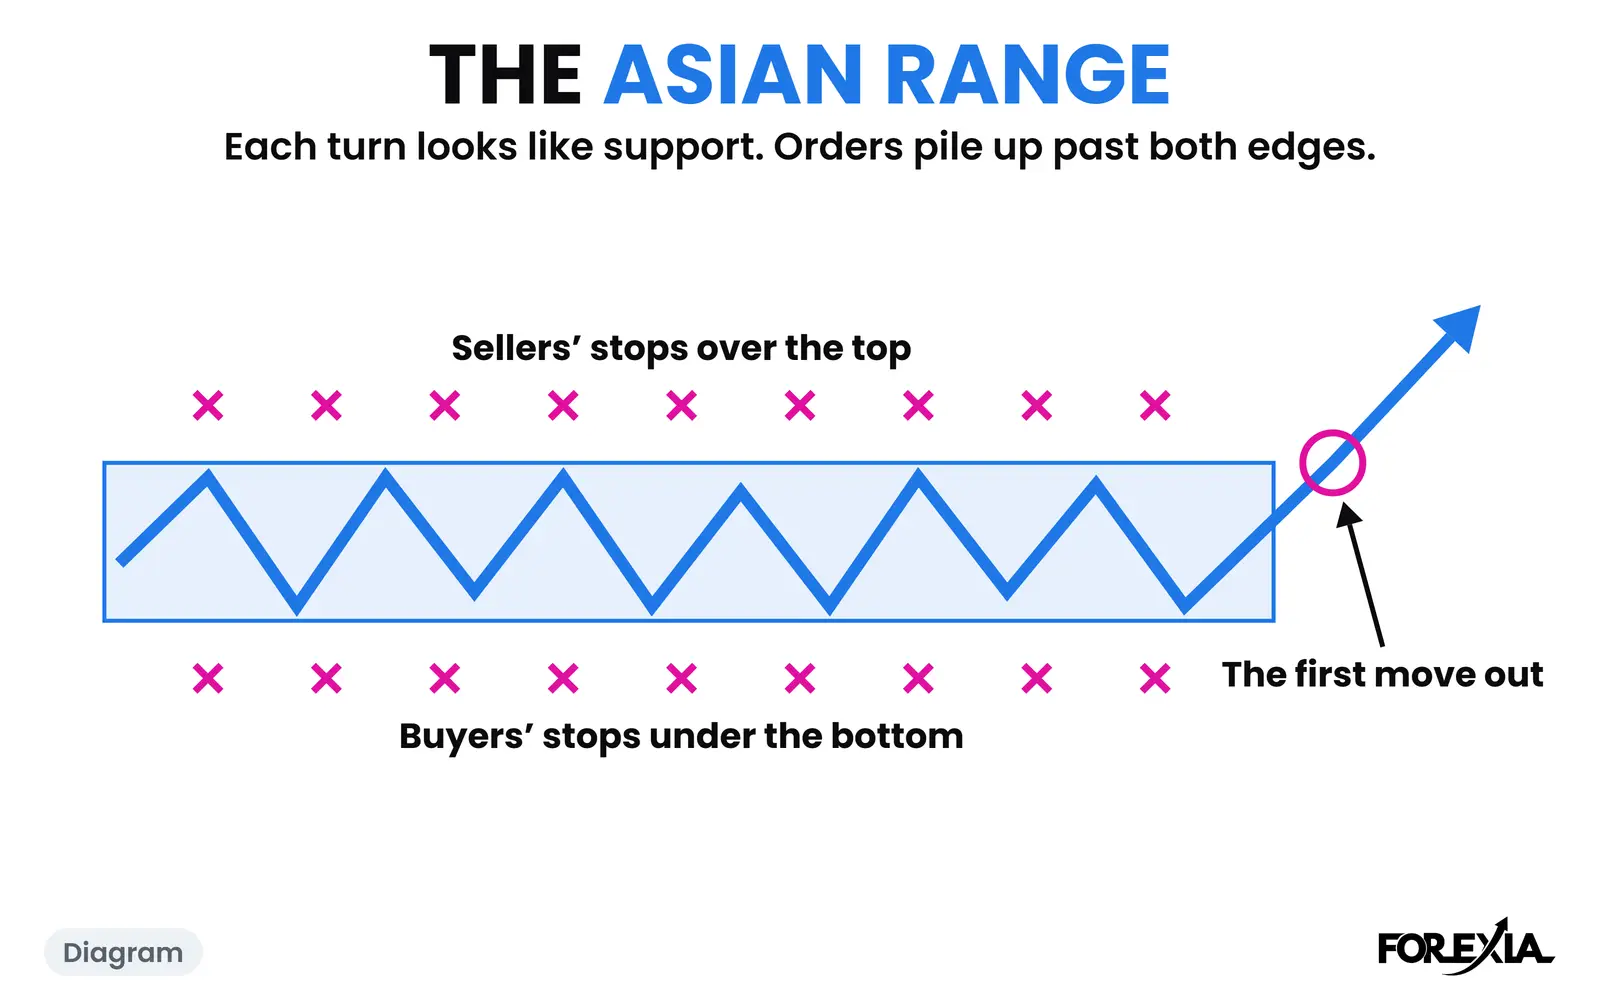
USD/CAD ran an M off its high that day and fell 43 pips, and nothing in the table above points there. Our guide to the Asian range shows what a quiet night builds in the first place.
Common mistakes
All three treat a pair as an answer.
- Reading a big box as room left. On 1 October USD/JPY had already climbed 76 pips before London opened, inside a 107-pip box. A big box can be a day already spent.
- Reading afterwards as if it were before. On 25 August AUD/USD gave a clean hunt and GBP/USD nothing. Nothing on the chart at London's open said which would do what.
- Taking range for profit. GBP/USD moves more than NZD/USD in those hours. That says nothing about what a strategy on either one earns.
Course 2 of ForexiaPRO, The Chaos Pattern, teaches this read step by step in lesson 2.2.3, Which Market Today.
Frequently asked questions
Which pair moves most in the London session?
In pips, gold, GBP/USD and USD/JPY. Their median range in the five hours from the London open to New York's open was 33, 32 and 31 pips, counting gold's $1 as 1 pip, from 6 April to 1 October 2026. EUR/USD ran 24 and NZD/USD 18. Movement is not profit.
Is GBP/USD the best pair for the London session?
It moved most for a major and did the largest share of its day in those hours, 53% at the median. It also cost more to trade than EUR/USD in our spread figures: 0.9 pips against 0.3. We do not call any pair best, and our own fixed test lost money in London and in New York alike.
What about GBP/JPY and EUR/GBP in the London session?
Many guides name them. We hold no count on them, because our data covers seven majors and gold, so we cannot say whether they deserve it. Guides also note that crosses usually carry wider spreads.
Should I trade the same pair every London morning?
That depends on your plan, and the charts show why a fixed answer is hard. On 25 August 2026 three pairs had near-identical quiet nights, and AUD/USD and NZD/USD ran under the box and turned while GBP/USD did neither.