NY Session Reversal: When New York Undoes the London Move, and Why
Dylan Forexia9 min read
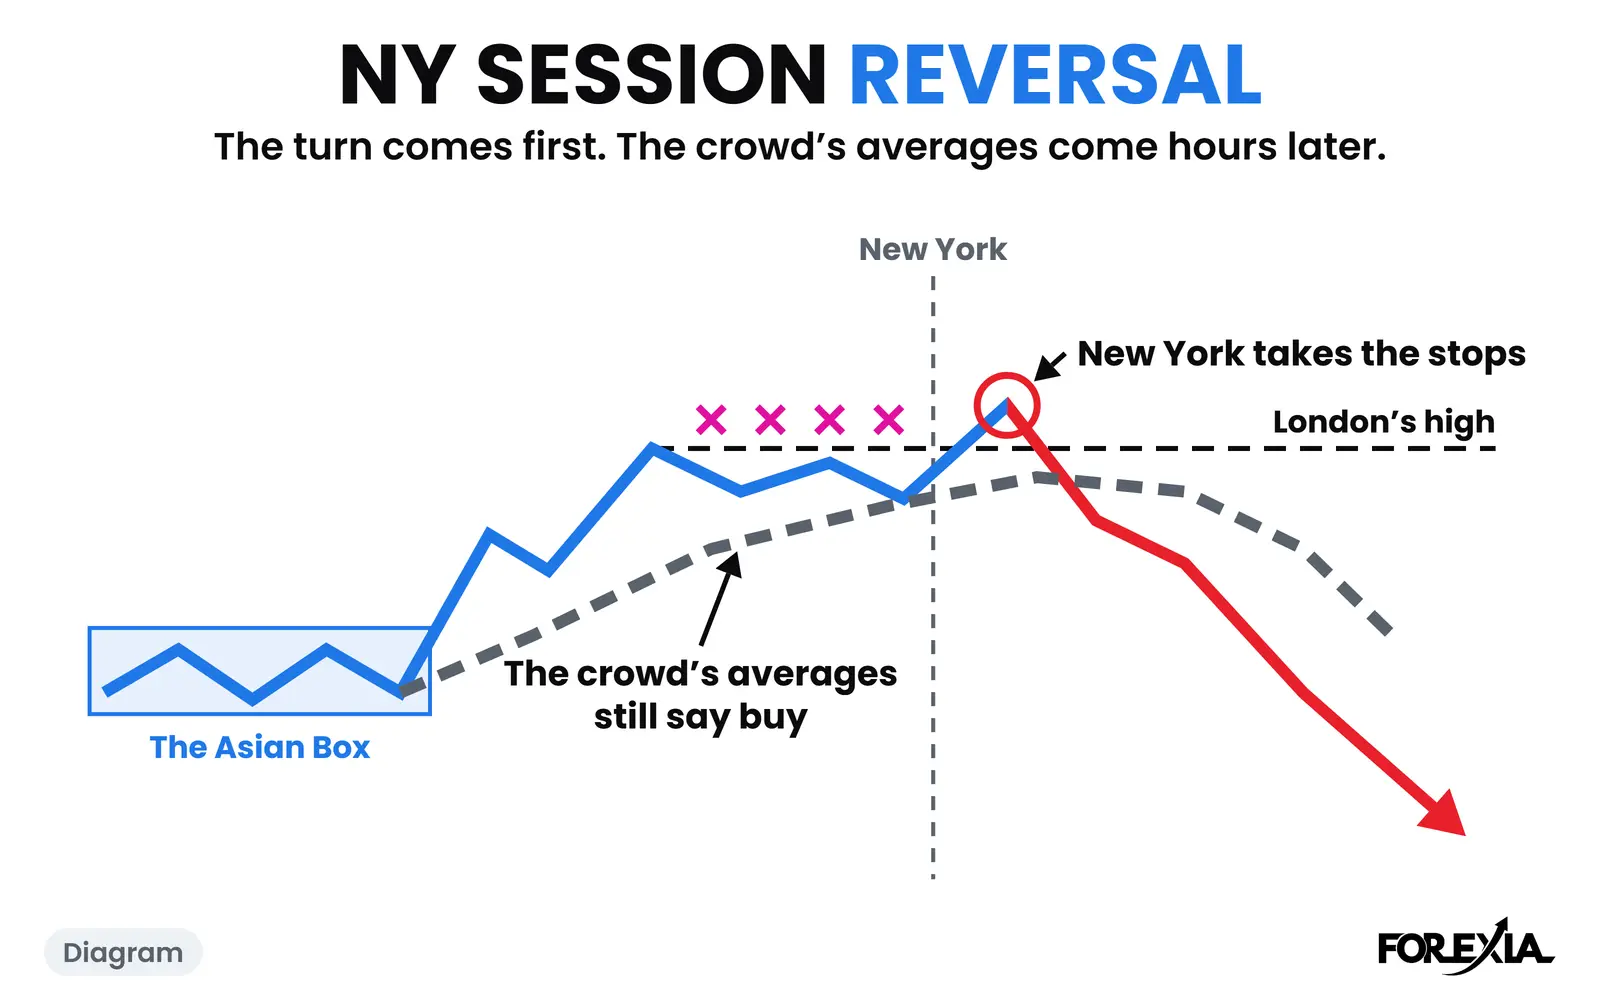
A NY session reversal is New York running past the extreme London left, then closing back inside the Asian range. We read it as the stops beyond London's high or low being filled by someone trading the other way. It comes early in the session when it comes, and it is less common than the name suggests.
The word we use for it is the New York Reversal, and that page has the definition and how often it happens: about one day in five when London's break is still standing. For London vs New York session as a whole, see the hub. This page takes what is left: when it comes, why, what the crowd's screen said, and what it looks like when it stops short. All times are New York, and a candle is named by when it opens.
Why does New York undo the London move?
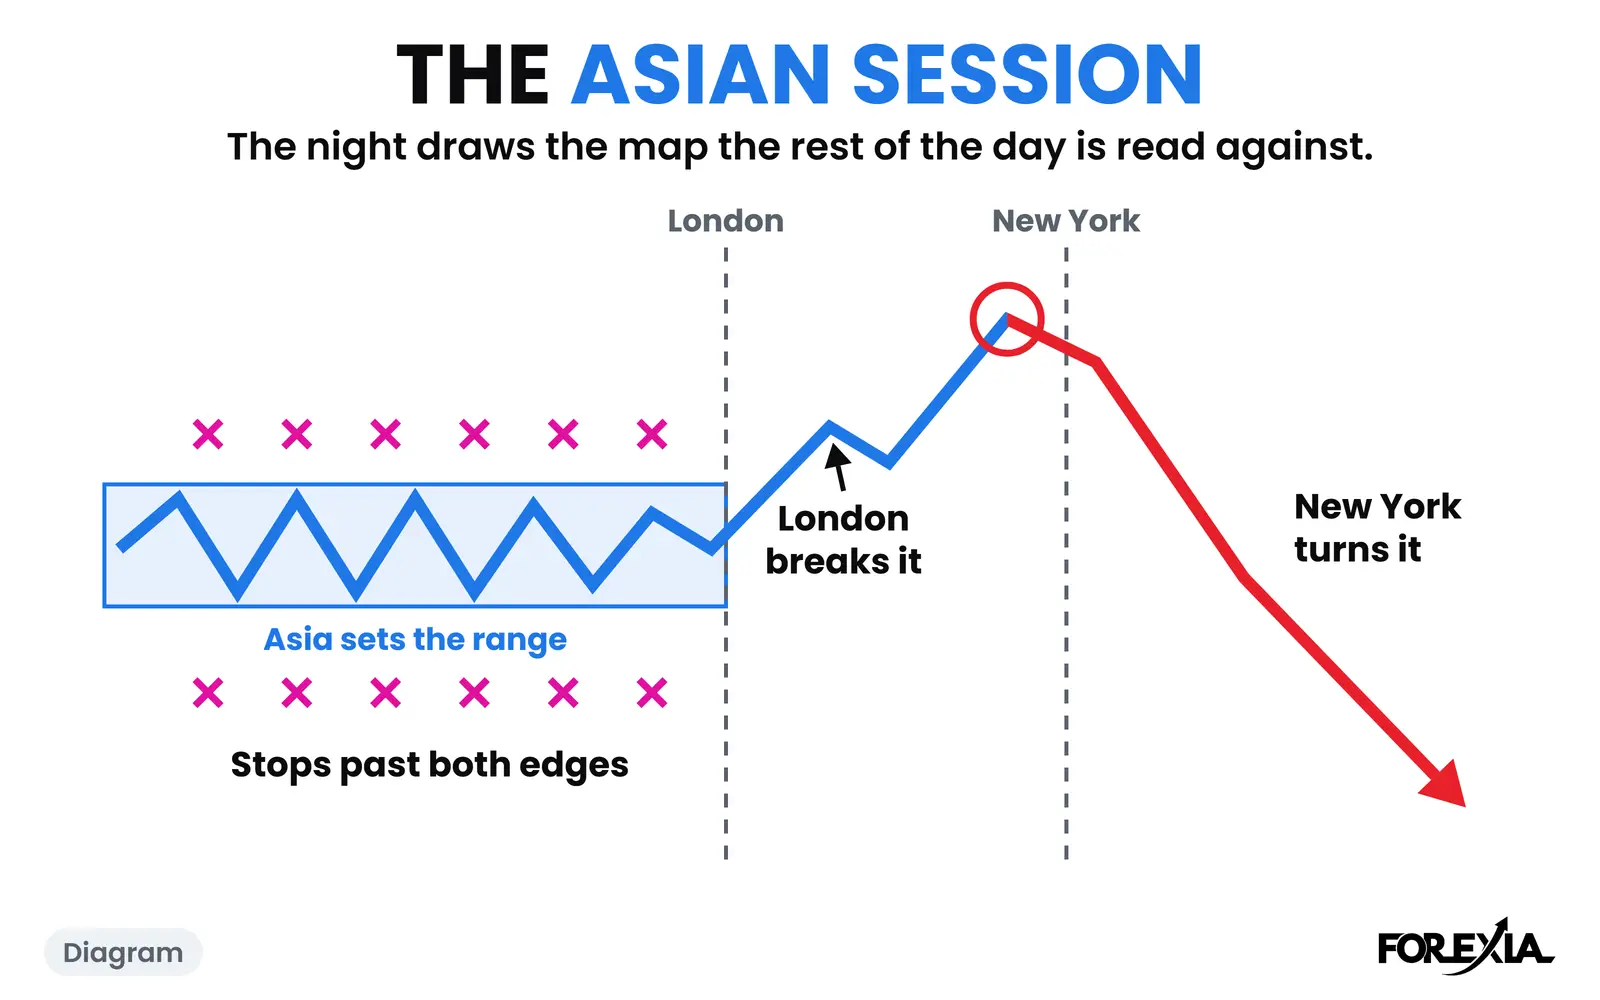
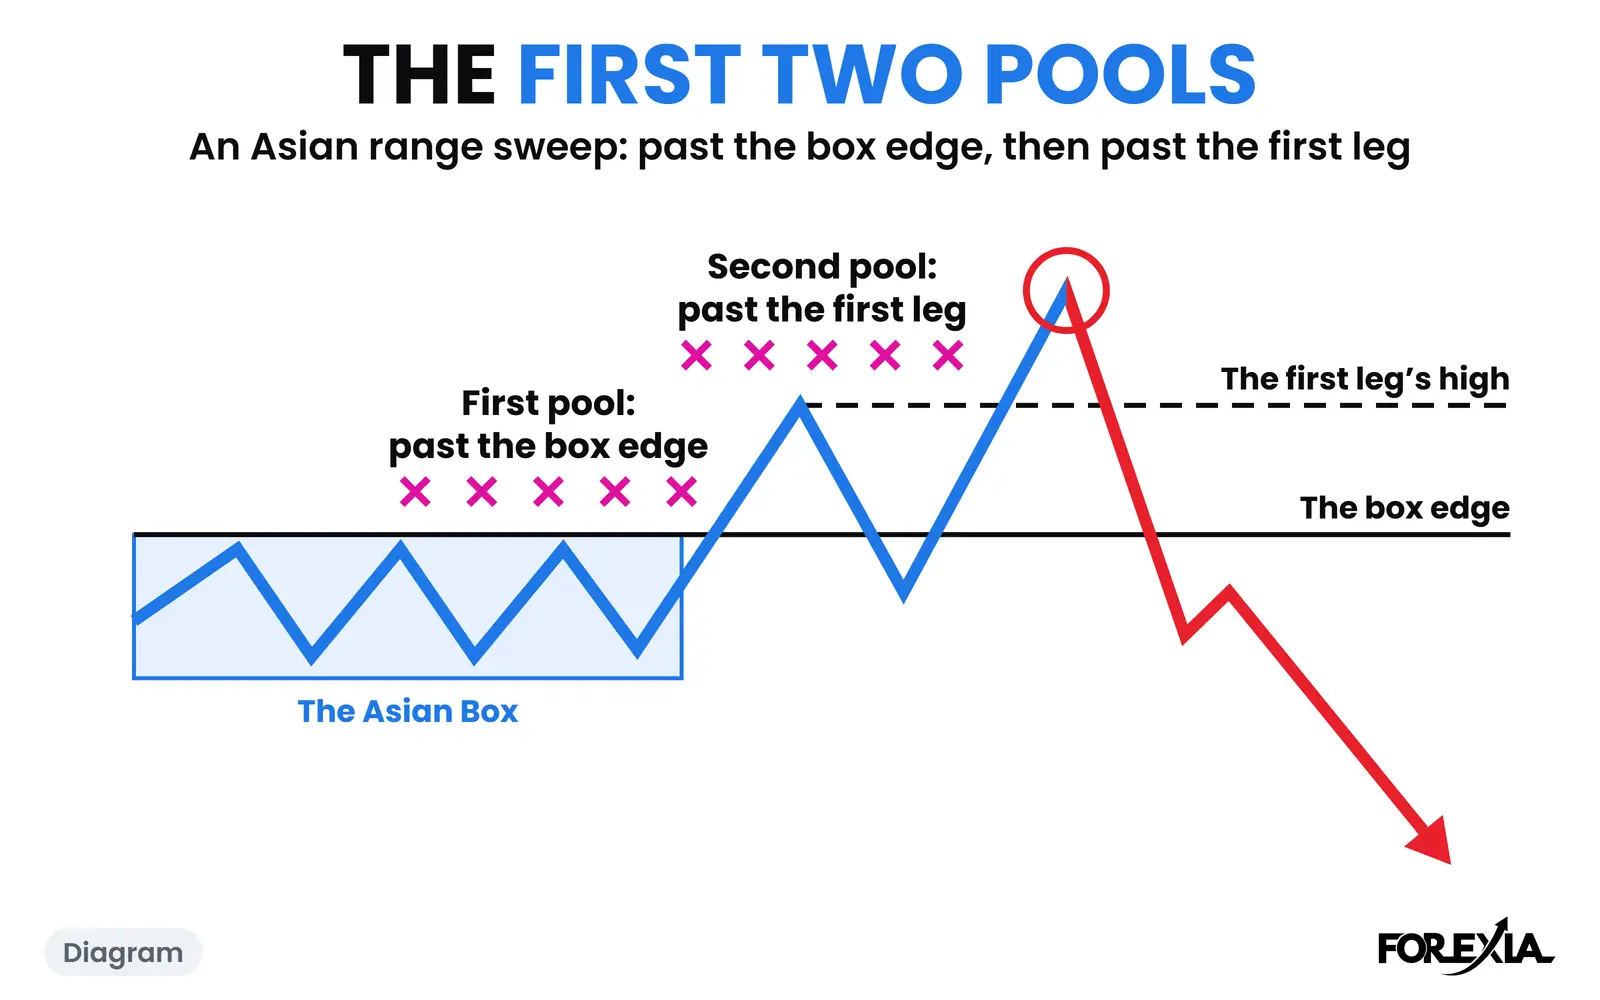
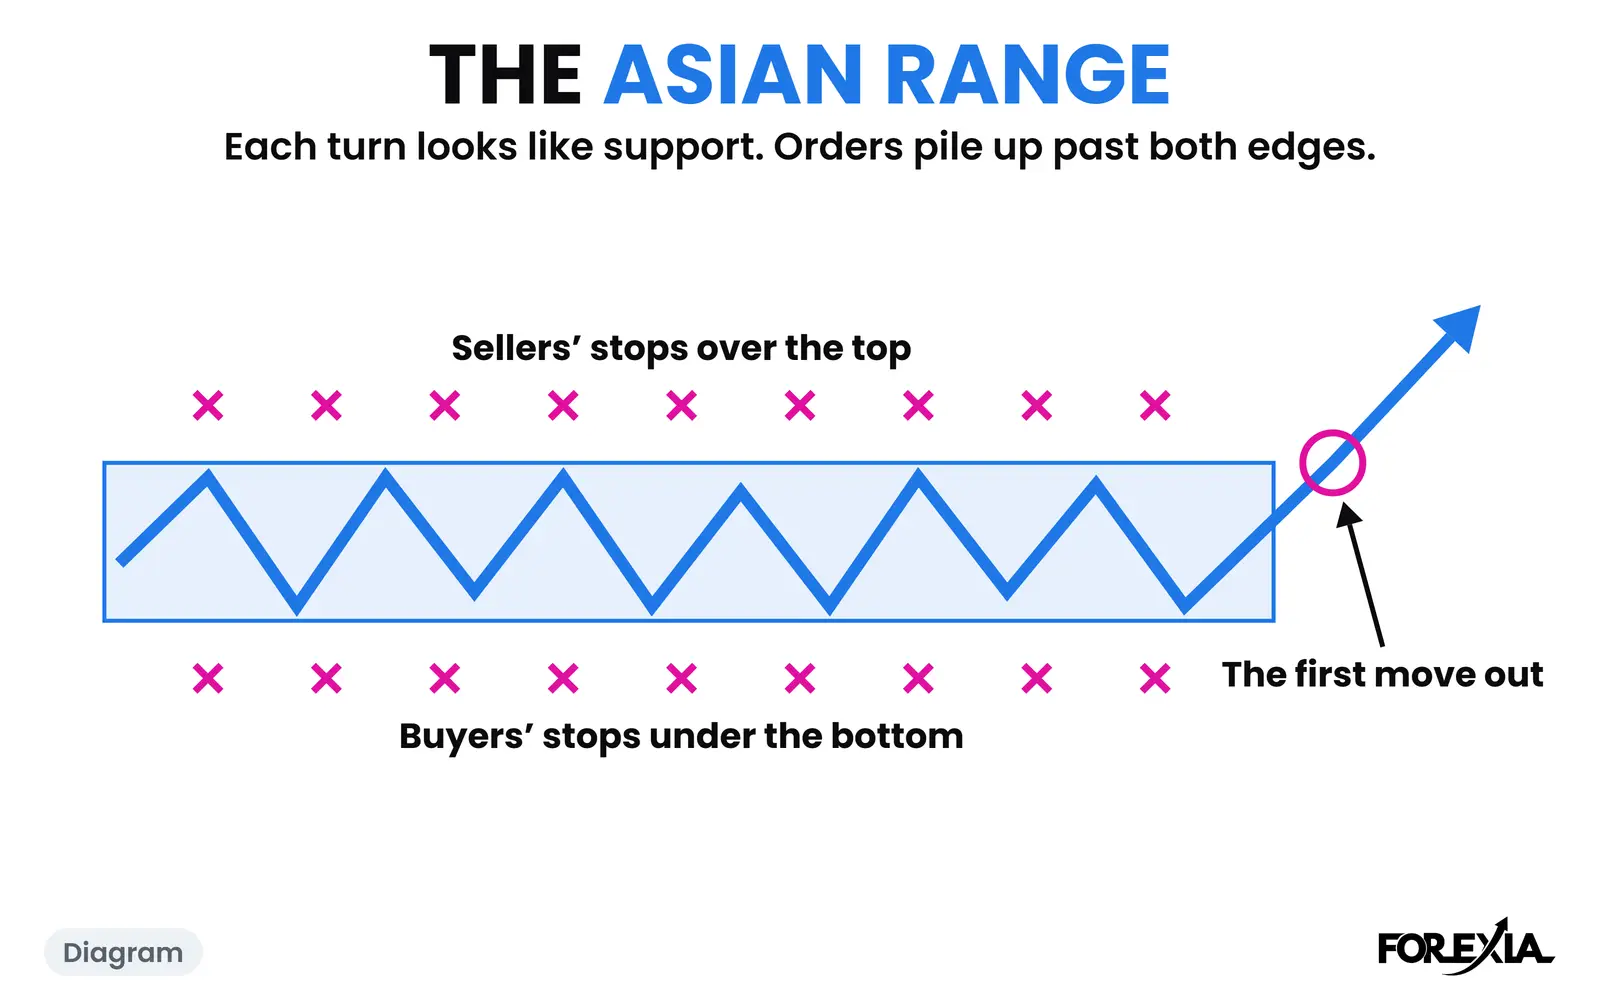
Our read is that London's hours build the orders. The London Breakout brings the crowd in, and over the next five hours its trades and the stops against them collect around the extreme London left. New York arrives with a full map. Running past that extreme is the stop hunt, what most traders call a liquidity sweep, and anyone with size to place can fill it against those stops.
That is a reading. Nobody outside a broker's book can see those orders, and other stories fit the same candles: London's desks taking profit, or US traders simply disagreeing with London. None of the pages we read gives evidence for any of them, and neither can we.
The phrase "New York reverses London" needs care as well. In the longer test behind our mechanical backtest, from February 2021 to December 2024, New York moved against London's direction on 50% of 8,124 pair-days, which is a coin flip. So a turn in New York is not in itself a finding. What can be studied is the narrower order of events, and its timing.
When does a NY session reversal happen?
Early, and mostly without a release. We took the 91 days in our count when London's break stood at New York's open, New York went past London's extreme by at least 3% of the average day, and a candle then closed back inside the Asian Box. That covers seven majors and gold, on 15-minute candles, from 6 April to 1 October 2026.
- The run past London's extreme began a median half an hour after 08:00, and before 10:00 on 85 of the 91.
- The close back inside the box came a median three hours after 08:00, and before 12:00 on 56 of the 91.
- A high-impact US release fell inside the candle of the run on 10 of the 91, and inside the close back candle on 3.
So on most of these days the first hours of New York did the hunting with no high-impact US release in that candle. This counts candles and not trades, and it only looks at days that did turn. Plenty of days run past London's extreme and never come back, as the glossary's count shows.
An M off the high: what the crowd's screen said on NZD/USD
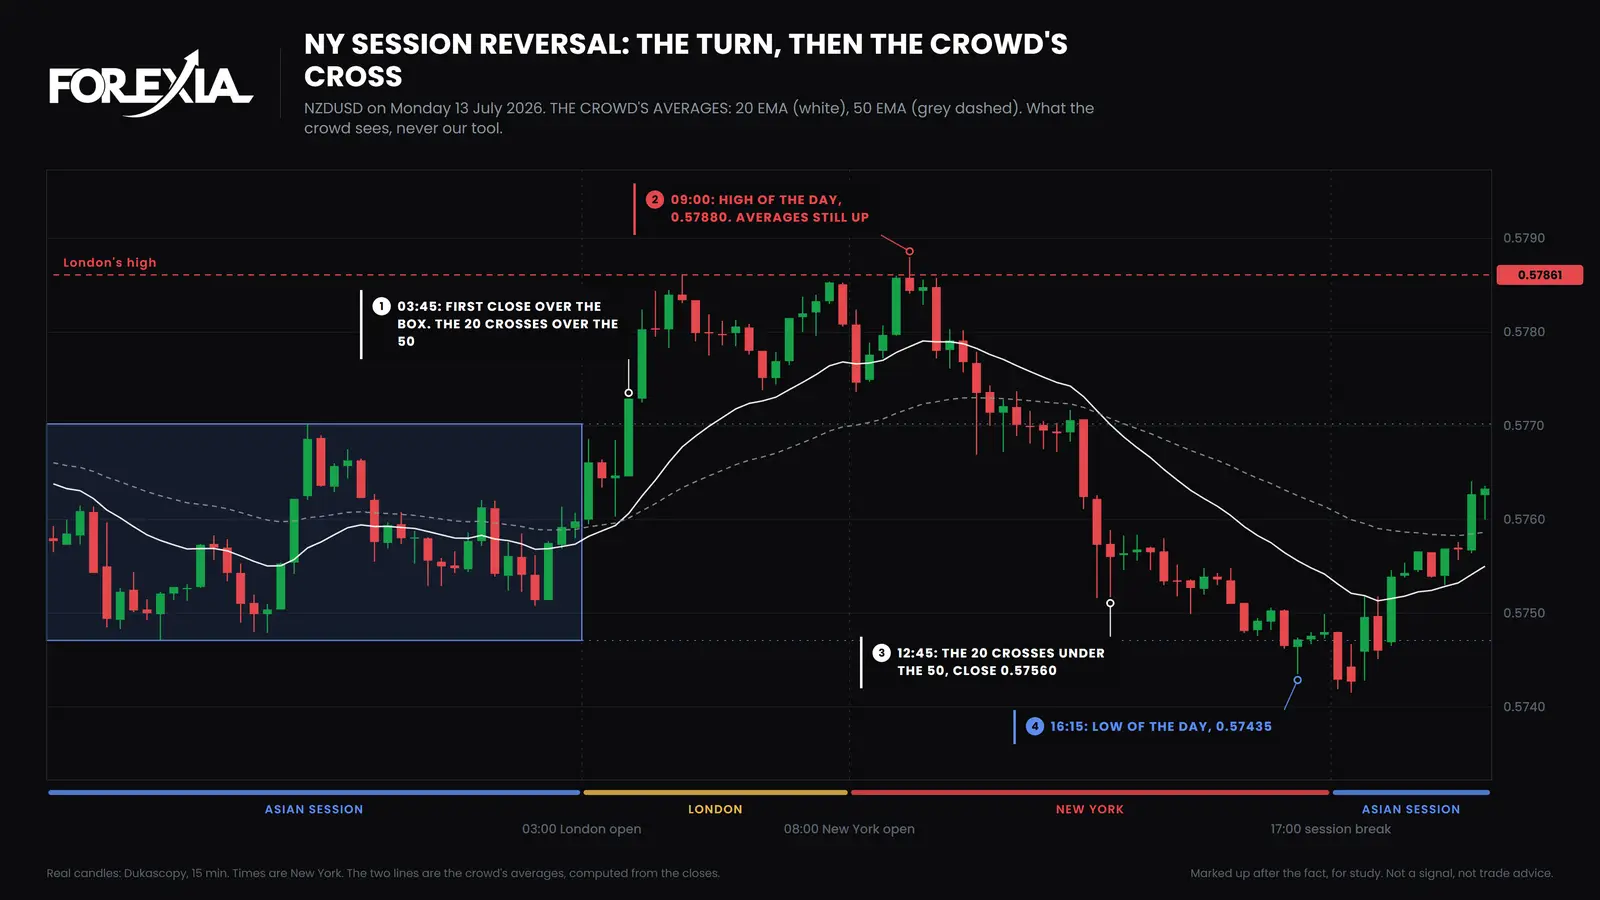
NZD/USD on Monday 13 July 2026 is the plain case, and nothing medium or high-impact was on the calendar within three hours of the turn. Our glossary walks through its prices. Here is the same day from the screen of someone watching the 20 and 50 EMA, the crowd's tool and never ours.
The box ran 0.57471 to 0.57702, and the 03:45 candle closed over it at 0.57729. On that same candle the 20 crossed over the 50, so the break and the "confirmation" arrived together. London's high was 0.57861 at 04:45, and for five hours the averages said buy.
At 09:00 price reached 0.57880, 2 pips past London's high and the top of the day. The averages still said buy, and went on saying it through the 11:00 candle, which closed back inside the box at 0.57701. They crossed down on the 12:45 candle, with a close of 0.57560, 32 pips under the high and nearly four hours after it. The low came at 16:15, at 0.57435, 44 pips off the high. That second top over the first is the M of M & W Reversals.
A W off the low: EUR/USD, 20 minutes before the release
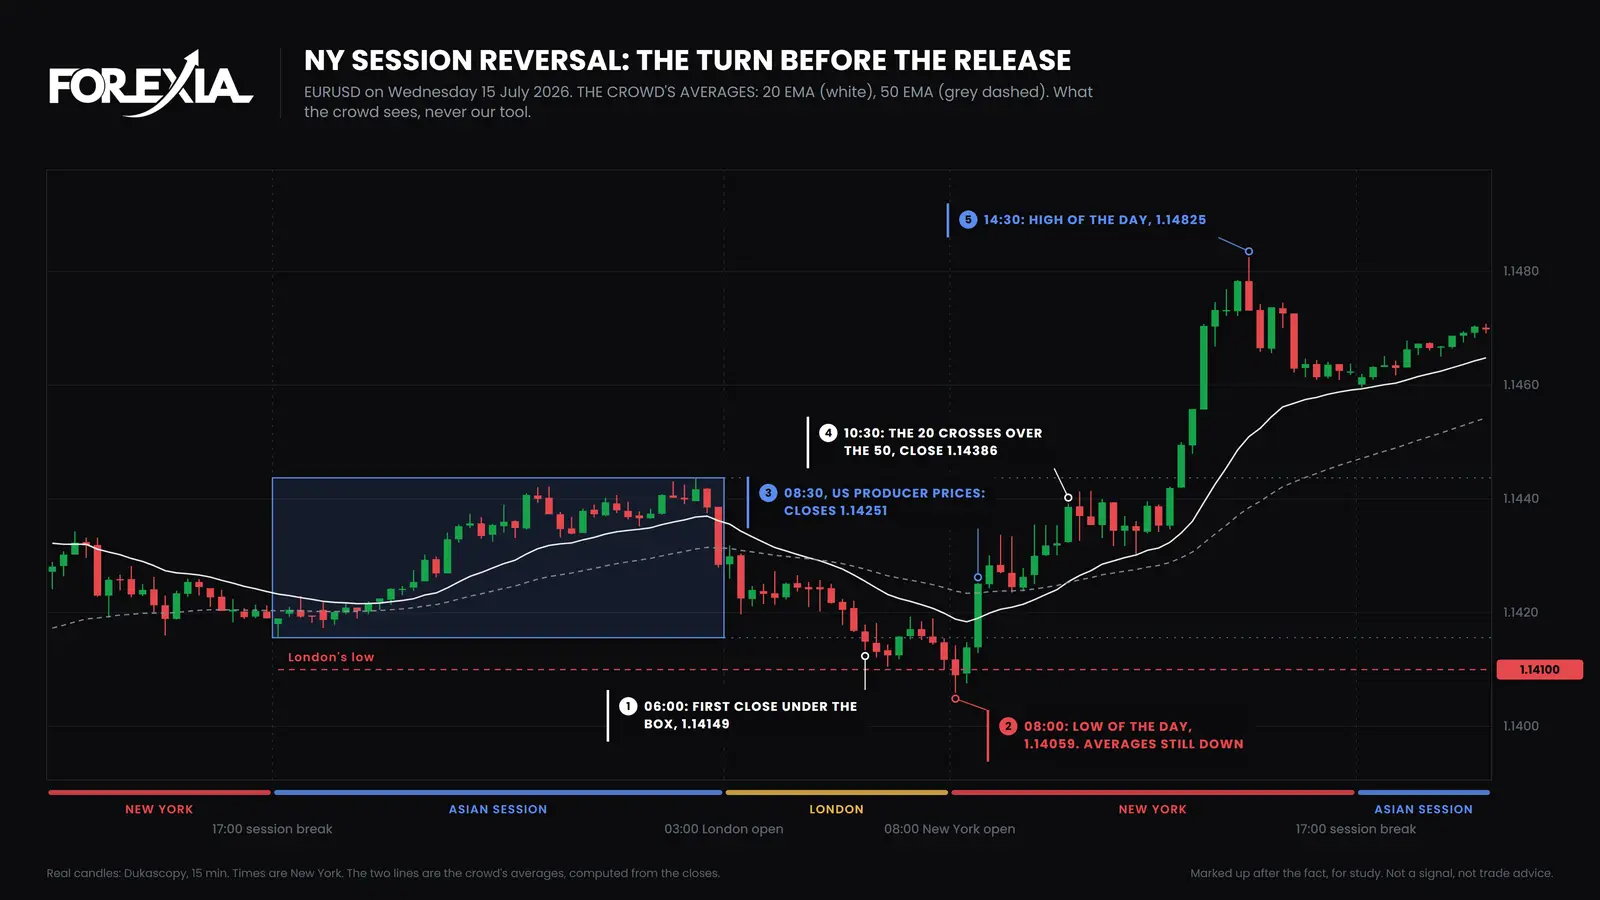
EUR/USD on Wednesday 15 July 2026 is the same order the other way up, with a release close enough to take the credit. Our chart's box ran 1.14156 to 1.14437, 28 pips. The 06:00 candle was the first to close under it, at 1.14149. Leave the wick of the night's first candle out of the box, as our counts do, and that first close is the 05:45 candle, at 1.14168. London's low was 1.14100 at 07:45.
New York's first candle went to 1.14059, 4 pips past London's low and the low of the day. It closed at 1.14090, still under that low. The 08:15 candle closed back above it at 1.14139. All of that came before the 08:30 US producer prices, whose candle closed at 1.14251, back inside the box.
A reader of the release would say producer prices turned the euro. The one-minute candles put the low about 20 minutes before it. The averages crossed up on the 10:30 candle, with a close of 1.14386, 33 pips over the low. The high was 1.14825 at 14:30, 77 pips off the low.
How late are the crowd's averages at a New York Reversal?
Late on nearly all of them. On 89 of the 91 days, the 20 EMA was still on London's side of the 50 EMA when the candle closed back inside the box. On 56 of those 89 they crossed by 17:00, a median hour and three quarters after the close back. On the other 33 they did not cross that day.
Some of that is arithmetic. London's move is hours old, so of course the averages point its way, and they point that way on days that never turn as well. That is the point. They cannot tell the two days apart, and they say nothing until much of the move has gone. The Trap takes this further.
What does a reversal that does not last look like?
Most of them look like this. Only 19 of the 91 closed through the box the other way by 17:00, so the NZD/USD and EUR/USD charts above are the tidy minority.
GBP/USD on Wednesday 2 September 2026 is more usual. The box ran 1.34923 to 1.35183, 26 pips. The 05:45 candle closed under it at 1.34862, and London's low was 1.34767. Then US jobs data from ADP landed at 08:15, and that candle reached 1.34773 without passing London's low. The 08:30 candle passed it by under a pip and the 08:45 candle by 2, to 1.34743, the low of the day.
The 09:15 candle, with nothing medium or high-impact on our calendar for it, ran 28 pips and closed back inside at 1.34975. By 09:45 price was at 1.35133, 39 pips off the low. It went no further. A candle closed under the box again at 13:00, and the 16:45 candle closed at 1.34843, a tenth of a pip from where London's last candle had closed at 1.34844.
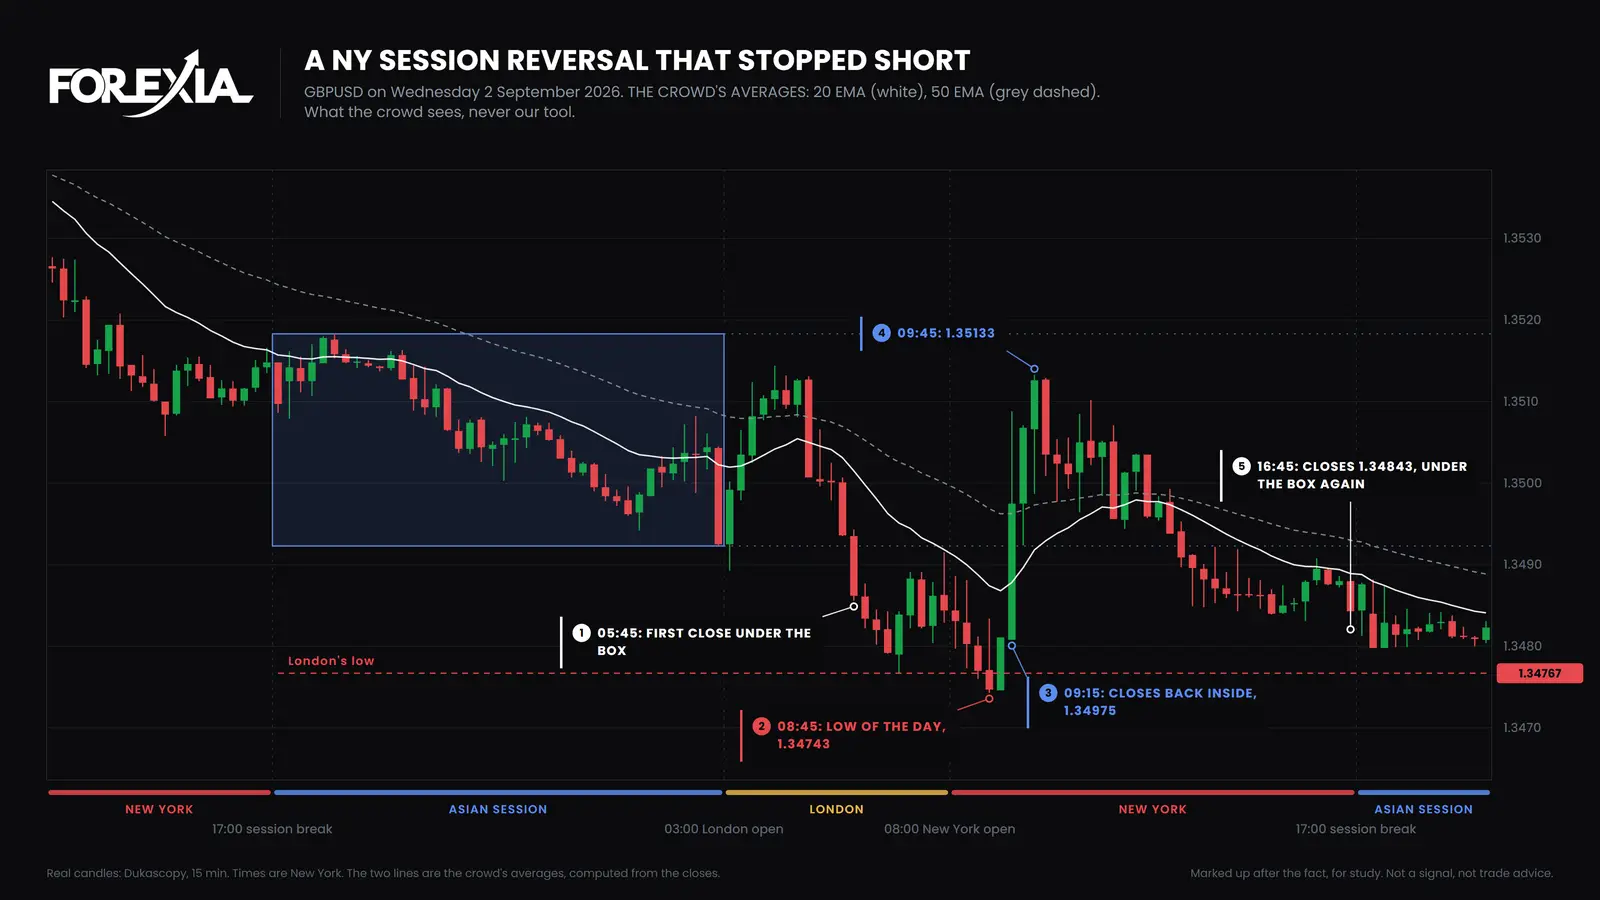
By our count that day is a New York Reversal, and it ended about where London left it.
Does it happen more on some pairs?
The count differs by market, though not by enough to build on. Of the days when London's break stood at New York's open:
| Market | London's break stood | New York Reversal |
|---|---|---|
| EUR/USD | 70 | 22 |
| GBP/USD | 68 | 13 |
| USD/JPY | 44 | 8 |
| USD/CHF | 56 | 12 |
| AUD/USD | 51 | 5 |
| USD/CAD | 68 | 15 |
| NZD/USD | 54 | 8 |
| Gold | 47 | 8 |
These are 25 weeks and four days on one feed, and a handful of days either way changes a row. Read it as a reason not to expect the same thing on every market, and nothing stronger.
What did each seat see?
The Three Seats read 15 July three ways.
- Retail saw a downtrend and then a release. The break was two hours old, the averages agreed, and the number looked like the reason for the turn.
- The market maker, as we read it, saw buyers' stops under London's low. A run to a new low sets those stops off and brings in fresh sellers, and all of that is selling a large buyer can fill against. We cannot show who bought 1.14059.
- The observer can state the order. The 08:00 candle went 4 pips past London's low, the 08:15 candle closed back over it, and the release came at 08:30.
How do you trade the New York session in forex?
Guides on this search offer a New York session forex strategy built on the first move after 08:00, a level from London, or an indicator's signal. None we read shows a dated record. We will not hand you another rule here. A reversal seen afterwards is not a setup, and these three charts were chosen afterwards. Our own test of the setup as a mechanical rule did not make money.
What the London session and New York session do offer is a sequence to read. Start with the night's range, as our Asian session strategy guide sets out. When London itself does the turn, it is a London session reversal, and New York only carries it.
What did these three days show?
Each showed something different about the first hours of New York.
- NZD/USD, 13 July. The first hour of New York looked like more of the same, and 09:00 was the high of the day.
- EUR/USD, 15 July. The low came about 20 minutes before the number, and price had come 33 pips by the time the averages crossed.
- GBP/USD, 2 September. The averages never crossed, and the day ended about where London left it.
Course 2 of ForexiaPRO, The Chaos Pattern, teaches this read step by step in lesson 2.4.1, The New York Reversal.
Frequently asked questions
What time does a NY session reversal happen?
Usually early. On the 91 days we counted, from 6 April to 1 October 2026, New York's run past London's extreme began a median half an hour after 08:00 New York, and 85 of the 91 began before 10:00. The close back inside the Asian range came later, a median three hours after 08:00.
Does news cause the NY session reversal?
Not on most of the days we counted. A high-impact US release fell inside the candle that ran past London's extreme on 10 of 91 days, and inside the candle that closed back on 3 of 91. On EUR/USD on 15 July 2026 the low came about 20 minutes before US producer prices, and the release candle only carried the move.
Do moving averages confirm a New York reversal?
Not in time to matter. On 89 of the 91 days the 20 EMA was still on London's side of the 50 EMA when the candle closed back inside the range. On 33 of those 89 the two did not cross at all before 17:00. Averages trail a move by construction, so this shows how late they are, not that they predict anything.
How far does a NY session reversal run?
Often not far. Of the 91 days, 19 closed through the box the other way by 17:00. On GBP/USD on 2 September 2026 the turn ran 39 pips, and the day closed a tenth of a pip from where London's last candle had closed.