
The London Breakout: What the Strategy Says, and Why the Crowd Buys the Top
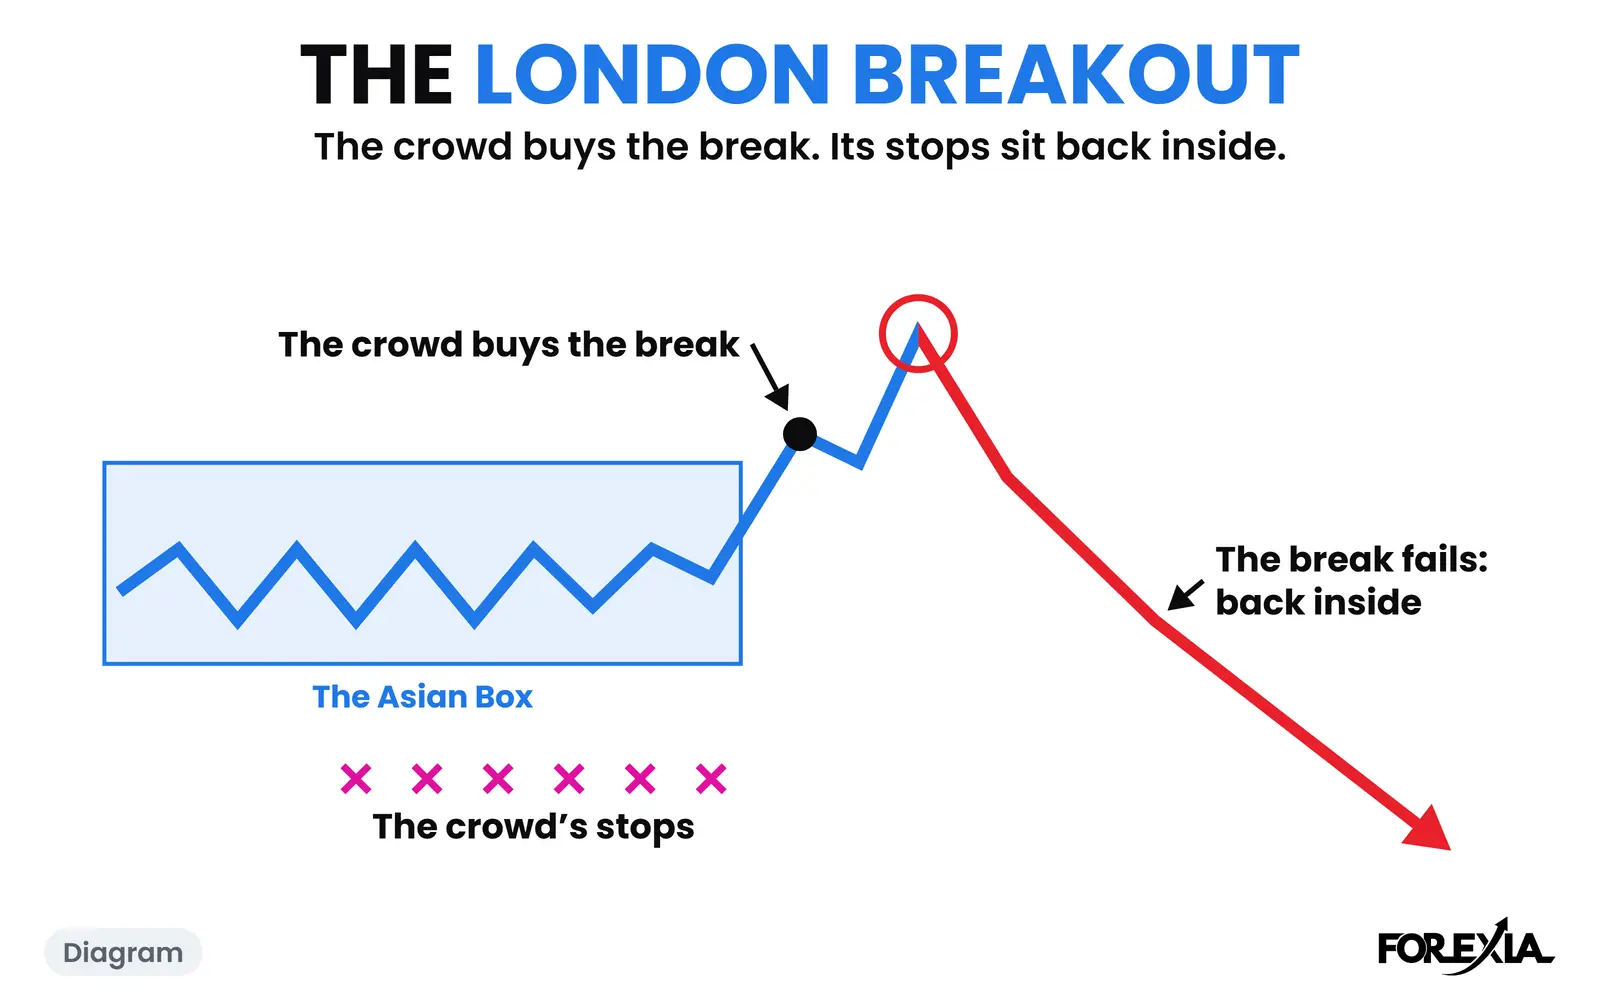
The London Breakout is the move out of the Asian range at the London open, where retail enters for the continuation. The turn can come in London too. A London breakout strategy is the textbook version of that move: trade the first break of the night's range. We read the same candles from the crowd's seat, as the place where its entries and stops go on show.
What is the London breakout strategy?
It is a rule most guides agree on in outline. Mark the high and low of the Asian session. Trade the first break after the London open, either with a stop order just outside the range or on the first close beyond it. Put the stop back inside: at the far side of the range, below the entry candle, or a few pips behind the level that broke. Aim for a multiple of the range, and close by midday if neither is hit.
The details change from page to page: 00:00 to 07:00 GMT or 02:00 to 06:00, a 15 or a 30-minute chart, one times the range or two. Most guides suggest the euro and the pound. London is the obvious session to choose, since sales desks in the UK handled about 38% of world forex turnover in April 2025. The strategy describes what the crowd does, and that makes it useful to read even if you never trade it.
What does the London Breakout look like on a chart?
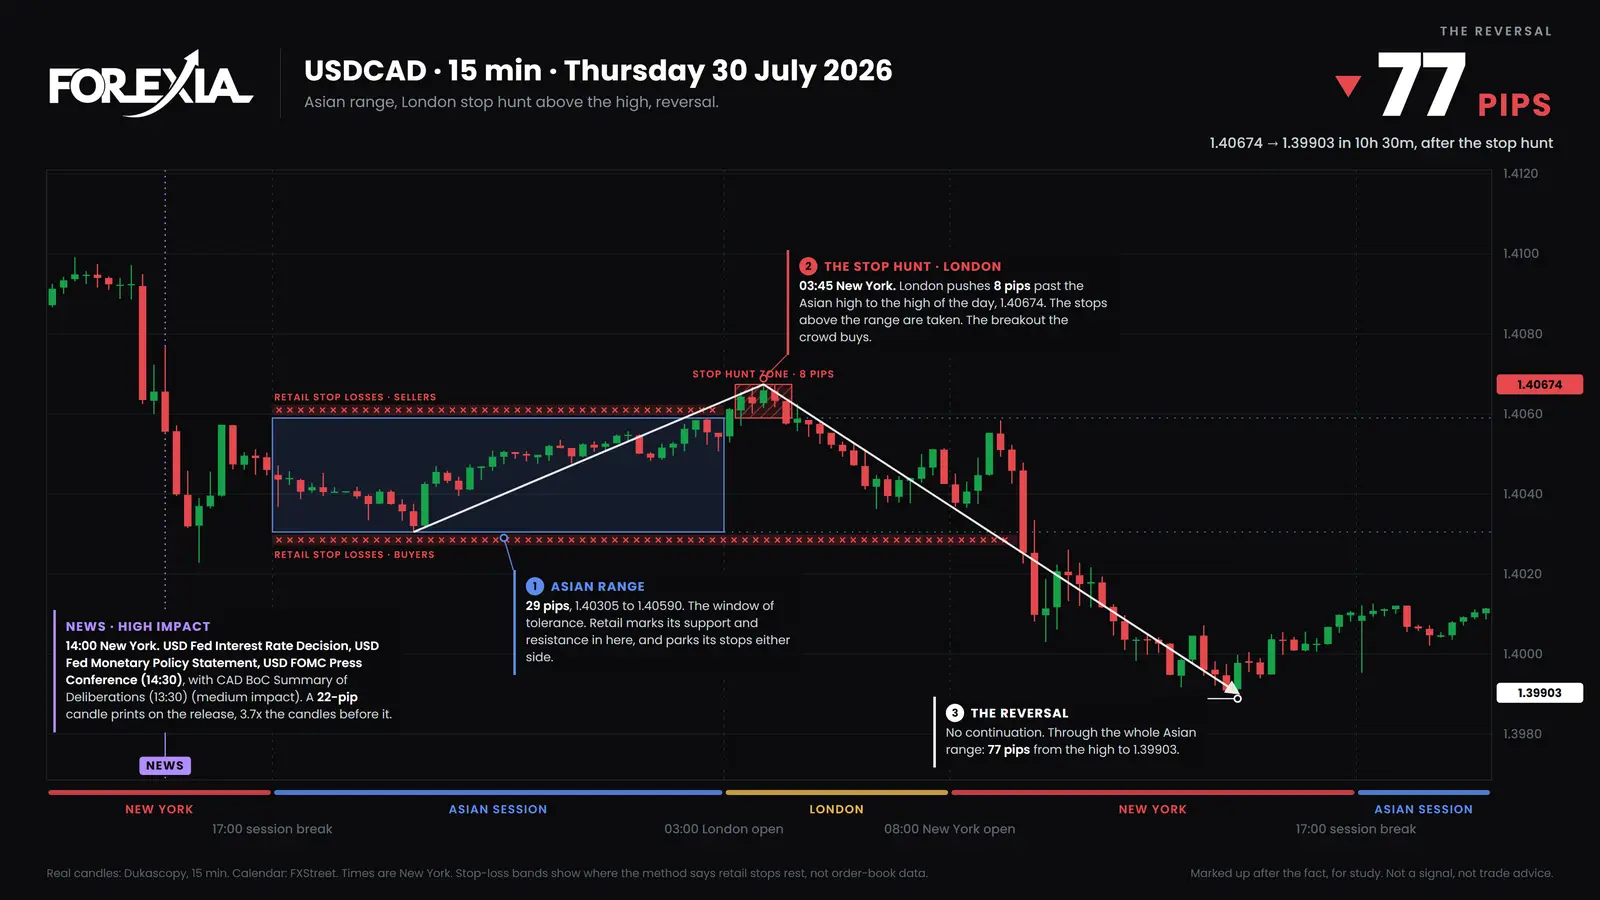
It looks like the move everyone waited for. On USD/CAD on Thursday 30 July 2026 the Asian Box ran from 1.40305 to 1.40590, 29 pips. London's first candle closed over it at 1.40612, about 2 pips clear: the crowd's buy, by the book.
Now follow the stop places textbook guides teach for that buyer, tightest first.
- A few pips behind the level that broke, 1.40590. The very next candle dipped to 1.40570 and closed back over it. The high came at 03:45, 1.40674, only 8 pips over the box, and the 04:15 candle closed back inside at 1.40576. We read that high as a Stop Hunt: the stops over the box filled by someone selling into them.
- Below the low of the entry candle, 1.40529. The 05:00 candle traded to 1.40525, two hours into London.
- At the far side of the range, 1.40305. The 09:30 candle, which opened an hour and a half into New York, closed at 1.40253, and took Wednesday's low of 1.40228 on the way down.
By 14:15 price was at 1.39903: 77 pips off the high and 40 under the box. London did the turn on this day, as our guide to the London session reversal describes. At New York's open price was already back inside. The crowd we call Dumb Money is not stupid here. It did what the books say, and everyone could see where its stops were.
The London Breakout and the London breakout strategy: how do they differ?
The strategy asks which way price will go. Our word asks who has just been invited in. They point at the same candle: the first close out of the box. To the textbook it is an entry. To us it is the crowd's entry, marked on the chart, with its stops marked behind it.
We also do not treat it as finished at the break. It is the second of three phases in the Chaos Pattern, and the hub sets the London open fakeout beside the sessions around it. For the mechanics of the hunt itself, see the London open stop hunt.
How often does a London breakout hold?
About a quarter of the time, on this rule. We counted seven majors and gold on 15-minute candles from 6 April to 1 October 2026, without the rollover wick in the box. London closed outside the box on 745 of 1,030 market-days. Of those 745:
- 287 (39%) were back inside the box, or across it, by New York's open
- 264 (35%) were still outside at New York's open, and a New York candle closed back inside
- 194 (26%) were still outside at New York's open, and no New York candle closed back inside
That last line is the day the strategy is written for, and it does happen. The others do not make fading the break a plan: of the 287, 103 closed through the box the other way by 17:00. This counts candles, not trades, with no entry, stop or cost. Our own test of the setup as a mechanical rule did not make money. Does the London breakout strategy work takes that question on, and why the London breakout fails takes the reasons.
What do traders get wrong about the London Breakout?
Three readings cost the most.
- Taking one close for the day's direction. On USD/CAD the first close came on London's first candle. Price went 6 pips further, then 77 the other way.
- Trusting a range because it lasted. A night of turns at one line makes a stop behind it feel protected. We read those hours as the ones in which the orders were built, and all three stops went that day.
- The turn belongs to New York. London can undo its own break, and did on 287 of the days we counted.
Which words does the London Breakout lead into?
Three sit next to it.
- The Asian Box: the range the break comes out of.
- Dumb Money: the predictable retail herd the chart is built to trap.
- The Stop Hunt: price driven into clustered stops to fill the other side.
Where is the London Breakout taught?
Course 2 of ForexiaPRO, The Chaos Pattern, teaches this read step by step in lesson 2.2.1, The London Breakout, From the Crowd's Seat.
Related words
Frequently asked questions
What is the London breakout strategy?
It is a textbook rule: mark the Asian session's high and low, then trade the first break of that range after the London open, with a stop back inside it and a target set as a multiple of the range. Versions differ on the window, the stop and the exit. Forexia's word, the London Breakout, names the same move and reads it from the crowd's seat.
How often does a London breakout hold?
On seven majors and gold from 6 April to 1 October 2026, London closed outside the Asian Box on 745 market-days. On 287 it was back inside or across by New York's open, on 264 a New York candle closed back inside, and on 194 the break was still standing at 17:00. That counts candles, not trades.
Why does the London breakout fail so often?
We read it this way: the crowd's entries and stops sit at prices everyone can see, so a move back into the box has orders to fill. That is a reading, not something the chart can prove, and about a quarter of the breaks we counted carried.
Can the turn come in London instead of New York?
Yes. On USD/CAD on 30 July 2026 the candle that opened 75 minutes into London closed back inside the box, and price was inside it when New York opened. In our count London undid its own break by New York's open on 287 of 745 days.