Does the London Breakout Strategy Work? Two Days That Did Not Turn, and What a Count Cannot Show
Dylan Forexia10 min read
Does the London breakout strategy work? On what we can show, not reliably, and we have no figure for what it makes. A London candle closed outside the night's range on 745 of the days we counted, and the break stood all day on 194. That counts candles, with no stop, target or cost, so it cannot tell you how often a trade won.
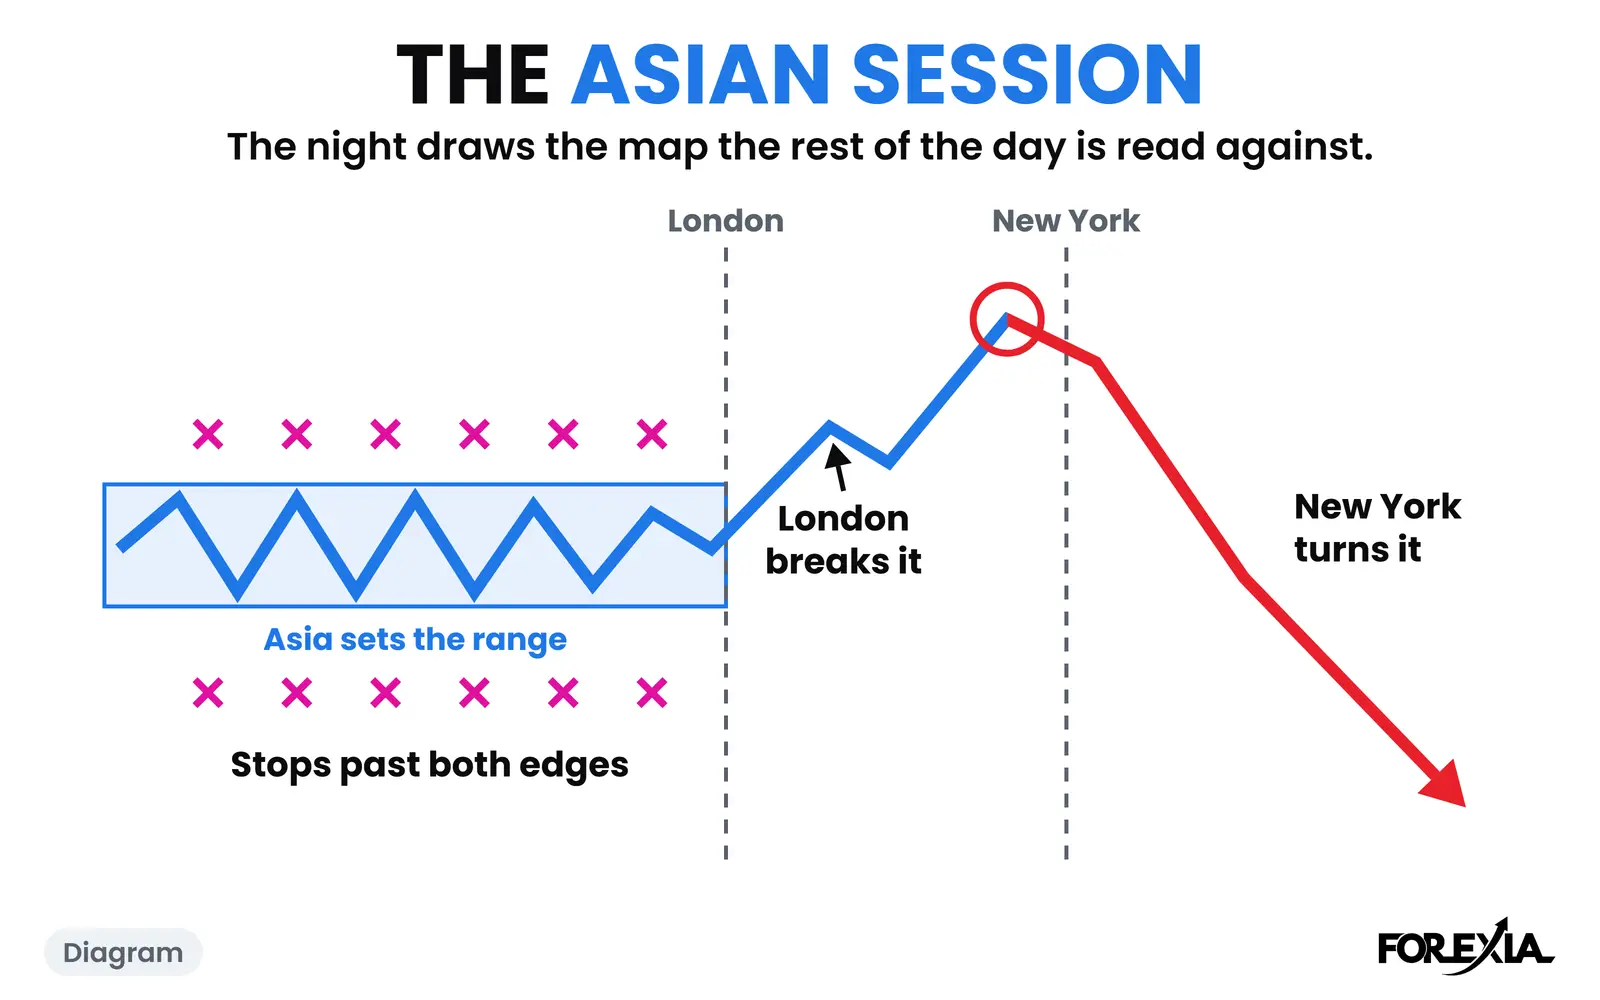
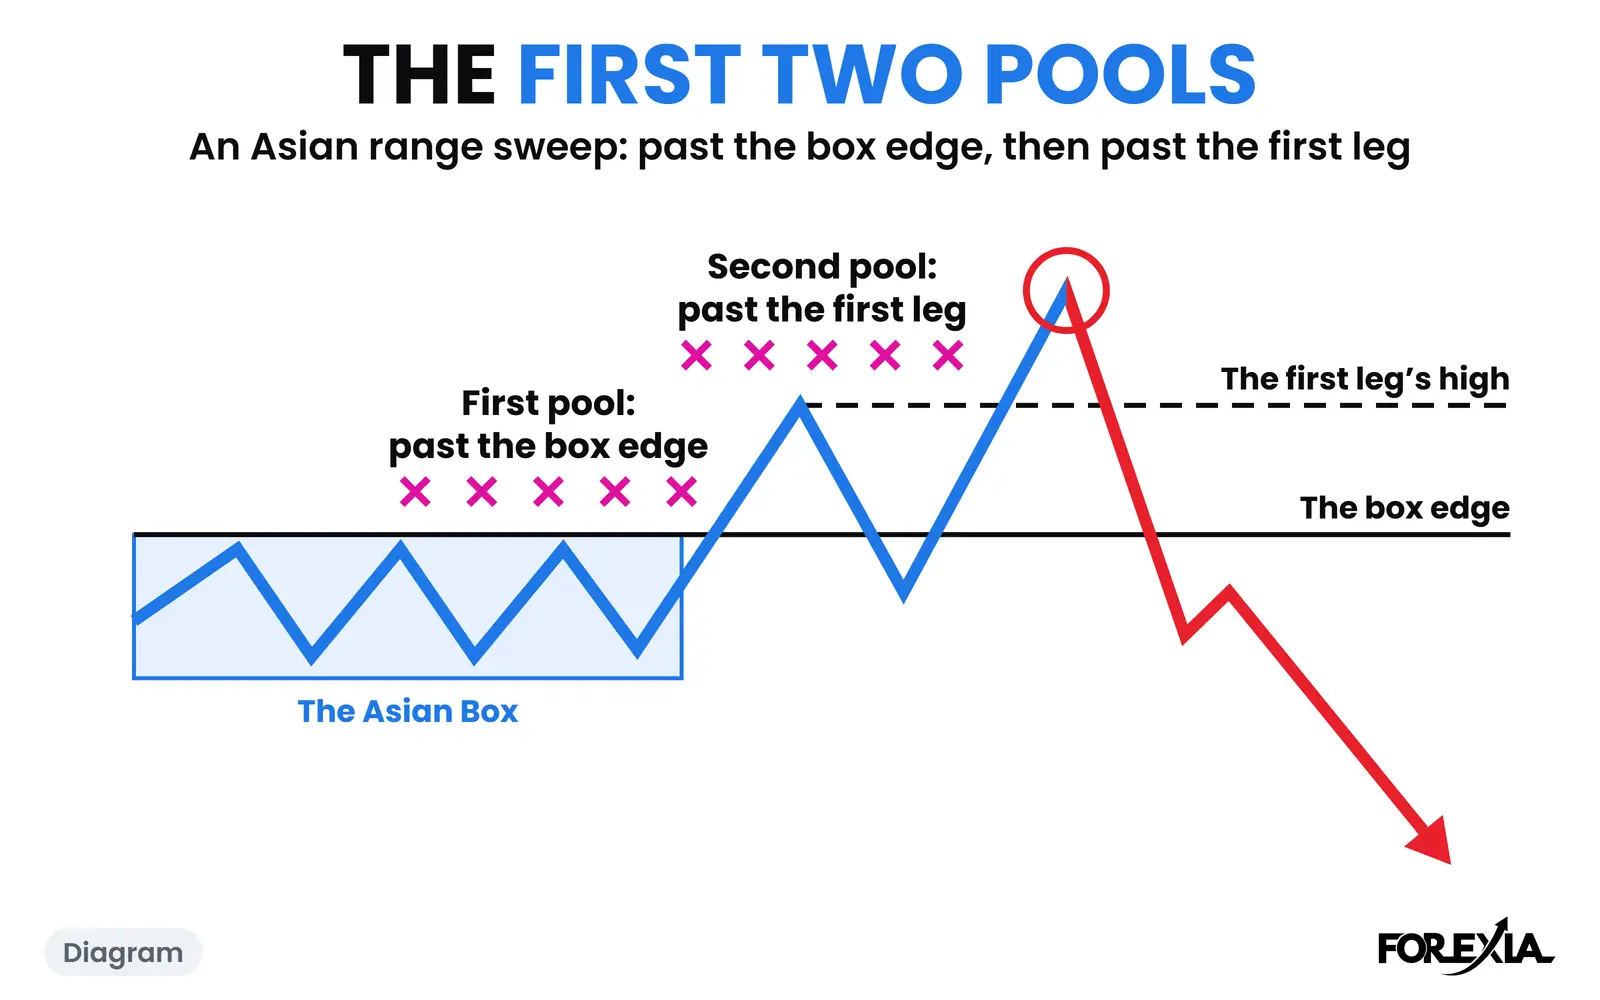
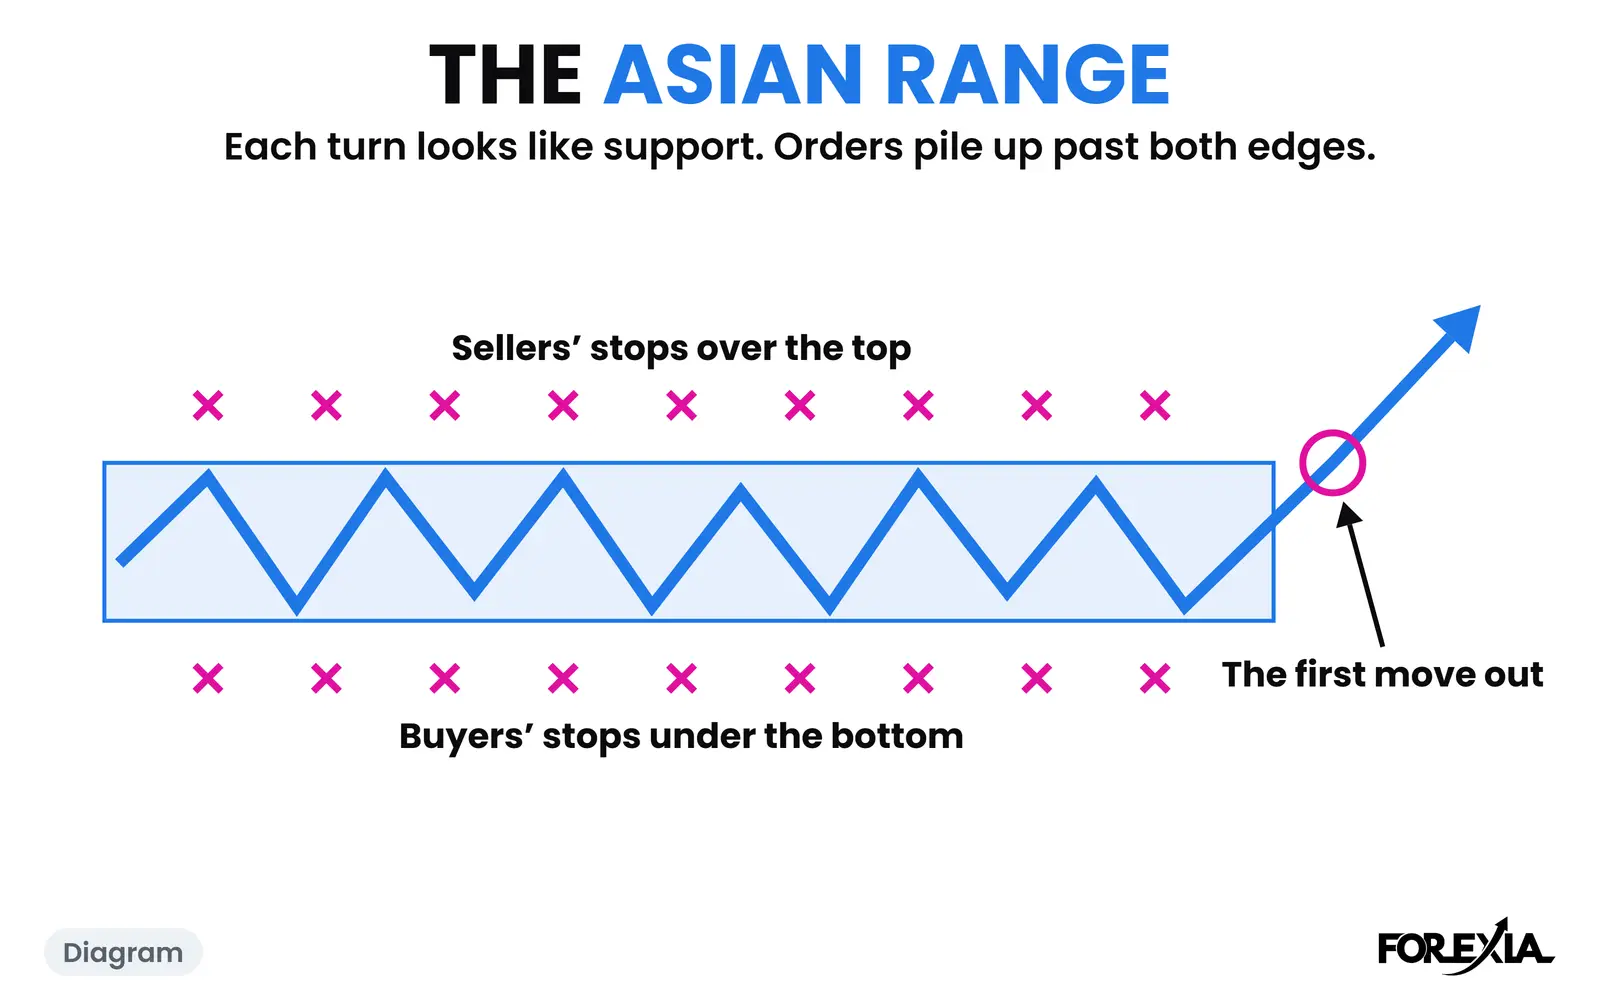
The London breakout strategy is the textbook version of the London Breakout: trade the first break of the night's range after the London open. That page gives its rules. Below are the count, what the count cannot show, and three real days that make the gap plain, including two that did not turn. All times are New York, and a candle is named by when it opens.
Does the London breakout strategy work? What our count shows
It shows what closes did. We counted seven majors and gold on 15-minute closes, 1,030 market-days from 6 April to 1 October 2026, with the Asian Box drawn from the session break to the London open.
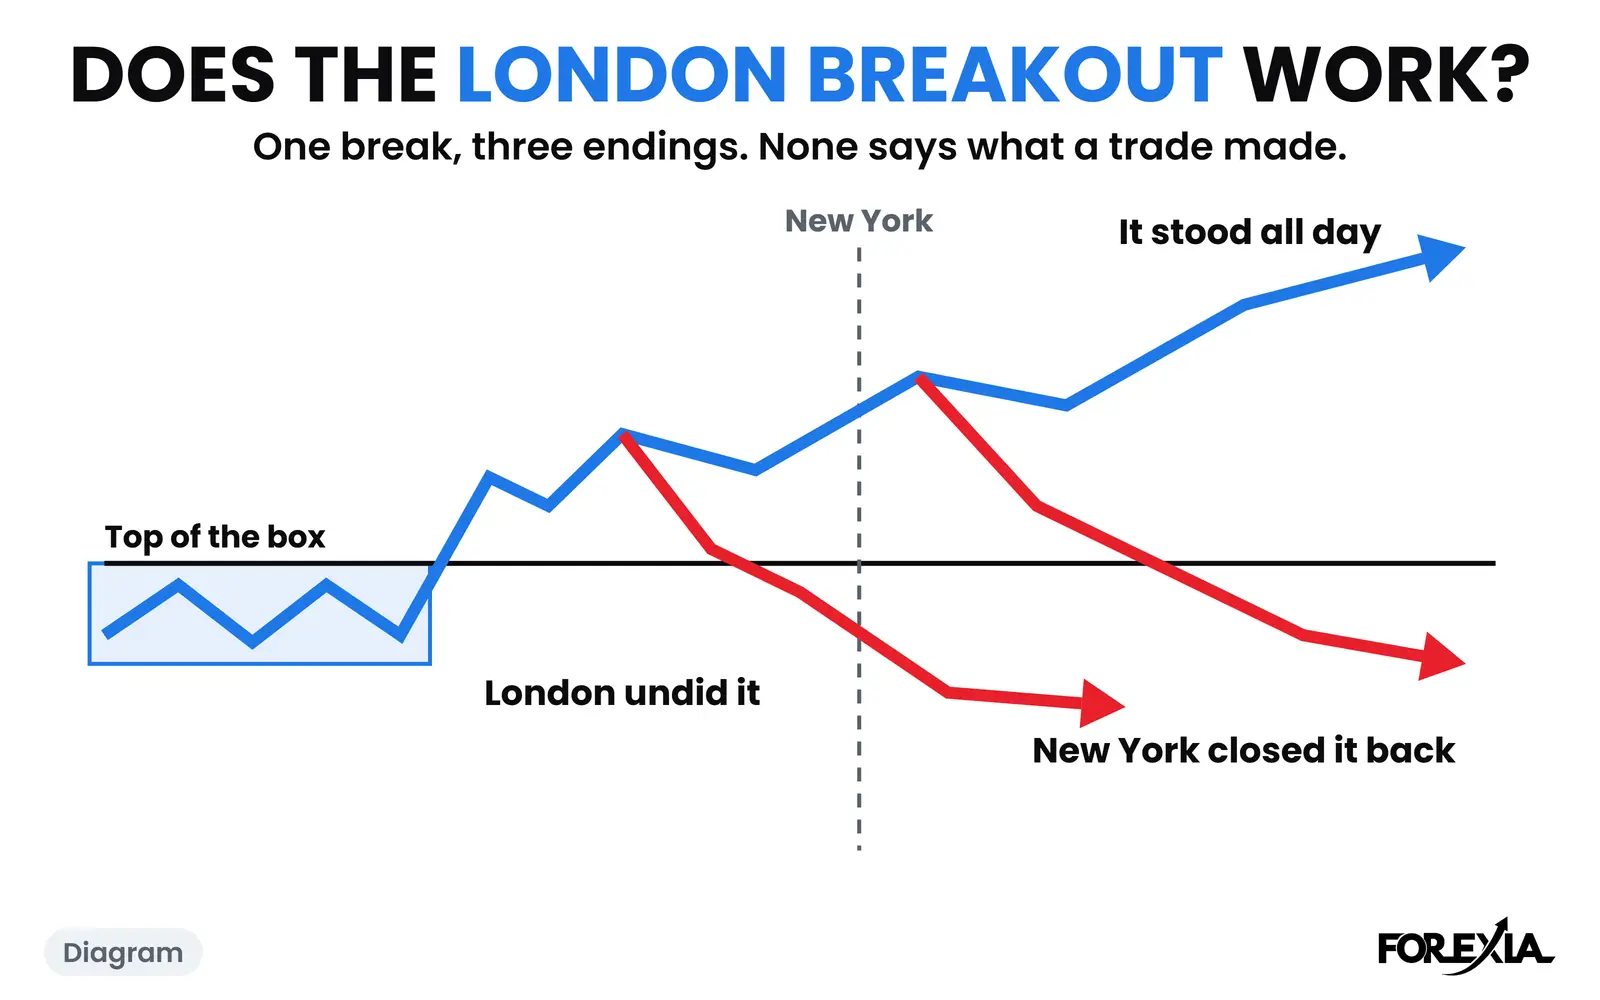
On 285 days no London candle closed outside the box, so a rule built on a London close had nothing to enter. On the other 745, London undid the break by New York's open on 287. It stood at New York's open and a New York candle closed back inside on 264. It stood all day on 194. Why the London breakout fails takes those figures from the crowd's seat and asks why, and a London session reversal is the day London does the turn itself.
The markets do not differ by much. Of the 458 days a break stood at New York's open, this is how many it was still standing at 17:00:
| Market | Stood at New York's open | Stood all day |
|---|---|---|
| EUR/USD | 70 | 26 |
| GBP/USD | 68 | 31 |
| USD/JPY | 44 | 18 |
| USD/CHF | 56 | 23 |
| AUD/USD | 51 | 23 |
| USD/CAD | 68 | 26 |
| NZD/USD | 54 | 23 |
| Gold | 47 | 24 |
If you came for a GBP/USD London strategy, the pound's row sits inside a narrow spread, on a small sample. It is no reason to pick the pair.
What can the count not show?
Most of what you actually want to know. Here is the list, plainly.
- How often a trade won. We have no such figure, for this strategy or any rule of ours. A trade is settled by its stop, its target and the order price reached them. We counted closes past a line.
- What it made. There is no entry, stop, target, spread or commission anywhere in these numbers, so there is no profit or loss in them either.
- Which days were good for the strategy. A break that stood all day can still stop short of the textbook's target line, and a break that closed back can already have crossed it. The two pound days below are one of each.
- Any rule of ours. The course sorts days like these with a read of its own. That stays in the course, and this count neither gives it nor tests it.
- Much about the long run. It covers 25 weeks and four days, on one feed, with eight markets that often move on one dollar.
A day the break stood: GBP/USD, Monday 27 July 2026
This is the day the strategy is written for. The night's box ran 1.33186 to 1.33633, 45 pips. The 06:45 candle closed under it at 1.33185, by a tenth of a pip. The crowd's sell, by the book. Durable goods at 08:30, a medium item, was the only medium or high-impact release on the calendar for the pound or the dollar all day.
Then price went the crowd's way. It came back to 1.33210 on the next candle and to 1.33207 at 09:30, 2 pips into the box, and no candle closed there. The low was 1.32842 at 13:30. New York never turned it, as the New York Reversal page shows.
Now set that first close against the textbook's usual lines. They are arithmetic on the box, there to show how far price went. They are not a result of ours or a rule of ours.
- The far side of the box, where guides often put the stop, sat 45 pips over that close, and price never went back to it. The day's close, 1.32879, was 31 pips under that first close, a shorter distance than the one to the far side.
- A stop line 3 pips behind the level was missed by under a pip.
- One box under the box, a common textbook target, is 1.32739. Price stopped 10 pips short of it.
- The clock. At 12:00 New York price was 17 pips under that first close. One guide's 12:00 GMT exit is 08:00 New York here, and price was 5 pips under it then.
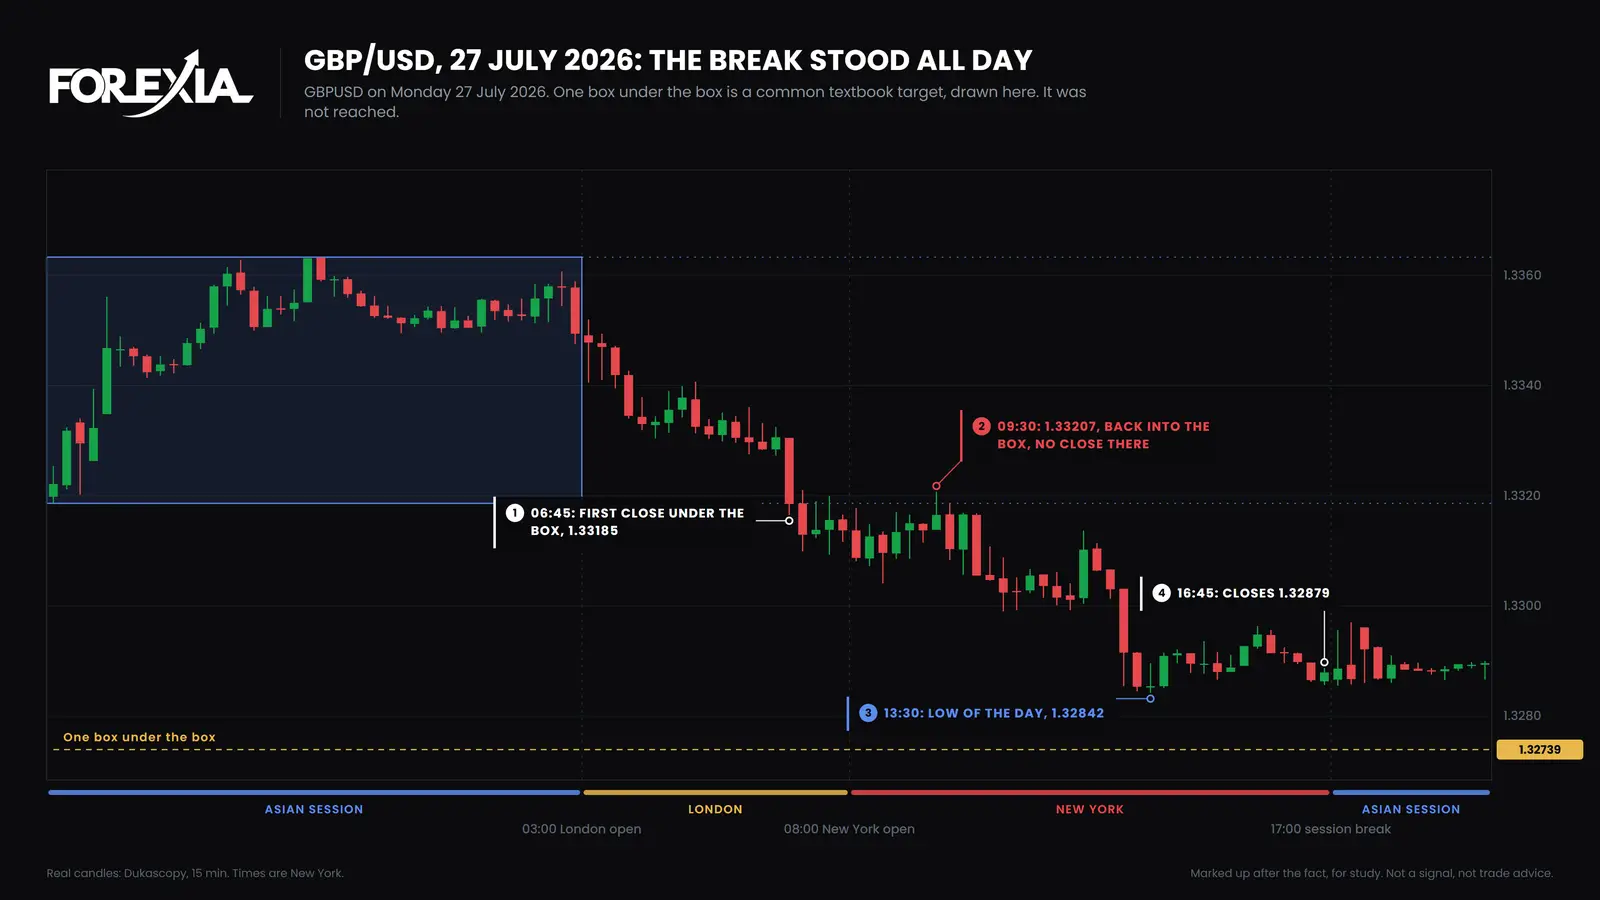
One more thing about that box. On the feed our course's captures use, the same night's box was 31 pips and not 45, and the first close under it came at 05:15 and not 06:45. On that feed price did reach one box under the box. Same day, same market, and the line is met on one feed and missed on the other. Our night's low came in Sunday's first candle, and thin candles at that hour differ from feed to feed.
A day with no break: AUD/USD, Monday 28 September 2026
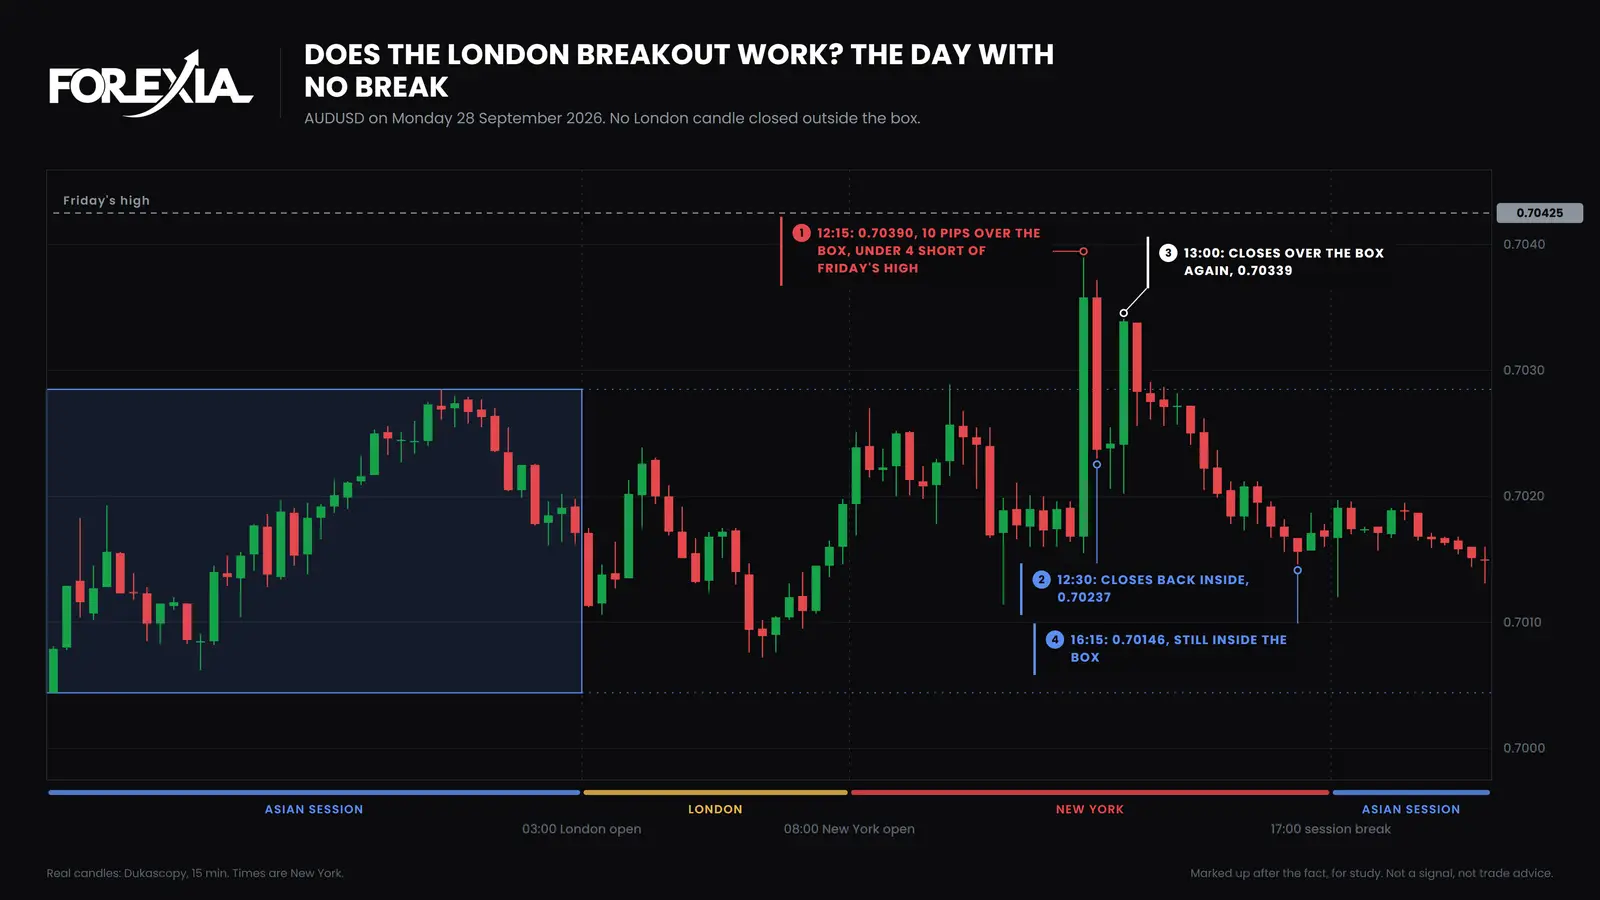
This is the day the strategy never gets to play. The box ran 0.70044 to 0.70285, 24 pips, and nothing medium or high-impact was on the calendar for the Aussie or the dollar all day. London traded from 0.70072 to 0.70239, inside it, and not one candle closed outside. A rule on London's close had nothing to enter, and it is one of the 285.
New York then did something late. At 09:45 price poked under a pip over the top and closed inside. At 12:15, four hours in, one candle ran to 0.70390, 10 pips over the box and under 4 short of Friday's high of 0.70425, and closed at 0.70358. The 12:30 candle closed back inside at 0.70237. The 13:00 candle closed over the box again at 0.70339, and the 13:15 candle closed back inside at 0.70283.
By 16:15 price was at 0.70146, 24 pips off the high. So there was a stop hunt, what most traders call a liquidity sweep, and it turned, by 24 pips. That late close, 0.70358, was 12 pips over where the next candle closed. Read as a reversal, it was a small one.
A break that did not stand, after crossing one box: GBP/USD, Tuesday 22 September 2026
This day shows the other half of the problem. The count files it among the breaks that did not last, and price had crossed the textbook's one-box line before it closed back.
The box ran 1.33604 to 1.33868, 26 pips. The 03:45 candle closed under it at 1.33542. One box under the box was 1.33340. The 04:30 candle, with an ECB speaker on the calendar and nothing for the pound, went straight to 1.33259 and closed back at 1.33554. The 05:45 candle closed back inside at 1.33704.
So within 45 minutes of that first close, price had crossed the one-box line without going back to either stop line from 27 July's list. A chart reader then sees a failed break, and the count files it as one of the 264. The count leaves the wick of the night's first candle out of the box, which has London's last close, 1.33604, just under the bottom, and New York's first candle closing back inside at 1.33636. Later the low of the day came at 12:30, 1.33213, 39 pips under the box. The day ended at 1.33428.
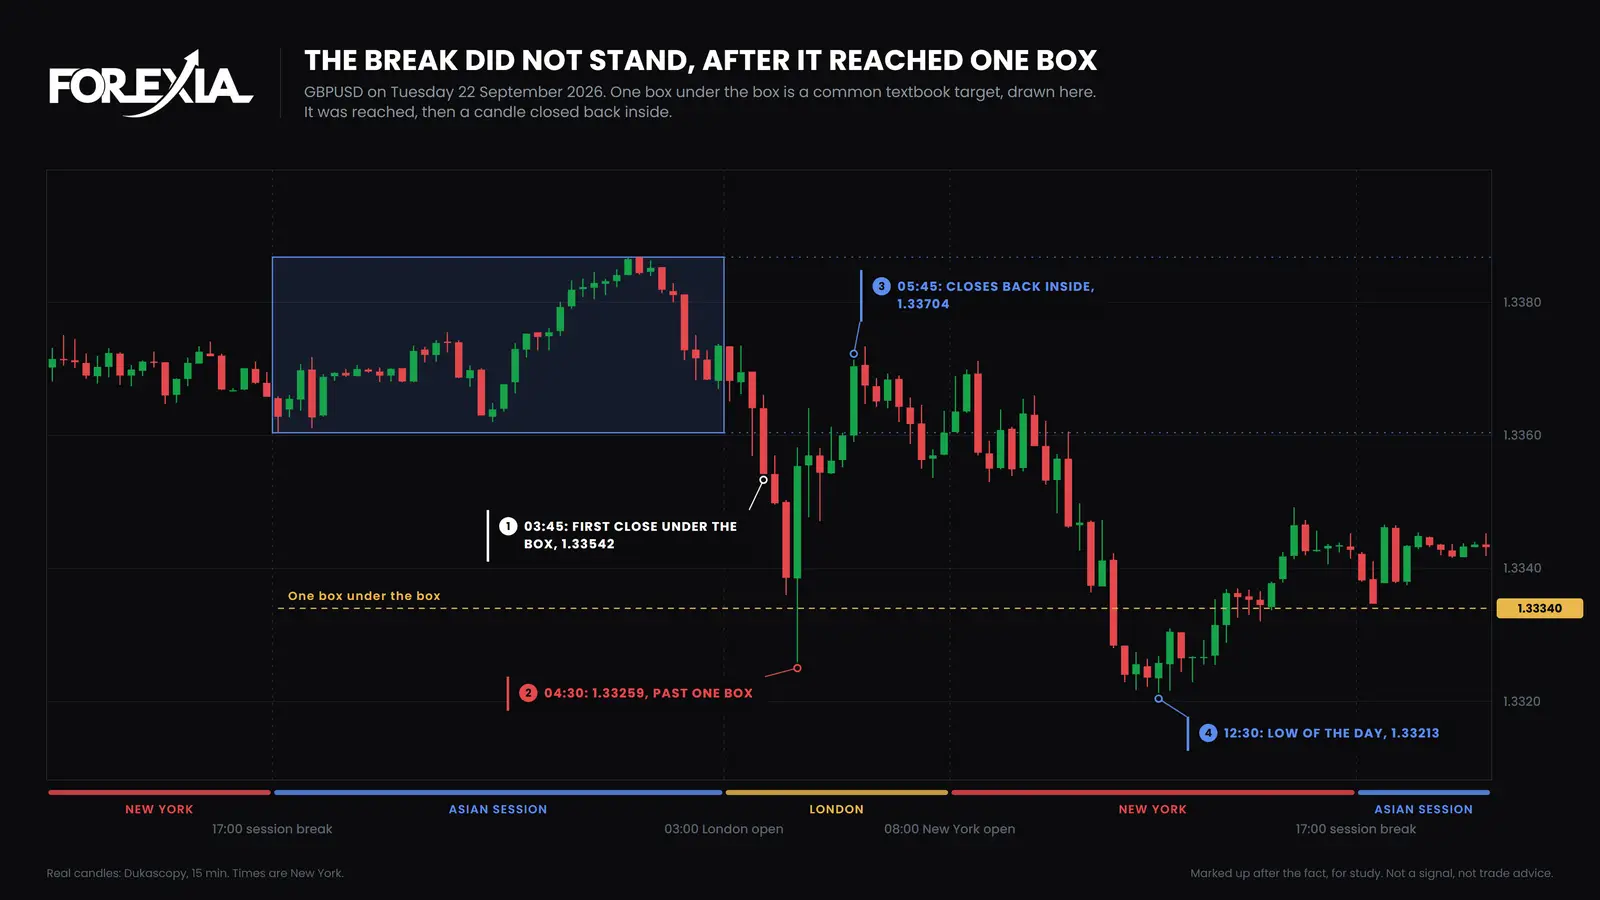
Put 27 July and 22 September side by side. The break that lasted all day never reached the one-box line. The break that did not last crossed it inside 45 minutes. A count of closes sorts the two days one way and the textbook's line sorts them the other, and that is why the count cannot answer this question alone.
Has anyone tested the London breakout strategy?
Some have, and it is not encouraging, with limits. One backtesting vendor published a 15-minute GBP/USD version: a 00:00 to 06:00 UTC range, a 20-pip stop, a 40-pip target, ten years to October 2026. It lost money in every calendar year, and by its own account it was about break-even before costs. It sells the software, it is one set of settings, and we did not rerun it. An older review on a trading education site covers eight weeks of 2012 and came out ahead, which is too short to settle anything. The pages we read that say the strategy still works show no record at all.
We have not run this textbook version as a fixed rule, so we have no result of our own to give you. What we ran is closer to the opposite, a setup against the hunt, and our research reports that it did not make money either. Neither result settles the other. So if you want to know whether your London breakout works, write the rule down, include real costs, and test it on data it has not seen.
Why do breakouts keep failing in forex?
They do not all fail, and "failing" is doing a lot of work in that sentence. On our closes, 26% of the 745 London breaks stood all day, and you have just seen a break that stood and stopped short of one box, beside one that crossed it and then closed back. Our reasons are on why the London breakout fails, and the hub's forex market hours page sets the morning beside the other sessions.
What did each seat see?
The Three Seats read 27 July differently.
- Retail saw a clean close under the box and a low nearly seven hours later. It is why the crowd comes back for the next one.
- The market maker, as we read it, had orders further on. The run went where more stops lay, past London's low, and nothing forced a turn. We cannot see those orders.
- The observer can state what the day did. New York carried London's move on, and no candle closed back inside the box.
Common mistakes
All three come from asking one figure to answer several questions.
- Reading a count of closes as a track record. 194 of 745 tells you how often a break lasted, and nothing about what a trade made.
- Fading every break because most do not last. Of the 287 breaks London undid, 103 closed through the box the other way by 17:00, and GBP/USD on 27 July ran all day against anyone who faded it.
- Comparing backtests with different rules. The hours, the stop, the exit and even the feed each change the answer, as one Monday's box shows.
Course 2 of ForexiaPRO, The Chaos Pattern, teaches this read step by step in lesson 2.4.3, Days It Did Not Turn.
Frequently asked questions
Is the London breakout strategy profitable?
We cannot say, and we have not run it as a fixed rule. One vendor's public test of a 15-minute GBP/USD version over ten years lost money in every calendar year, and it covers one set of settings. The pages we read that call the strategy profitable show no record. Test your own version, with its costs, on data it has not seen.
How often does a London breakout hold?
On seven majors and gold from 6 April to 1 October 2026, a London candle closed outside the Asian range on 745 market-days, and the break stood all day on 194. That counts closes, not trades. It does not tell you how often a trade with a stop and a target would have won.
What is the best pair for the London breakout?
Our count does not pick one. Of the days a break stood at New York's open, it stayed standing on 31 of 68 on GBP/USD, 26 of 70 on EUR/USD and 24 of 47 on gold. Those are small samples on one feed, and they say nothing about what a trade would have made on any of them.
Why can two backtests of the London breakout disagree?
Because the strategy is a family of rules, and each changes the result: the range's hours, the entry, the stop, the target, the exit, the costs. Even the data feed matters. GBP/USD on 27 July 2026 has a box of 45 pips on our feed and 31 on another, and the first close under it came 90 minutes apart.