
The New York Reversal: Why New York Undoes London, and How Often It Does
The New York Reversal is the dealer moving in the opposite direction of the London breakout during the New York session. It is what traders search as new york reversal forex, and we use it narrowly: London breaks the Asian range and holds outside it, New York runs past London's extreme, and price closes back inside the range. In our count that happens on one such day in five.
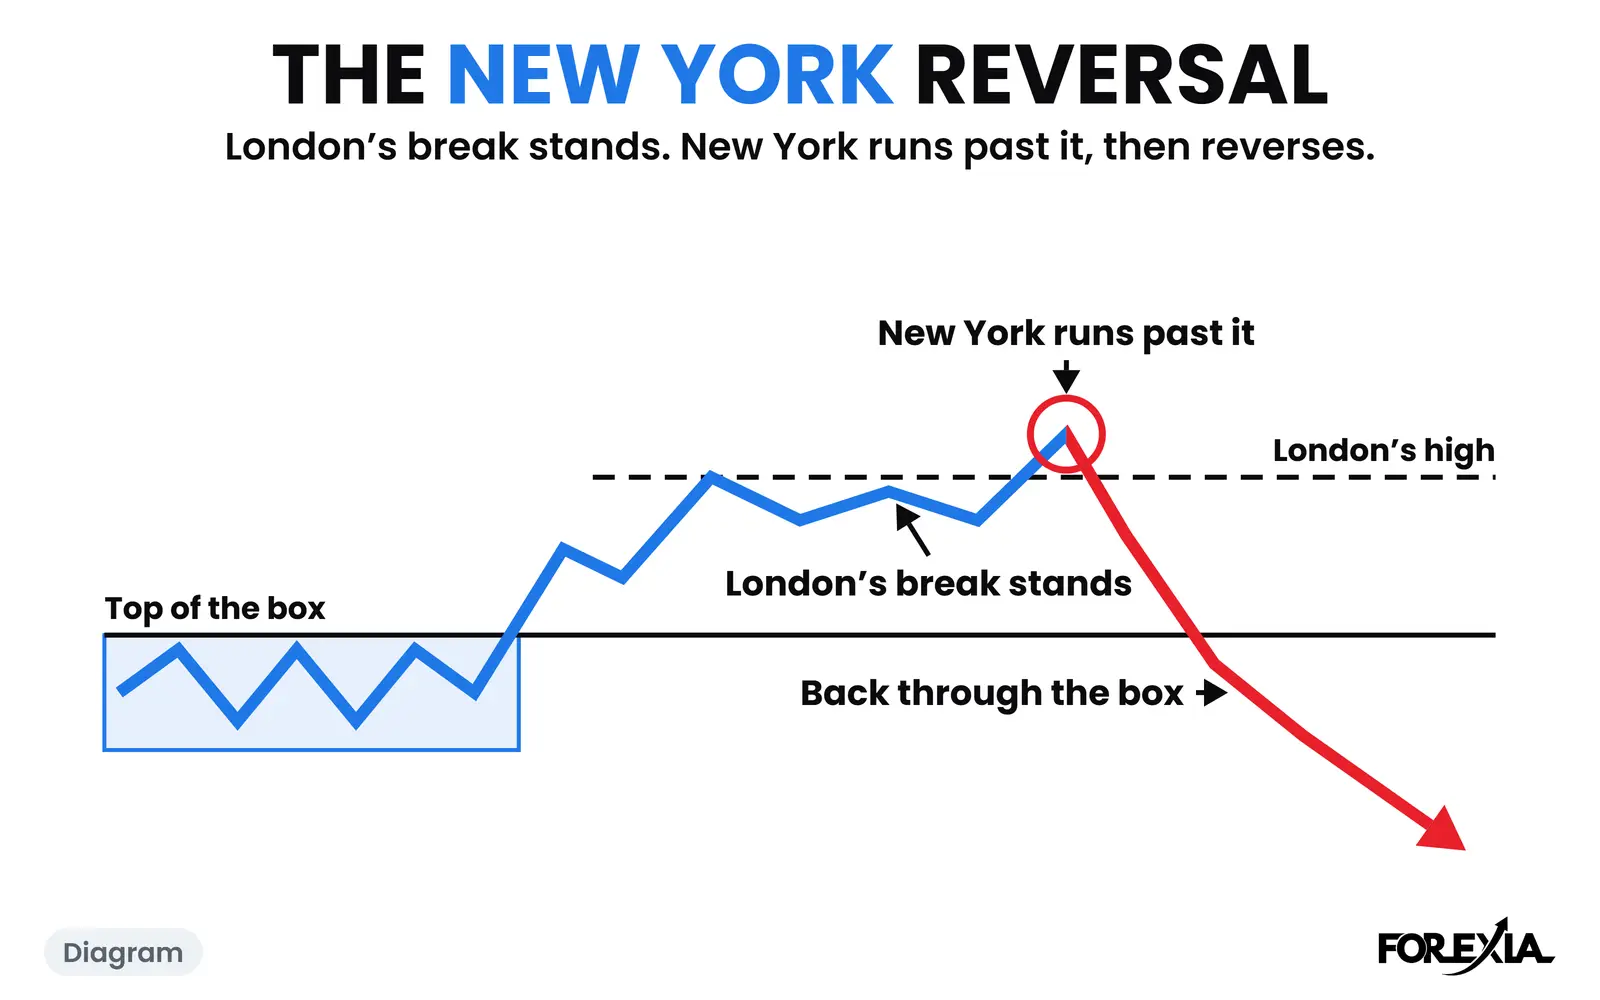
What does the New York Reversal look like on a chart?
It looks like one last push in London's direction. On NZD/USD on Monday 13 July 2026, with no medium or high-impact release for either currency near the turn, the Asian Box ran from 0.57471 to 0.57702, 23 pips.
- London breaks it. The 03:45 candle closed over the box at 0.57729, the London Breakout. At 04:45 London's high was 0.57861, 16 pips over. London's last candle closed at 0.57808, still outside, so the break was standing when New York opened.
- New York runs it once more. The 09:00 candle reached 0.57880, 2 pips past London's high and the high of the day. It closed at 0.57844, back under London's high. That is the Stop Hunt, a liquidity sweep of the stops that anyone selling London's high had left above it, and the second top of an M.
- The move goes the other way. The 11:00 candle closed back inside at 0.57701, by a tenth of a pip. The 16:00 candle closed under the whole box at 0.57465. By 16:15 price was at 0.57435, 44 pips off the high.
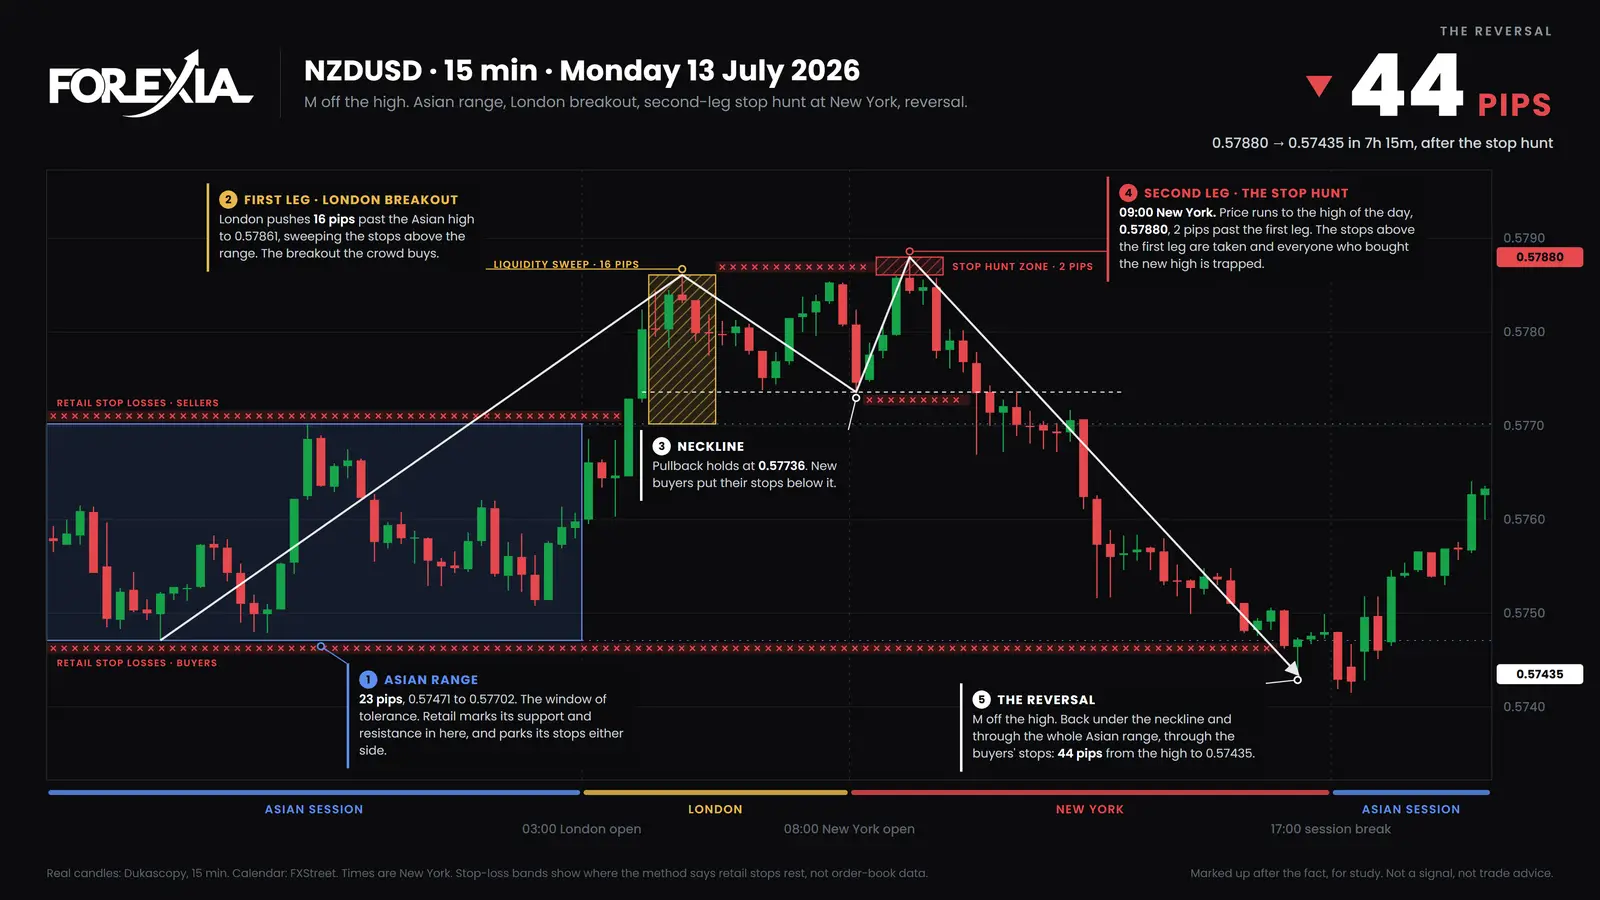
Read it from the Three Seats. For the crowd, London's break has held for five hours and looks like the trend. We read the market maker's seat as a pile of orders over London's high, filled by selling into them. The observer has marked the level London left and waits for the close. We cannot see who sold. We can see where the stops had to be, and what price did next.
The New York Reversal and "new york reversal forex": how do they differ?
The searched phrase is loose. Forum threads and indicator scripts use it for almost any turn after the New York open, on windows that disagree, and few say how you would know it failed. Our word needs three things in order: a break of the box standing at New York's open, a push past London's extreme, and a close back inside the box.
That makes it narrower than the phrase, and easier to count. A New York turn with no new extreme is common, but it is not this. For the London vs New York session in full, see the hub, and for the read in more depth, our guide to the NY session reversal.
How often does New York reverse London?
On about one day in five when London's break is still standing, by this rule. We counted seven majors and gold on 15-minute candles from 6 April to 1 October 2026, without the rollover wick in the box. A push past London's extreme means by at least 3% of the average daily range. Of 1,030 market-days, London's break stood at New York's open on 458:
- 91 (20%): New York pushed past London's extreme, then closed back inside the box
- 173 (38%): New York closed back inside with no such push first
- 194 (42%): no New York candle closed back inside
So a new extreme proves little. New York went past London's extreme first on 269 days: on 91 it then closed back inside, and on 178 it never did. Nor is the turn always a big one. Of the 91, 19 closed through the box the other way by 17:00, as NZD/USD did.
This counts candles, not trades: no entry, stop, cost or filter, over 25 weeks and four days. A reversal seen afterwards is not a setup, and our own test of the setup as a mechanical rule did not make money.
What does a day with no New York Reversal look like?
It looks the same at first. On GBP/USD on Monday 27 July 2026 the 06:45 candle closed under the box at 1.33185, by a tenth of a pip, and London's low was 1.33093. New York pushed lower. At 09:30 it traded back to 1.33207, 2 pips into the box, and did not close there. By 13:30 price was at 1.32842: 34 pips under the box and 25 under London's low. This chart's box keeps the first candle's wick, about a pip lower.
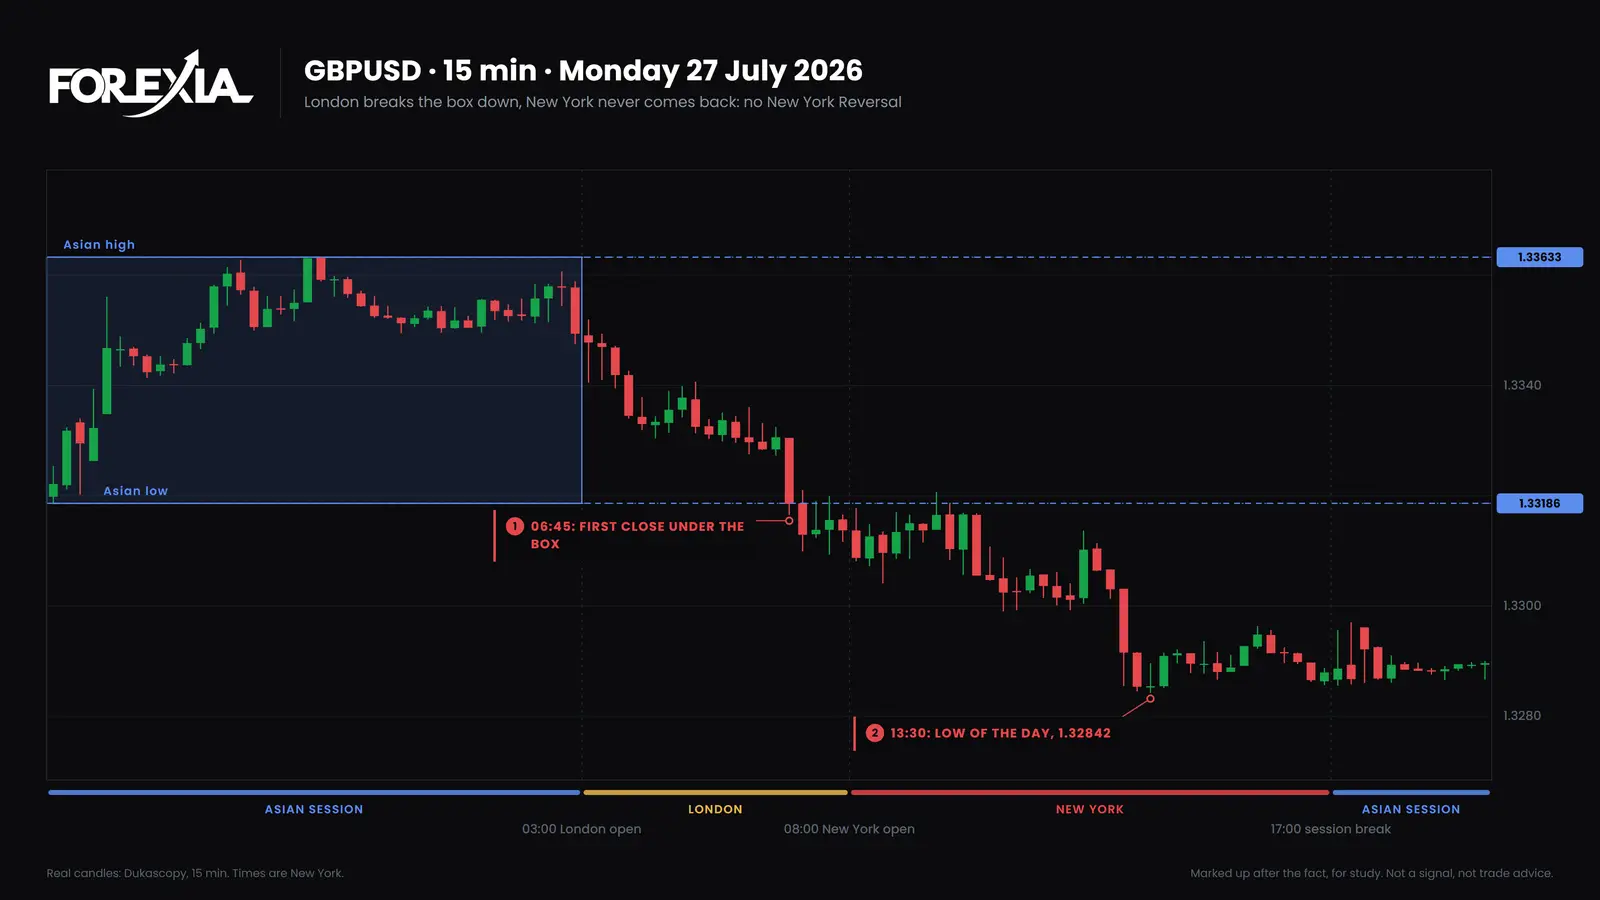
The crowd that sold London's break was right all day. New York does not owe anyone a turn.
How do you spot the New York Reversal?
Take NZD/USD and look at three moments. When New York opened, price was at 0.57808, still over the box. At 09:00 it printed the high of the day. At 11:00 a close came back inside, by a tenth of a pip. Before that close, the day looked no different from GBP/USD's.
What do traders get wrong about the New York Reversal?
Three readings cost the most.
- Joining London's move because it held all morning. On NZD/USD, the push at 09:00 was the high of the day.
- Expecting a turn because it is New York. On GBP/USD, New York only carried on.
- Calling the second top early. At 09:00 it was a new high and nothing more, and on 178 days in our count a new extreme was never undone.
Which words does the New York Reversal lead into?
Three sit next to it.
- The Chaos Pattern: the daily cycle this is the third phase of.
- The Close Back: the spike that closes back inside the level it pushed through.
- News-Induced Liquidity: the extra orders a scheduled release brings in at one known minute.
Where is the New York Reversal taught?
Course 2 of ForexiaPRO, The Chaos Pattern, teaches this read step by step in lesson 2.4.1, The New York Reversal.
Related words
Frequently asked questions
What is the New York reversal in forex?
It is the dealer moving in the opposite direction of the London breakout during the New York session. In Forexia's reading, London breaks the Asian range and holds outside it, New York runs past London's extreme, and price closes back inside the range the same day. Who is behind it cannot be seen. The shape can.
How often does New York reverse London?
On seven majors and gold from 6 April to 1 October 2026, London's break was still standing at New York's open on 458 market-days. New York went past London's extreme and then closed back inside the Asian Box on 91 of them (20%). It closed back inside with no new extreme on 173 (38%), and not at all on 194 (42%).
Is a new high in New York a sign of the reversal?
No. In the same count New York went past London's extreme, with the break still standing, on 269 days. On 91 it then closed back inside the box. On 178 it never did. The reversal is only known after the close back, and even then it may stop short.
Can you trade the New York reversal as a rule?
Not on what this page shows. A reversal seen afterwards is not a setup, these are counts of candles and not trades, and Forexia's own test of the setup as a mechanical rule did not make money.