
The High and Low of the Day: the First Pool the Second Leg Hunts
The High and Low of the Day are the first pool the second leg hunts: the furthest points price has reached so far that day, with the crowd's stops resting just past them. Most traders use the phrase for the day's final extremes, known at the close. Ours is the live version, because a stop can only rest past a level that already exists.
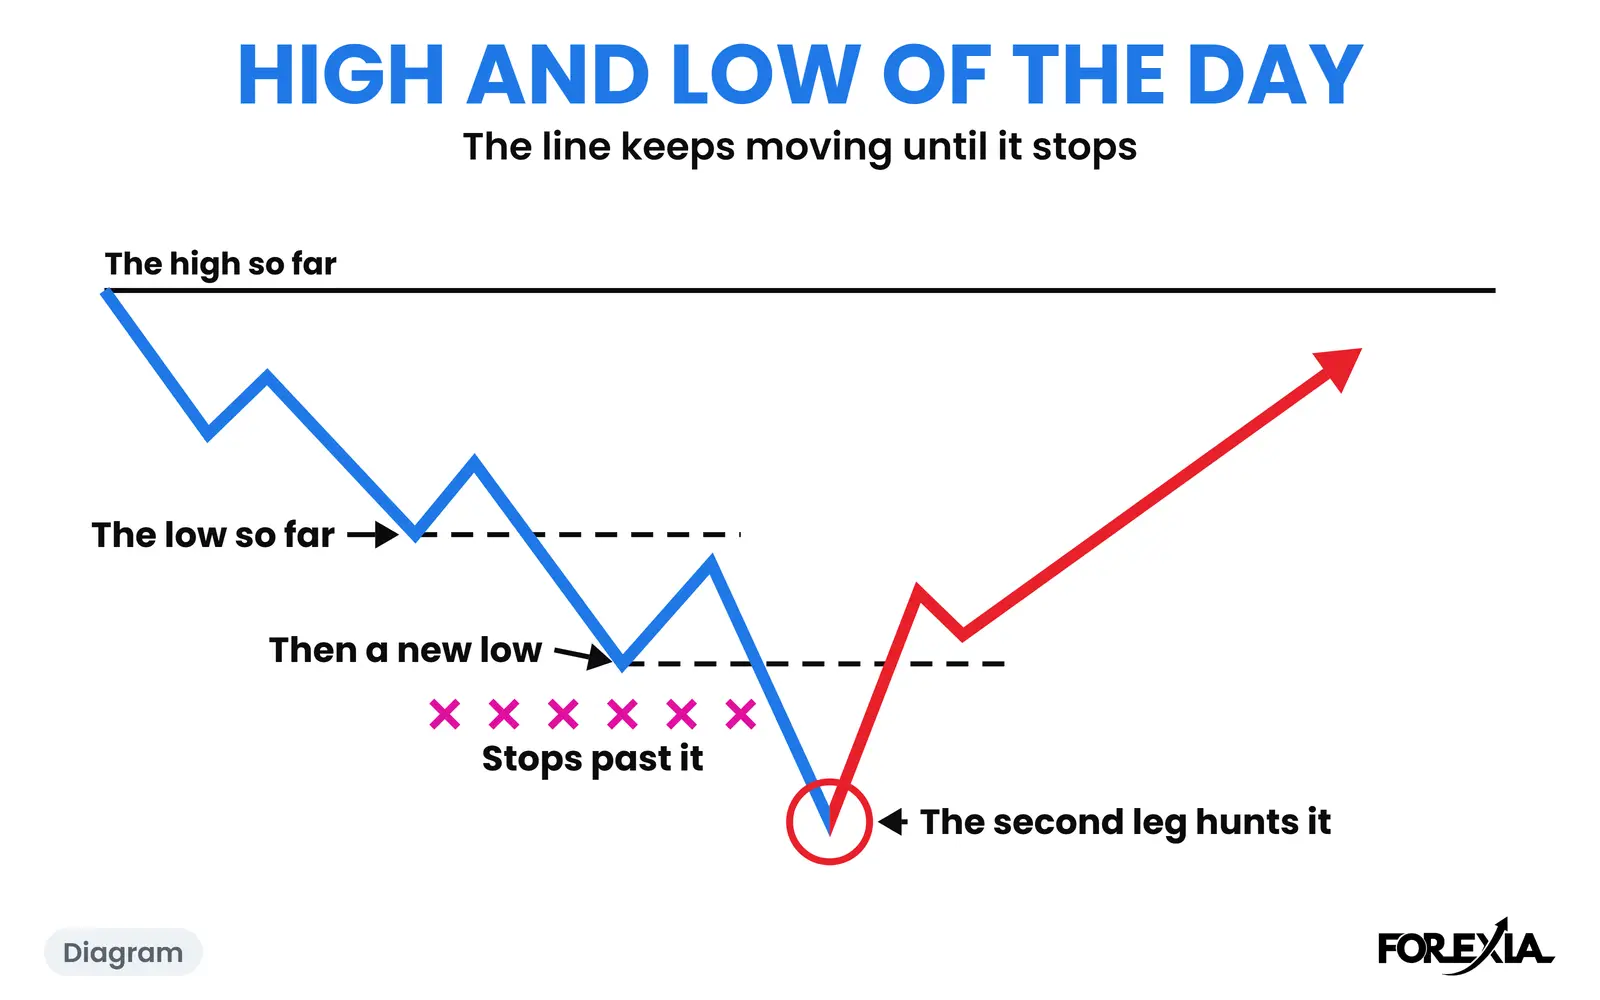
What does the High and Low of the Day look like on a chart?
It looks like a line that keeps moving until it stops. On gold on Tuesday 22 September 2026, the Asian Box ran from 4314.95 to 4375.67: 61 pips, where we count $1 as 1 pip. London's first leg broke it and reached 4299.31 at 03:45 New York, 16 pips under the box. That was the new low of the day, and the breakdown the crowd sells. We read stops and fresh breakdown orders resting just under it.
The 04:00 candle bounced to a neck at 4311.95. The low of the day edged down to 4297.90 by 04:15. Then the 04:30 candle ran to 4291.24, 8 pips past the first leg, and closed at 4319.97, back over the first leg and back inside the box. By 15:30 price was at 4370.95, 80 pips off that low.
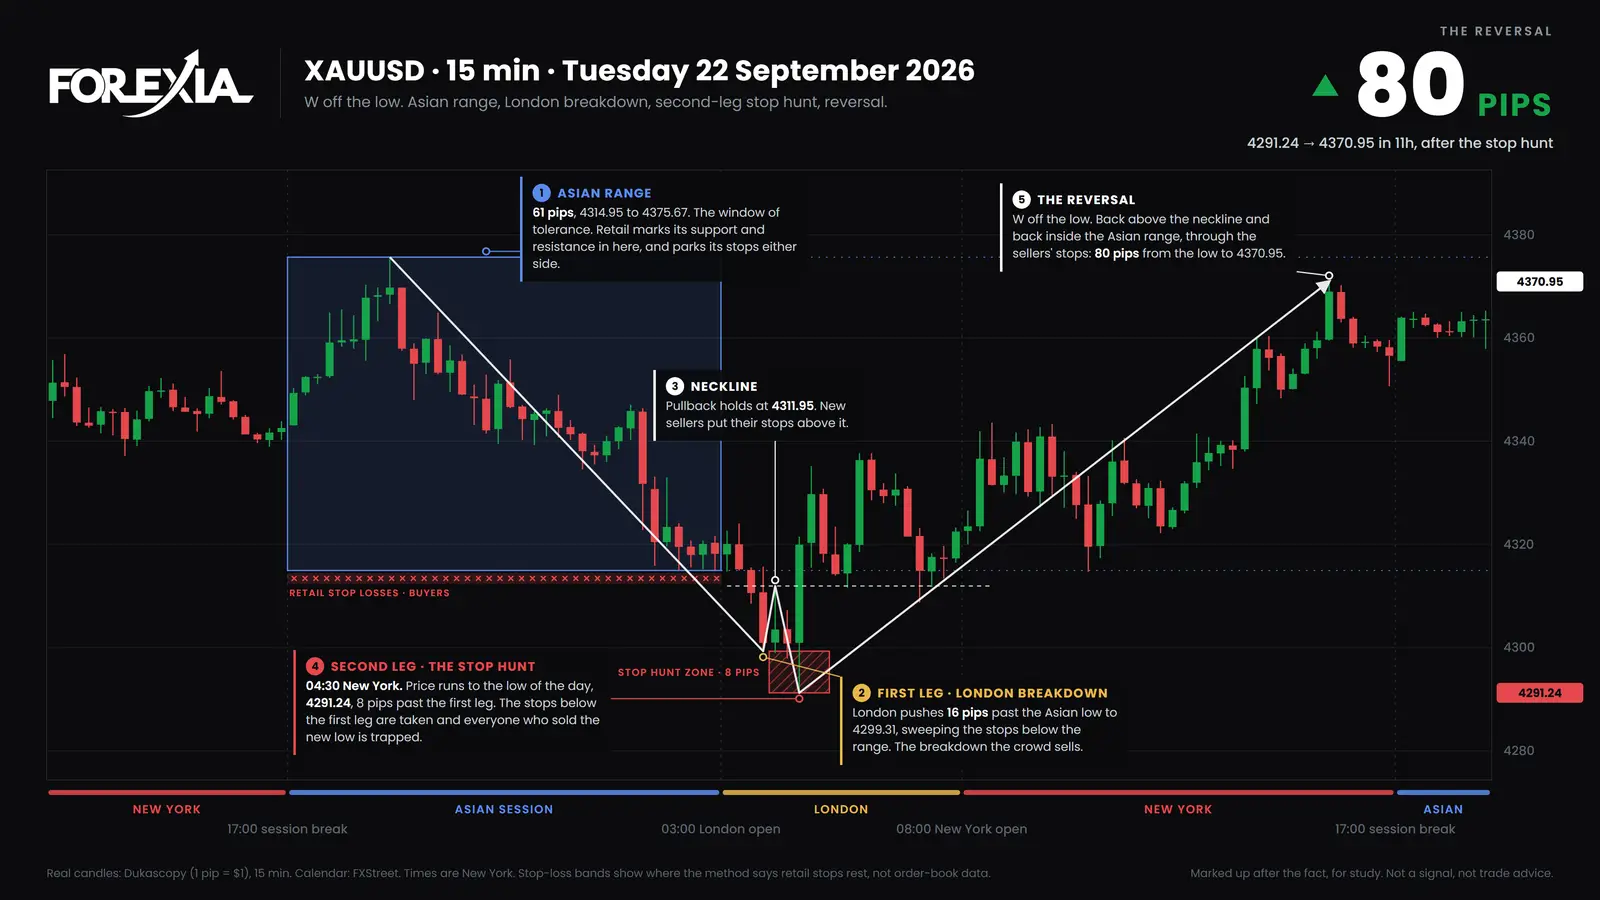
That day's shape is a W off the low, one of M & W Reversals. The second leg is what we call the Second Leg Climax. We read the first push as leaving stops beyond its extreme, and the second as running them. The turn on that candle is what happened, and why it happened is our reading.
The High and Low of the Day in forex: two meanings
The phrase means two things, and most confusion comes from mixing them. The usual meaning is the day's final high and low, the top and bottom of a daily candle. Those are fixed at the close, so as one forum reply puts it, you cannot know them until the day is over. Our meaning is the extreme so far: a real price on the chart right now, with real orders we read past it.
On 22 September both meanings ended up at the same low, 4291.24. At 04:15 they had not. The low of the day was 4297.90 then, and nothing on the chart said it would move.
The day also depends on where you draw it. We run it from the 17:00 New York session break to the next one, and forex has no single official close. A chart with a different day boundary can show another high or low for the same date. The first candle after the break can also print a wick that is only the spread widening, so compare a low made there with a second chart.
Session highs and lows are close cousins. On that gold chart the high of the day, 4375.67, came in Asia, so it was also the top of the box.
How do you spot the High and Low of the Day?
You watch London leave the box. The box's edges are the first pools of the day. When London's first leg goes through one, its furthest point becomes the new high or low of the day, and the next group of stops sits just past it. Price comes back toward the box. If a second leg goes out again, it runs past that newest extreme, not the box edge already behind it.
Not every day has two legs. Plenty of days make one push and turn, a plain stop hunt of the box, and some never turn at all. What the second leg is goes into that shape, and the Asian range liquidity sweep into the box's edges. Both sit under the wider idea of a liquidity sweep.
What do traders get wrong about the High and Low of the Day?
Three readings cost the most.
- The first leg is the hunt. On 22 September the first leg broke the box by 16 pips, and the second went 8 further. The crowd sells the first leg's break, and that is who the second leg catches.
- The low of the day is a floor. It is the low of one day. Gold was at 4243.93 by 06:30 on Thursday, 47 pips under that low. M and W days on gold has more of them.
- A second leg means a turn. It does not. A reversal seen afterwards is not a setup, and our own test of this setup as a mechanical rule did not make money.
Which words does the High and Low of the Day lead into?
Four sit next to it.
- Second Leg Climax: the volatile second leg that hunts the high or low of the day and confirms the M or W.
- M & W Reversals: an M off the highs or a W off the lows.
- Liquidity Mapping: marking the pools of stops on the chart before the session.
- The London Breakout: the move out of the Asian range at the London open, where retail enters for the continuation.
Where is the High and Low of the Day taught?
Course 1 of ForexiaPRO, Reading the Map, teaches this read step by step in lesson 1.2.2, The Daily Pools: the Asian Box and the High and Low of the Day.
Related words
Frequently asked questions
What is the high and low of the day in forex?
In most forex talk it is the highest and lowest price of the trading day, known once the day is over. In Forexia's sense it is the extreme as it stands now: the furthest price reached so far, with the crowd's stops resting just past it. That is the first pool a second leg hunts.
When does the forex day start, for the high and low of the day?
We count the trading day from the 17:00 New York session break to the next one. Forex has no single official close, so a chart set to another day boundary can show a different high or low for the same date. Check how yours draws the day.
Can you know the high or low of the day before the day ends?
No. You know the extreme so far. On gold on 22 September 2026 the low of the day stood at 4297.90 at 04:15 New York and at 4291.24 fifteen minutes later. It held from there, but only the rest of the day could show that.
Is the high of the day the same as the previous day's high?
No. The previous day's high is fixed once that day has closed, and it can be marked before the session. Today's high and low keep moving, so they are marked as London makes them.