Liquidity Sweep Backtest: What We Found When the Hunt Kept Going, and Why Our Own Test Did Not Make Money
Dylan Forexia8 min read
Our liquidity sweep backtest lost money. We ran the trade against the hunt as a fixed rule on seven dollar majors and gold, and every year from 2021 to 2026 lost after costs, between -0.10R and -0.23R a trade. Hunts that keep going are a large part of why, and three real days below show what that looks like.
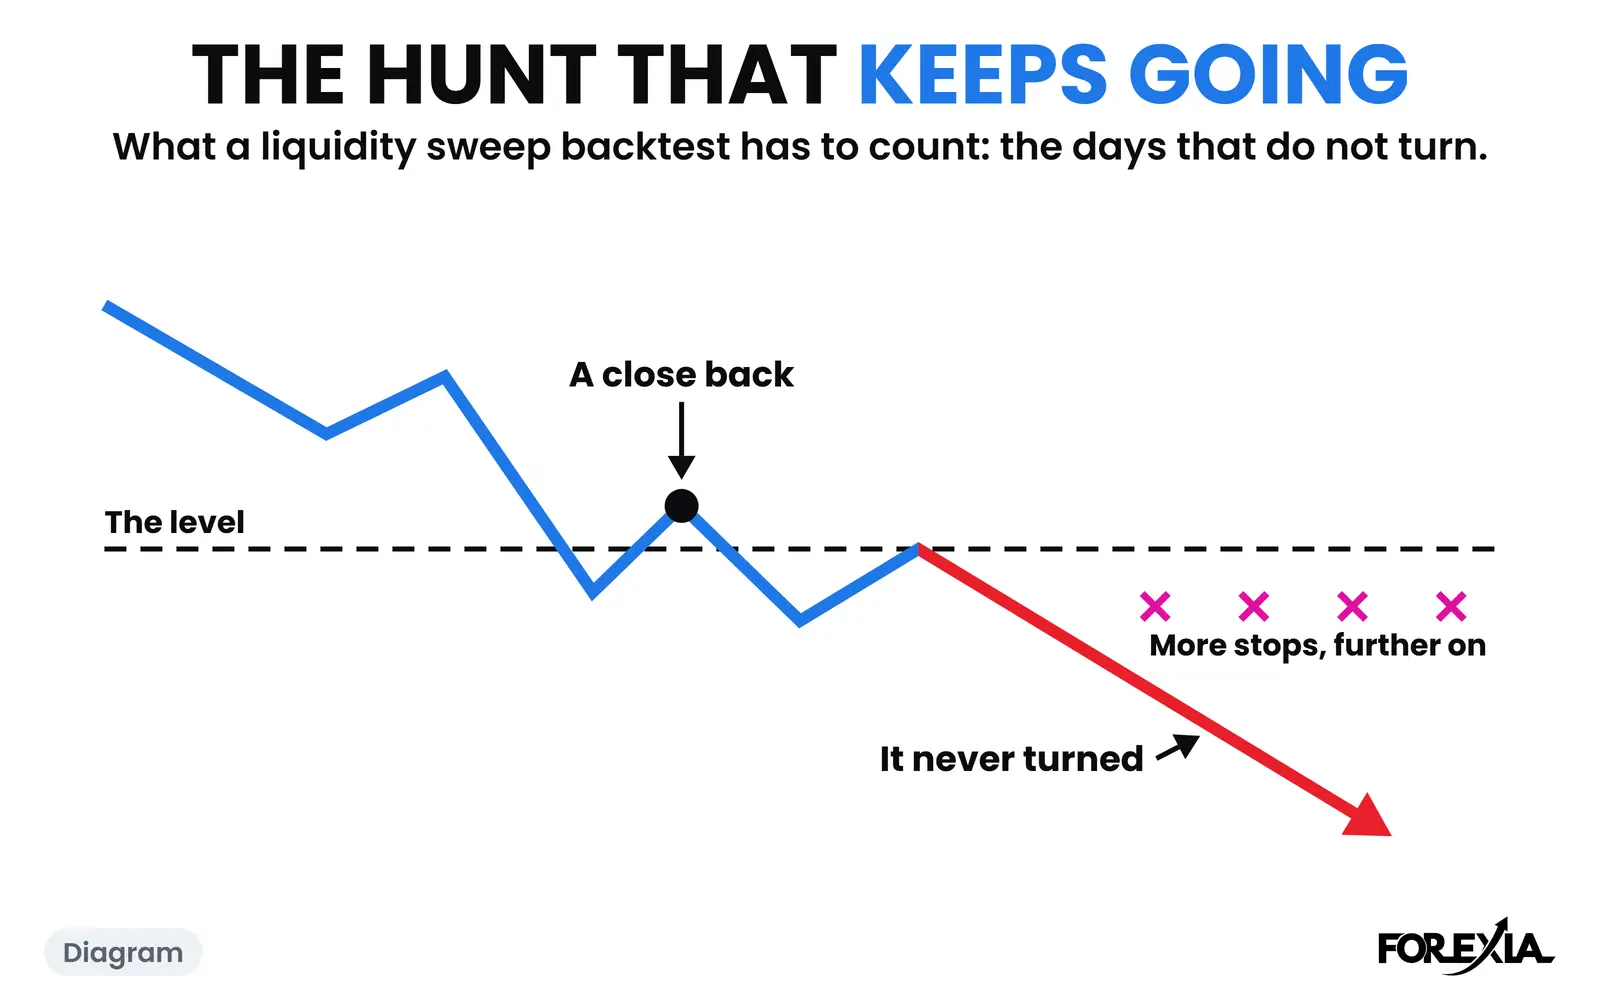
R is the amount risked on one trade, so -0.25R means losing a quarter of your risk on average. The stop hunt is our word for what most traders call a liquidity sweep. Our stop hunt guide has the summary and the full study has the method. This page is about the part charts leave out: what happens when the hunt does not turn.
What did our liquidity sweep backtest find?
It found that the setup, traded by a program with no judgement, does not pay. The sample was Dukascopy 5-minute candles with real bid and ask, about 430,000 per market, from 3 January 2021 to 2 October 2026. Costs were the real spread on every bar plus 0.7 to 0.8 pips a round trip for commission and slippage ($0.15 on gold). A program flagged each hunt as it happened, using only the candles printed so far, and traded against it the same way each time, with no opinion about the day.
| What was run | Result per trade |
|---|---|
| Every year, 2021 to 2026, about 2,200 trades a year | -0.10R to -0.23R |
| Six test months opened once at the end, 1,981 trades | -0.25R |
| Those months, on days never marked up, 1,634 trades | -0.57R |
| Training years with no costs at all | -0.03R |
| Training years with the spread | -0.10R |
| Training years with spread and commission | -0.16R |
| A stop about eight times wider | -0.08R |
| Other targets, breakeven and partials | -0.14R to -0.23R |
The no-cost line matters most. A loss of -0.03R is zero, so the loss is not a good idea eaten by costs. Under the costs there is nothing to eat. After 18,884 flagged hunts in the training years, price had moved -0.2% of an average day's range the trade's way after one hour and -0.5% by 17:00. A hunt on its own has no lean.
Filters did not rescue it. Every slice lost after costs: M or W against a plain hunt, London against New York, each weekday, each market, news or none, clear Asian range or not. Pending limit orders past the levels fared no better, with 0 of 108 variants making money in the training years. Parameter sets that looked good in one period failed in the next. A held-back period, 2015 to 2020, agrees. A wider stop lost less only because costs shrink against a larger risk.
Why do charts look so much better than that? Because we only mark up a day after price has reversed. The trigger cannot know which day it is on.
Where did the stops go?
Many of them went to hunts that kept going. In one fixed version of the rule, on 8,931 trades from 2021 to 2024, the study split every trade by what happened. Here are the ones that hit their stop.
| What happened after the stop | Lost |
|---|---|
| The day kept going: a real breakout | -2,012R |
| Too early: price turned later, from a further extreme | -1,468R |
| Price then went nowhere | -777R |
So nearly half the stop-outs were real breakouts, and only about one in three was the kind everybody remembers, where price turned later without you. After a stop-out, price went a median of 0.23 of an average day past the stop. Across the training years, the extreme that set off the rule had been passed by 17:00 about three times in five.
Our candle count points the same way. On 15-minute candles from 6 April to 1 October 2026, on the same eight markets, 291 of 1,601 levels taken had not closed back by the end of the day. After 825 of the 1,310 that did close back, price traded past the wick again the same day. That counts candles, not trades.
Day one: no close back at all
EUR/USD on Wednesday 29 July 2026 hunted one side and then broke the other. Times are New York. The morning's hunt was the low: 1.13744 at 08:15, 8 pips under the Asian range. Tuesday's high sat at 1.14052, just over the range top of 1.14036, and the Fed's decision was due at 14:00.
That candle ran to 1.14306 and closed at 1.14276, 22 pips over Tuesday's high. Sellers of that high lost their stops and, on a day that turned, this is where the close back would come. It never did. The press conference candle at 14:30 dipped to 1.14067, a pip and a half over the level, and closed at 1.14353. By 16:45 price was at 1.14709, 66 pips over.
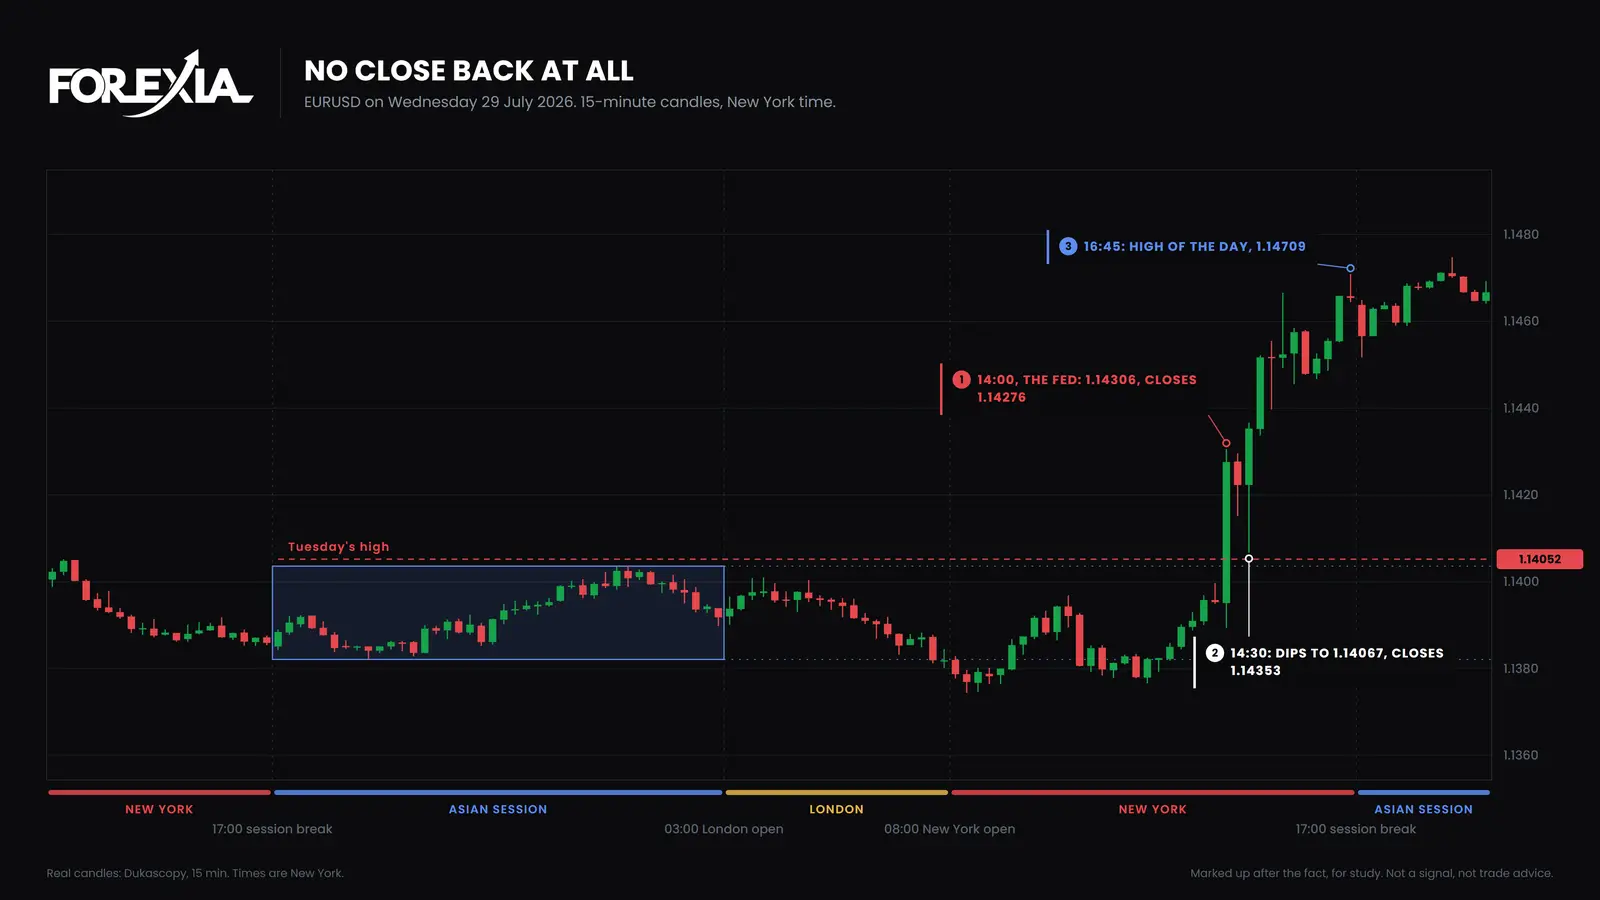
It was a breakout, and the buyers were right. Looking back, the day's hunt had already been the low, the Fed's candle closed 3 pips from its high, and the dip at 14:30 held over the level. The read knew the Fed was on the calendar, not what it would say.
Day two: a close back that lasted one candle
Gold on Thursday 24 September 2026 looked like a W, and our stop hunt guide has the outline. On gold $1 counts as 1 pip. Only medium-impact items were due. London broke the bottom of a 30-pip Asian range at 04:15, to 4261.99, and pulled back to 4273.60. At 05:00 a candle ran to 4258.57 and closed at 4262.88, under a dollar back over that low.
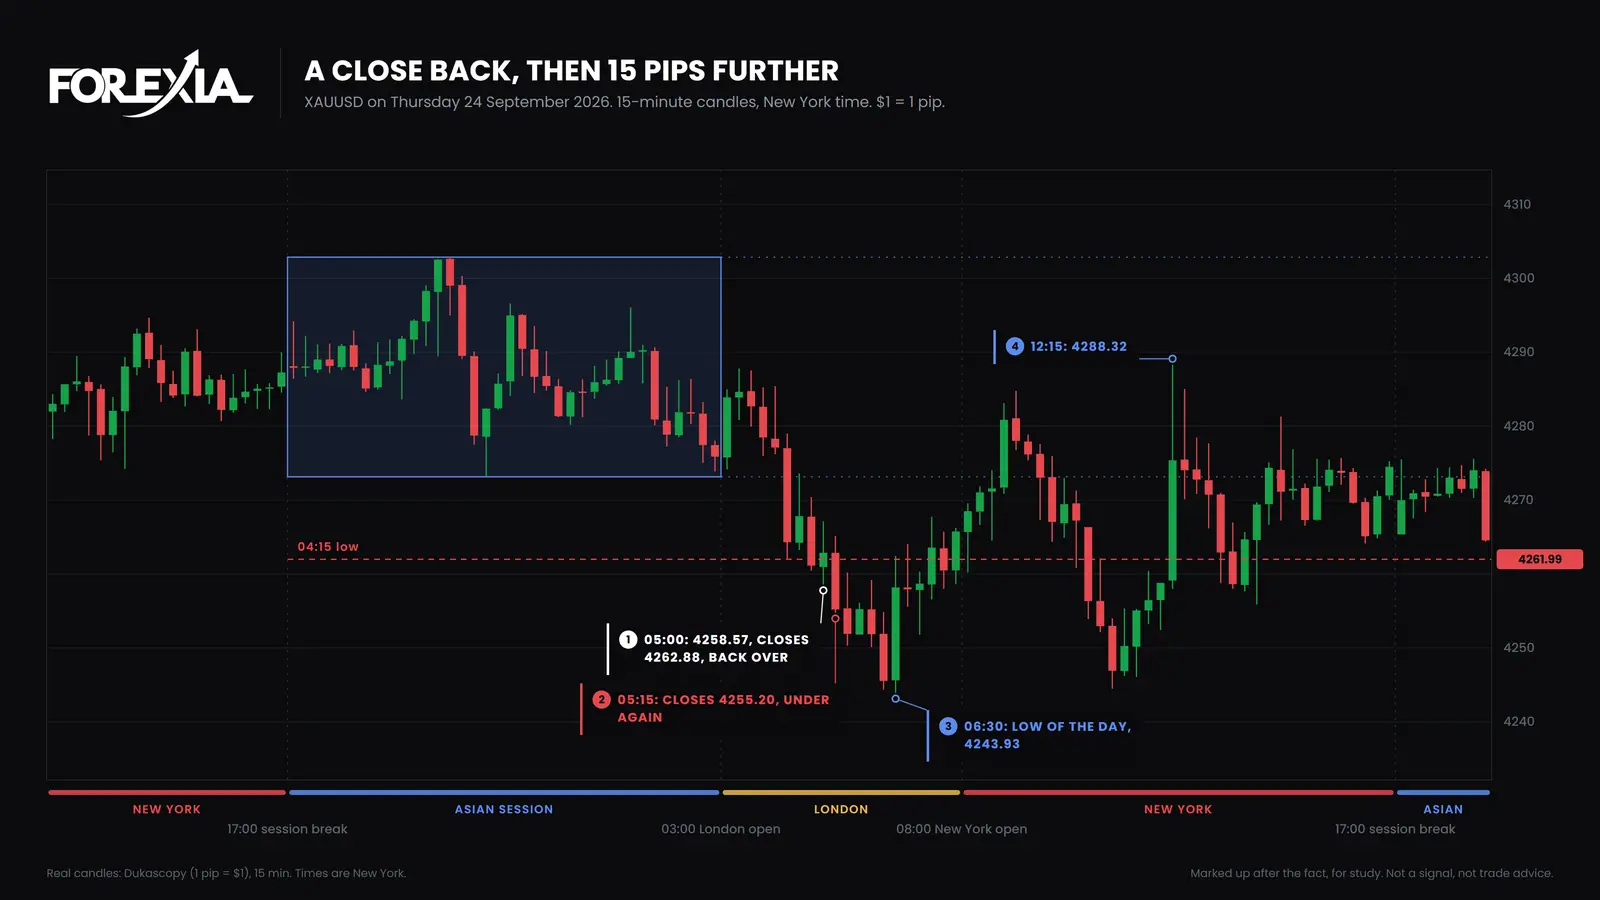
The very next candle closed at 4255.20. By 06:30 price was at 4243.93, 18 pips past the first low. It did rally, 44 pips to 4288.32 by 12:15, and it ended near 4274.
So anyone who took that close back as the end was early. Looking back, the 04:45 candle had already closed under that first low, at 4261.15, and the highs after 04:15 kept getting lower: 4273.60, 4267.15, 4265.15, 4260.19.
Day three: a close back that worked for two hours
GBP/USD on Tuesday 29 September 2026 is the hardest kind. Asia ran 1.32295 to 1.32576 and drifted down. Monday's low sat under it at 1.32223. Only medium-impact items were due, and none before 10:00. At 06:00 price went to 1.32208, a pip and a half past Monday's low, and closed at 1.32243, back over. We read that as a clean liquidity sweep.
For two hours it looked like one. By 08:00 price was at 1.32523, 32 pips off the wick. Then the 08:15 and 08:30 candles, two of the morning's largest, closed back down, and the 08:45 candle closed at 1.32239, right where it began. At 09:30 price went to 1.32174, past the wick. At 11:15 it was at 1.32020, the low of the day, 19 pips past it.
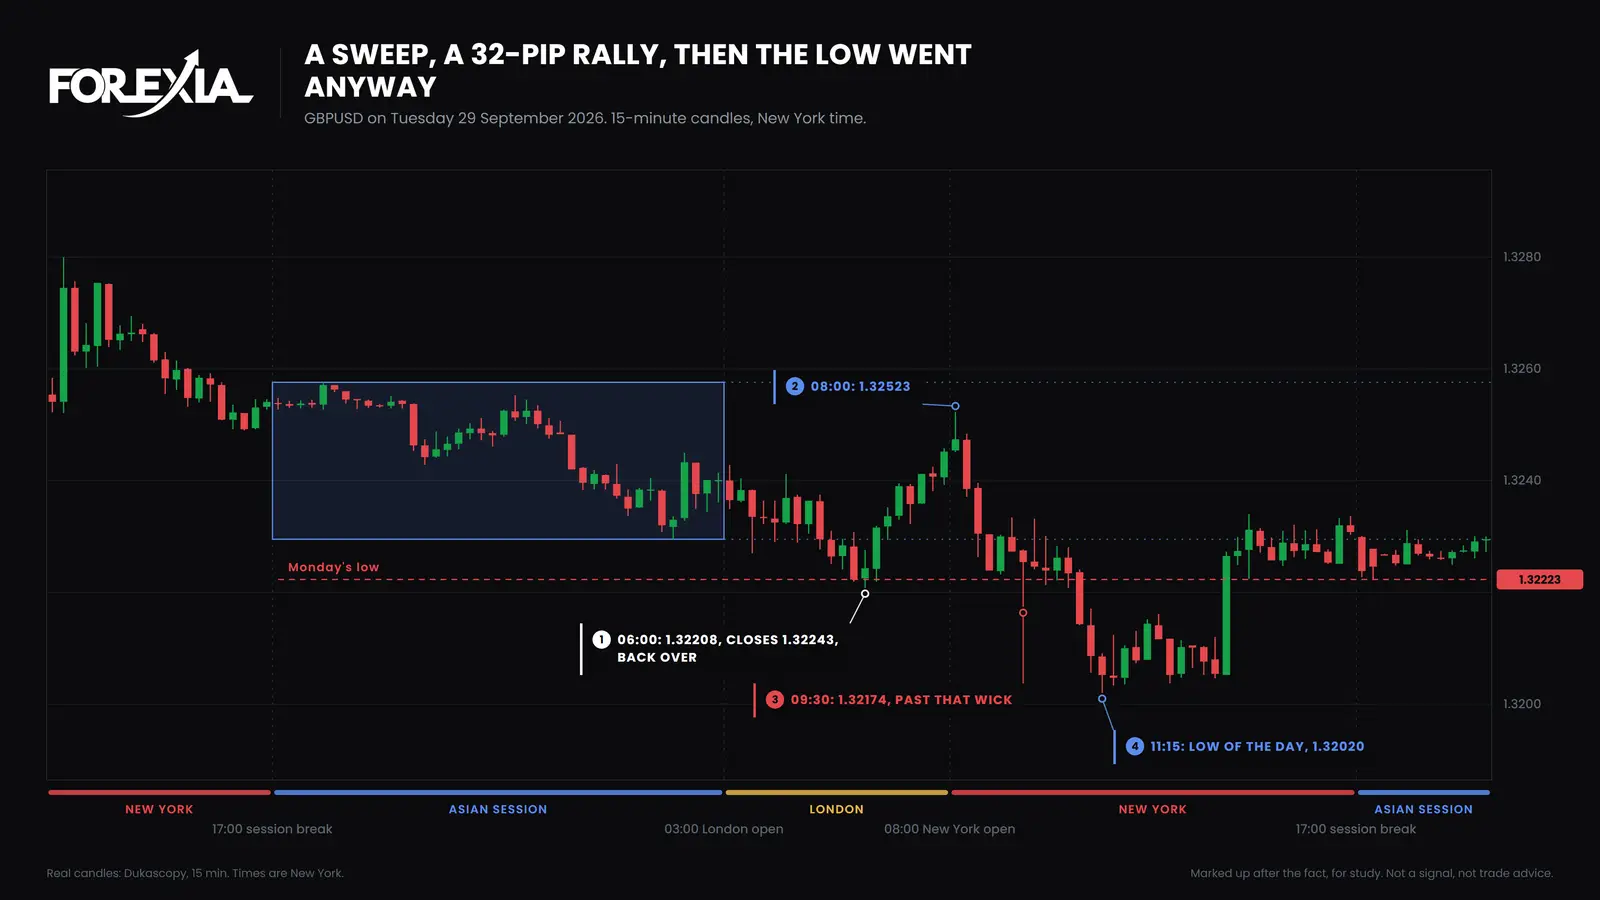
Price then recovered to end at 1.32308, back over Monday's low, so a finished chart looks untidy and not disastrous. Looking back, the rally stalled at 08:00, and the next three candles took it all back.
Could you have seen any of this coming?
Not in any way we can show. Those details are easy to name on these days because we know how each ended. We have not counted them, and no filter we tested turned the setup into a profit.
From the three seats: retail takes a stop as proof the method is broken, or moves it. The market maker's seat, as we read it, sees more orders further on. The observer expects it, because nothing about the close back ever promised otherwise.
What does this test not prove?
Several things, and they matter.
- It says nothing either way about a person reading the chart. It sets a bar: to break even, picking trades by reading the chart would need to find nearly twice as many good trades as the rule did. Nothing we tested in the candles or the calendar closed that gap.
- It does not say hunts are real or imaginary. The program reads candles and a calendar. It cannot see order flow.
- It is one rule we wrote, on past prices, with one data source. Other brokers' spreads differ, and real fills during a release are worse.
The way to find out whether your read beats the rule is a log: every setup you see, taken or skipped, and why. How a liquidity grab differs from a breakout covers the close back itself, and Reverse Price Action is the read behind all of this. More of the research is on the research page.
Common mistakes
All three come from wanting a hunt to mean more than it does.
- Assuming every hunt comes back. On the euro, no close came back under Tuesday's high after the Fed's candle.
- Treating a good first two hours as the result. On the pound, a 32-pip rally ended under where it began.
- Trusting a backtest that names no costs. With none, our rule looked like zero. With them, it lost.
Course 3 of ForexiaPRO, Reverse Price Action, teaches this read step by step in lesson 3.3.4, When Reverse Price Action Fails: the Hunt That Keeps Going.
Frequently asked questions
Does a liquidity sweep strategy work in a backtest?
Ours did not. Run as a fixed rule on seven dollar majors and gold, every year from 2021 to 2026 lost after real spreads and costs, between -0.10R and -0.23R a trade on about 2,200 trades a year. With no costs at all it came to -0.03R, which is zero. It is one rule we wrote, on past prices, and it does not judge a person reading the chart.
Why does a stop hunt keep going instead of reversing?
Because a hunt is only a move into orders, and there can be more orders further on. Sometimes the break is simply real. In one fixed version of our rule, nearly half the trades that hit their stop were on real breakouts, and about a third were stopped before a turn from further out.
Can you see that a hunt will keep going?
Not in any way we can show. On each of our three days something looks like a warning once you know the ending. We tested many filters on the rule as a whole, and none turned it into a profit.
What does R mean in a backtest?
R is the amount risked on one trade. A result of -0.25R a trade means losing a quarter of that risk on average, per trade, before any question of how large that risk was.