Liquidity Grab vs Breakout: How the Close Back Separates a Sweep from a Real Move
Dylan Forexia8 min read
A liquidity grab trades past a level and closes back on the side it came from. A breakout closes beyond the level and stays there. On the first candle the two can look identical, so the close is what separates them, and even a close can change its answer later the same day. We call that candle the close back.
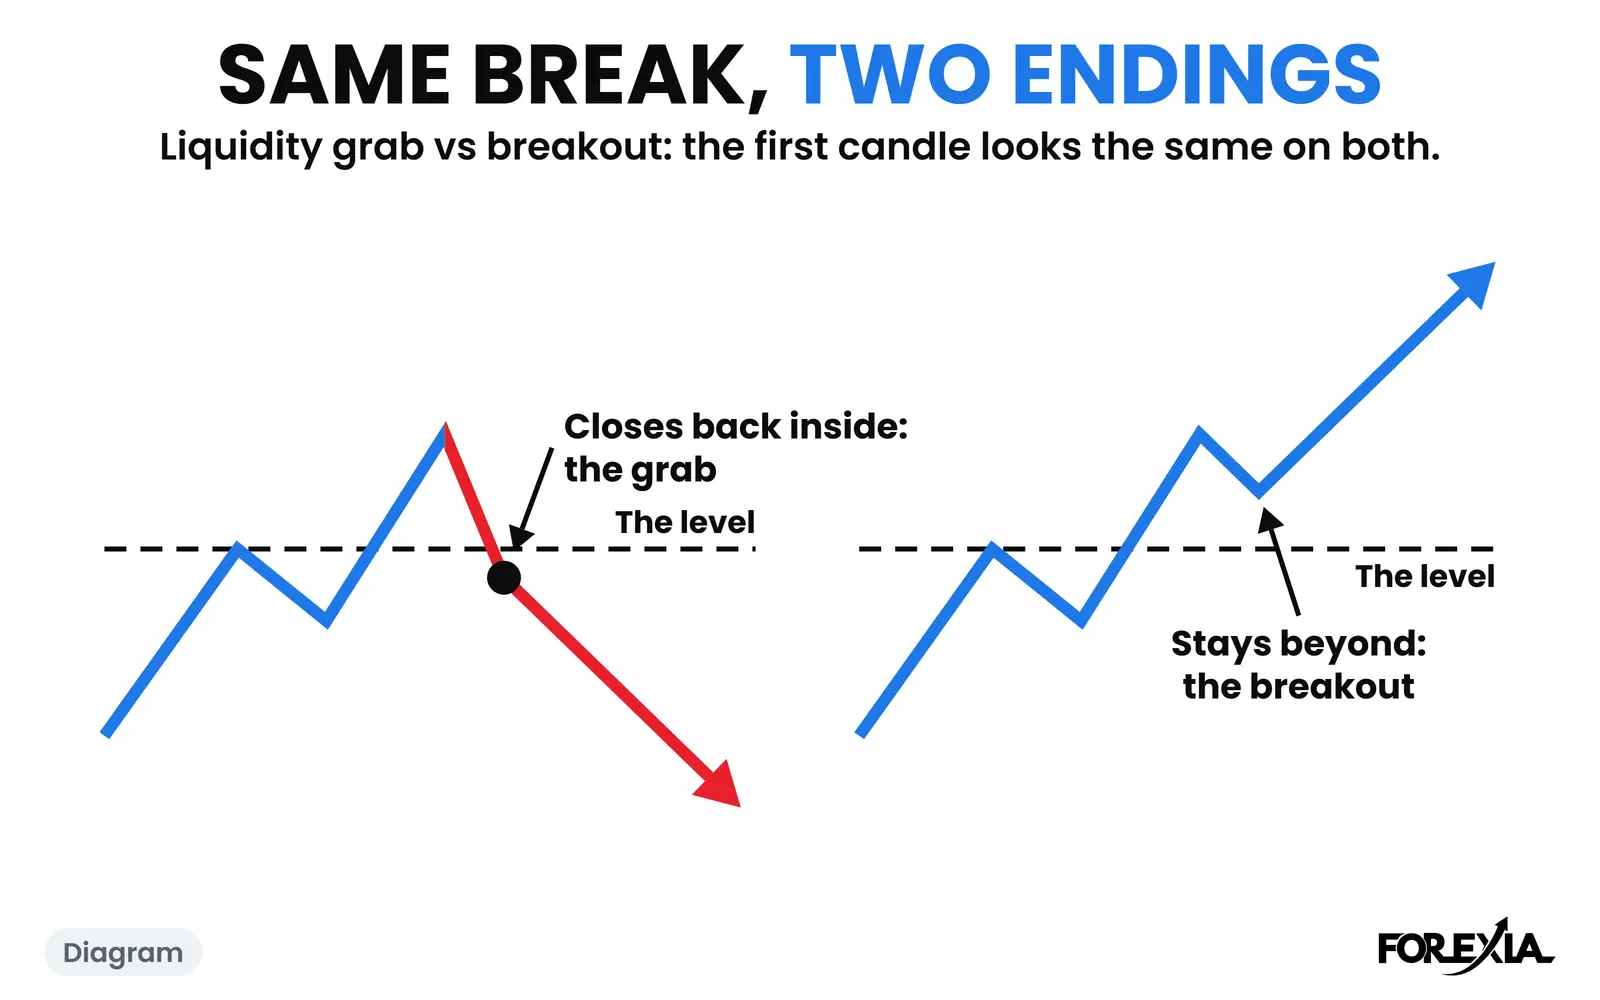
Most pages on this search draw the two side by side as neat schematics. This one shows them on real days, including the awkward ones where each looked like the other for an hour or two. Times are New York, candles are 15-minute Dukascopy, and your broker's feed may differ by a pip or so.
What is the difference between a liquidity grab and a breakout?
A liquidity grab is price going through a level where stops rest and failing to stay. Most traders use it interchangeably with a sweep, and our own word is the stop hunt. A breakout is price leaving a level because there is more business on the far side. The crowd's stops fire in both cases, so nothing about the first candle tells them apart.
| Liquidity grab | Breakout | |
|---|---|---|
| What it does to the level | Trades past it, closes back | Closes beyond it and stays |
| Who it hurts | Those who chased the break | Those who sold the level |
| Distance past the level, by day's end | In our count, a median of 9% of an average day | In our count, a median of 65% |
| Can you know on the first candle? | No | No |
That distance row is only known afterwards. A false break and a real break can start with the same few pips.
What does a liquidity grab look like on a real day?
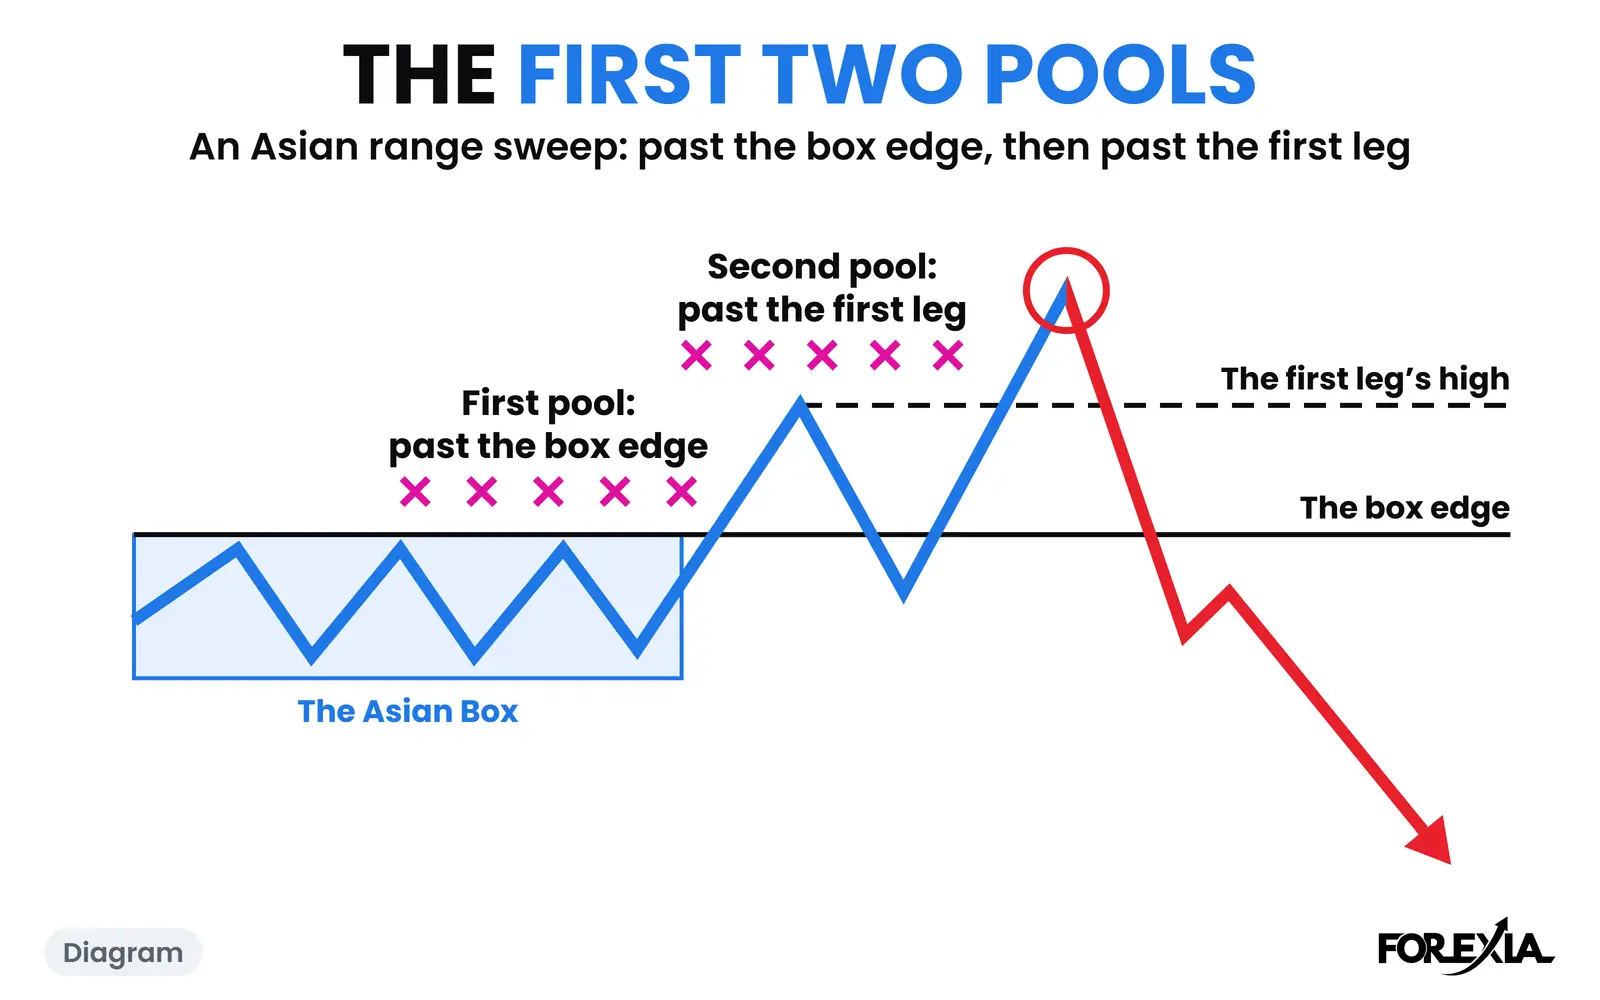
USD/CHF on Wednesday 15 July 2026 had a first high in London at 0.81123, printed at 06:15. It sat 16 pips over the Asian range and drew the breakout crowd. Sellers put their stops just over it. Price pulled back to 0.81043 at 07:00.
The 08:00 candle ran to 0.81141, 2 pips past that high, and closed at 0.81122, a tenth of a pip back under it. The 08:15 candle reached 0.81142 and closed at 0.81106, further back under. US producer prices came at 08:30, and that candle closed at 0.80952. By 14:30 price was 81 pips under the high, at 0.80335.
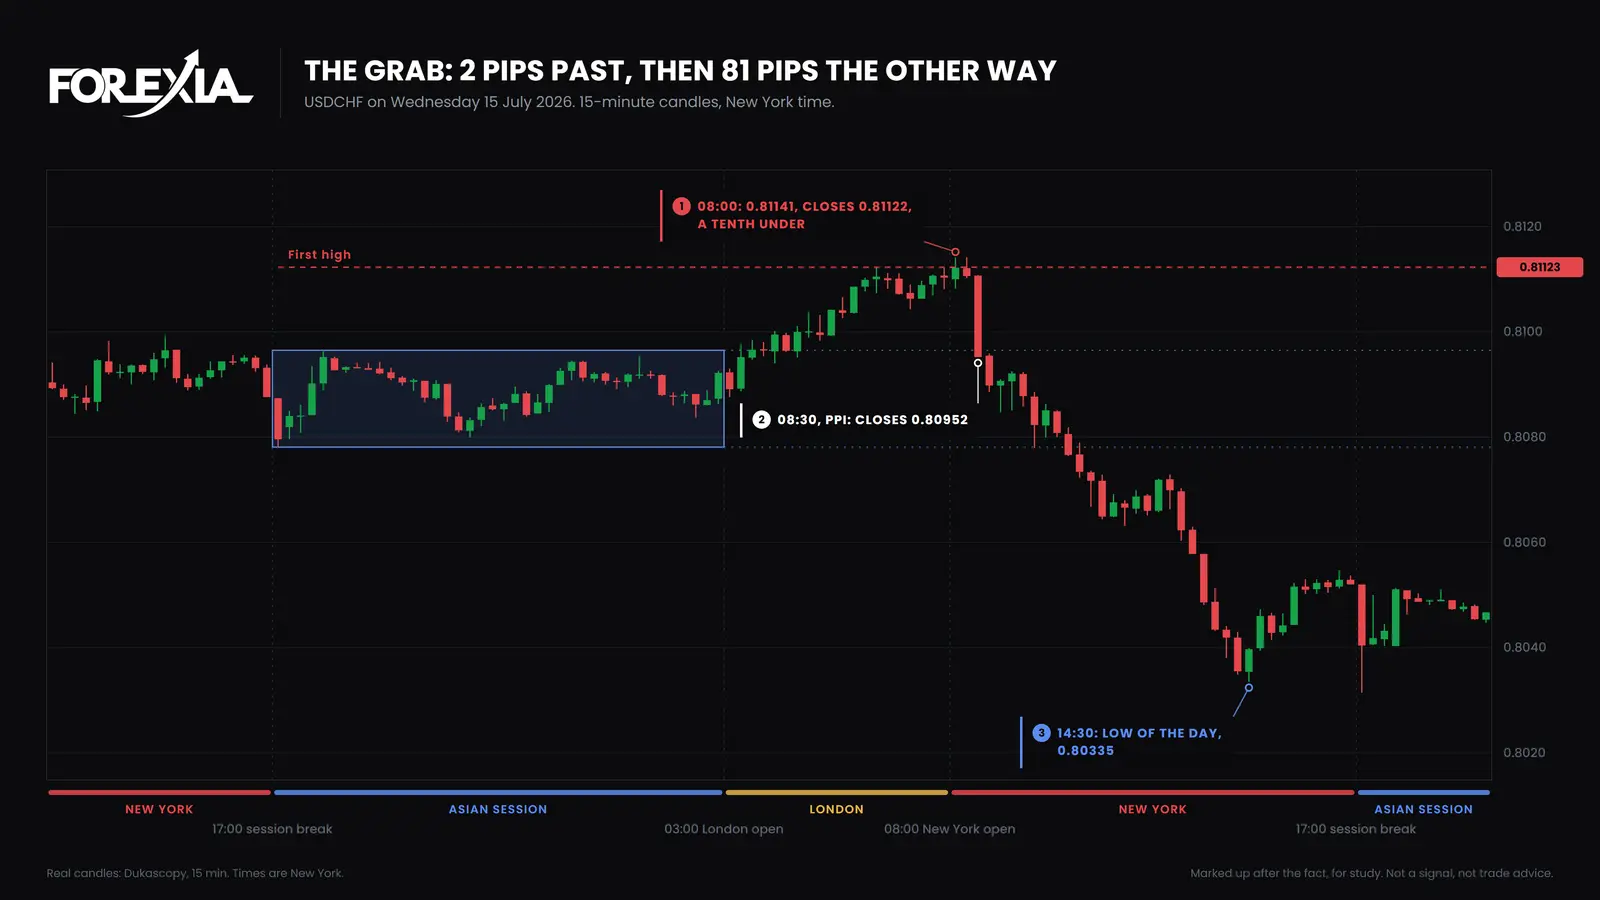
A tenth of a pip is nothing you could trust by itself, and a feed a pip away would disagree. It only looks decisive because you can see what came next. Keep that in mind on the next day.
What does a real breakout look like when it starts as a grab?
It looks like the same thing, on the same pair, five days later. USD/CHF on Monday 20 July 2026 had Friday's high at 0.80925 just above an Asian range of 0.80693 to 0.80908. Nothing medium or high-impact was on the calendar for the dollar or the franc all day.
At 08:15 price reached 0.80934, 1 pip past Friday's high, and closed at 0.80909, 2 pips back under. That is a close back, and on paper it is the same event as the Wednesday before. Sellers of Friday's high could look at that candle and feel they had read it. The next four candles agreed, with highs no better than 0.80930 and closes under the level each time.
At 09:30 the candle closed at 0.80955, 3 pips over the level. No later close that day came back under it. By 10:45 price was at 0.81076, 15 pips over, and it ended the day at 0.80977, still over.
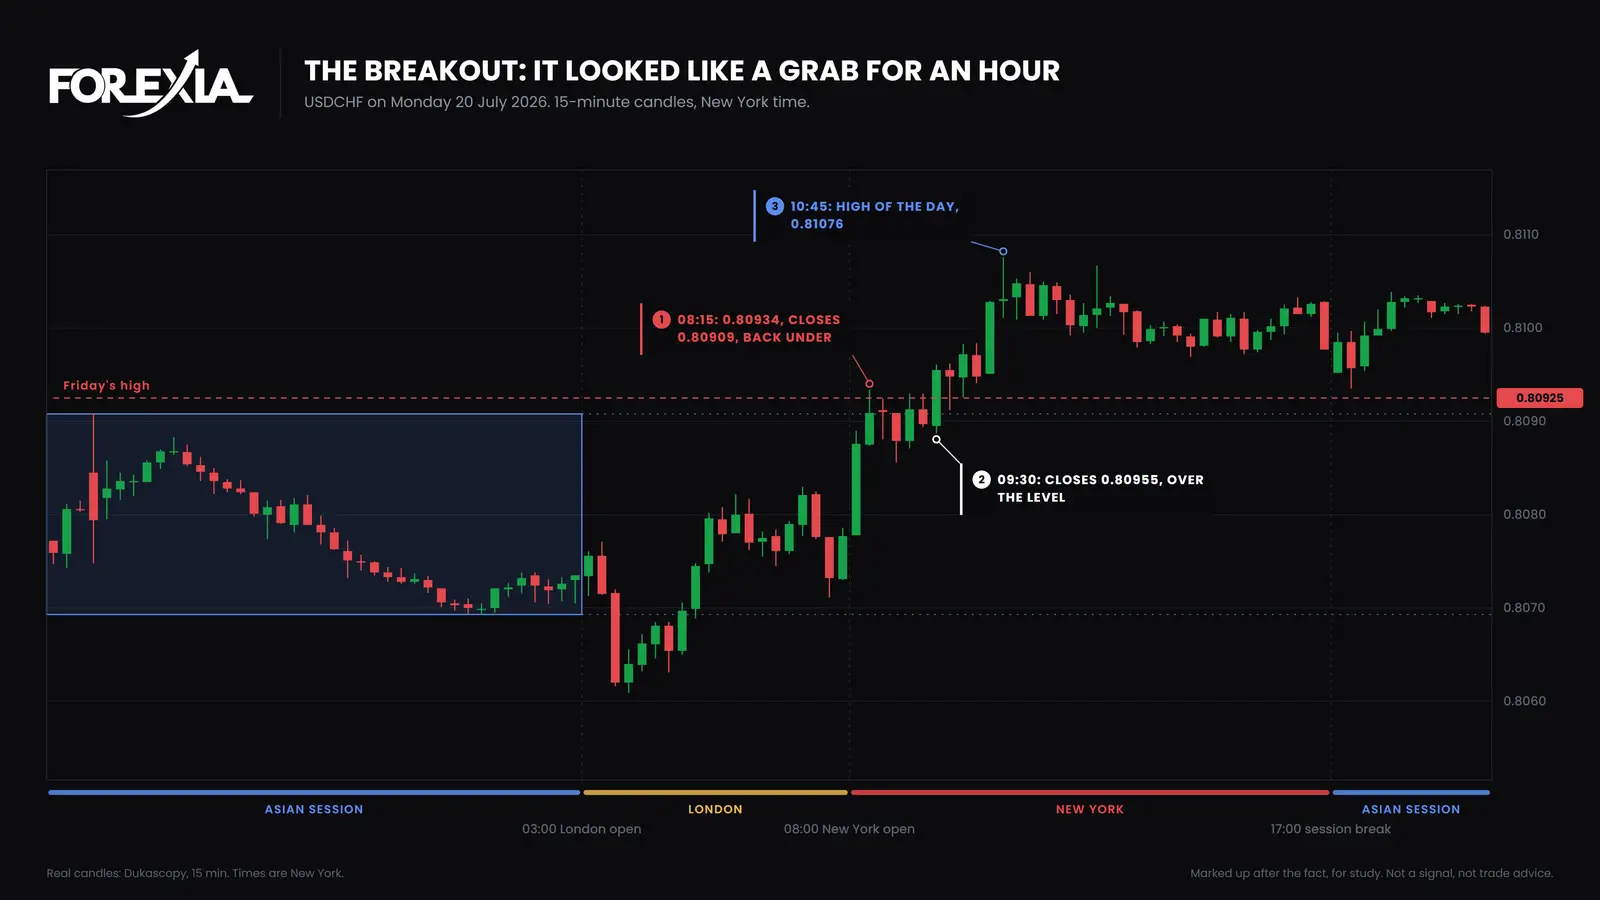
So a grab on Wednesday and a breakout on Monday both began with a pip or two and a close back. We can tell you which was which because we can see the rest of the chart. At the time, on Monday, a reader had a level, a close back, and a good story for the wrong side. Looking back there were hints: the day had already turned at London's low, 0.80609, and Asia had drifted down into it. Those are reads from the candles, easy to list afterwards, and we have not tested them.
Can it look like a breakout first and a grab later?
Yes, and that is the third case. USD/CAD on Wednesday 12 August 2026 sat just above Tuesday's low of 1.39147. US inflation came at 08:30, and that candle went to 1.39120 and closed at 1.39133, under the level. It looked like a break. The crowd sells a break like that. It kept looking like one: by 10:00 price was at 1.39074, 7 pips through.
The Close Back's own page goes through the wick and the failed close back on this day. For this question, look at the clock. The level was broken at 08:30. One close back at 09:00 failed, and the one that held came at 10:15, at 1.39149, by a fifth of a pip. From there price reached 1.39468 by 13:30, 39 pips off the low.
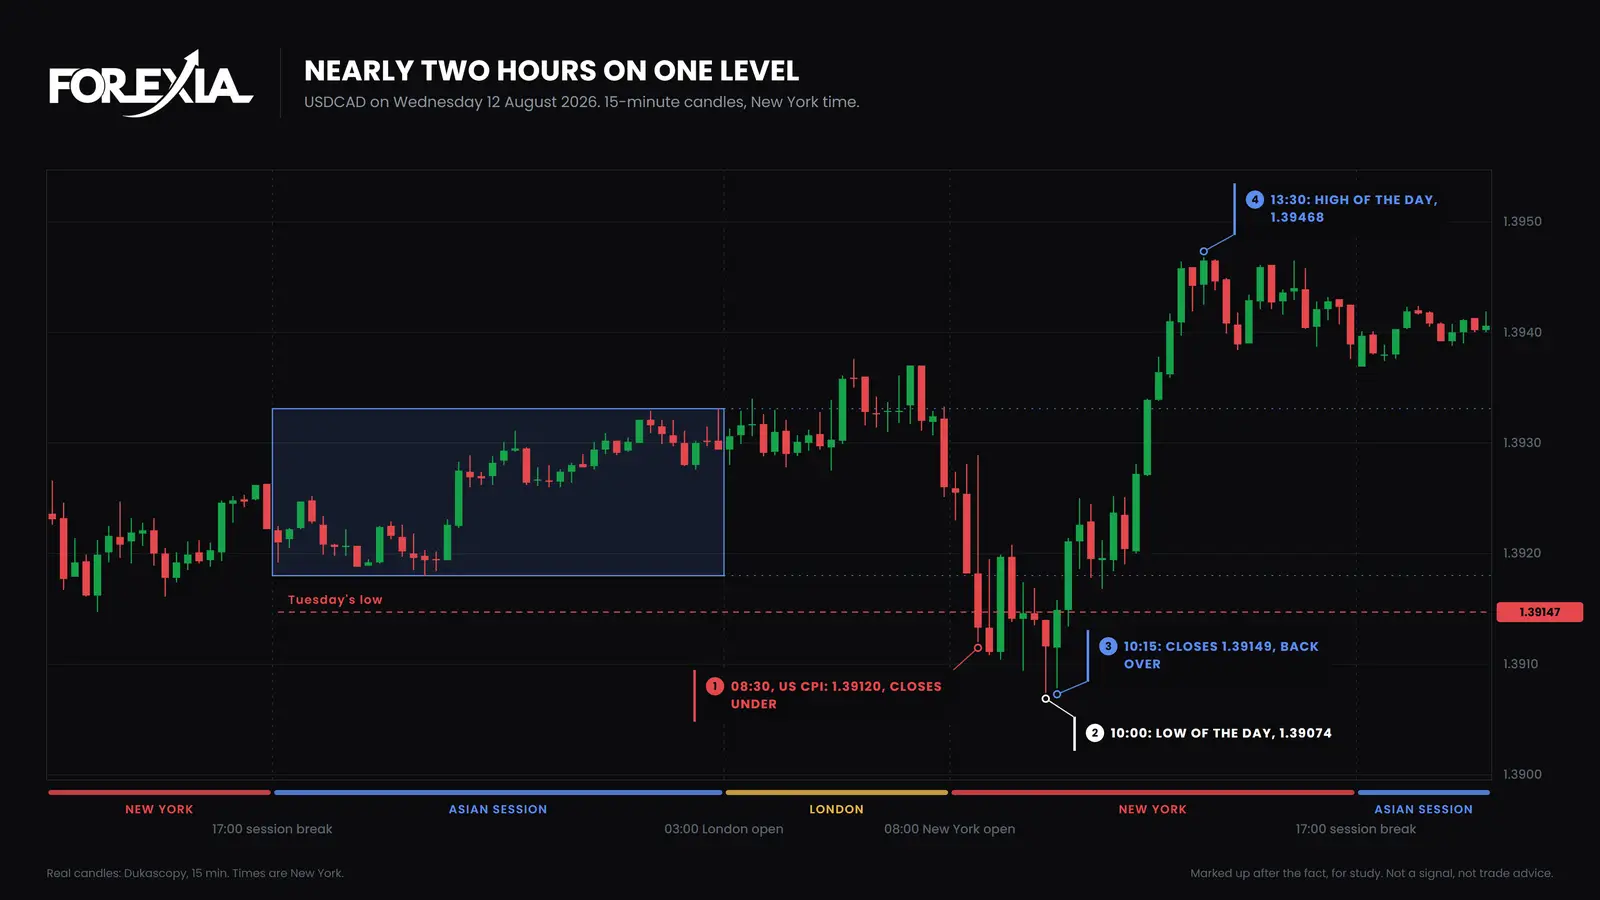
Nearly two hours of a breakout turned into a grab with one close. Anyone who sold at 08:30, and anyone who bought that spike, went through a very different morning from what the finished chart suggests.
How often does a taken level close back?
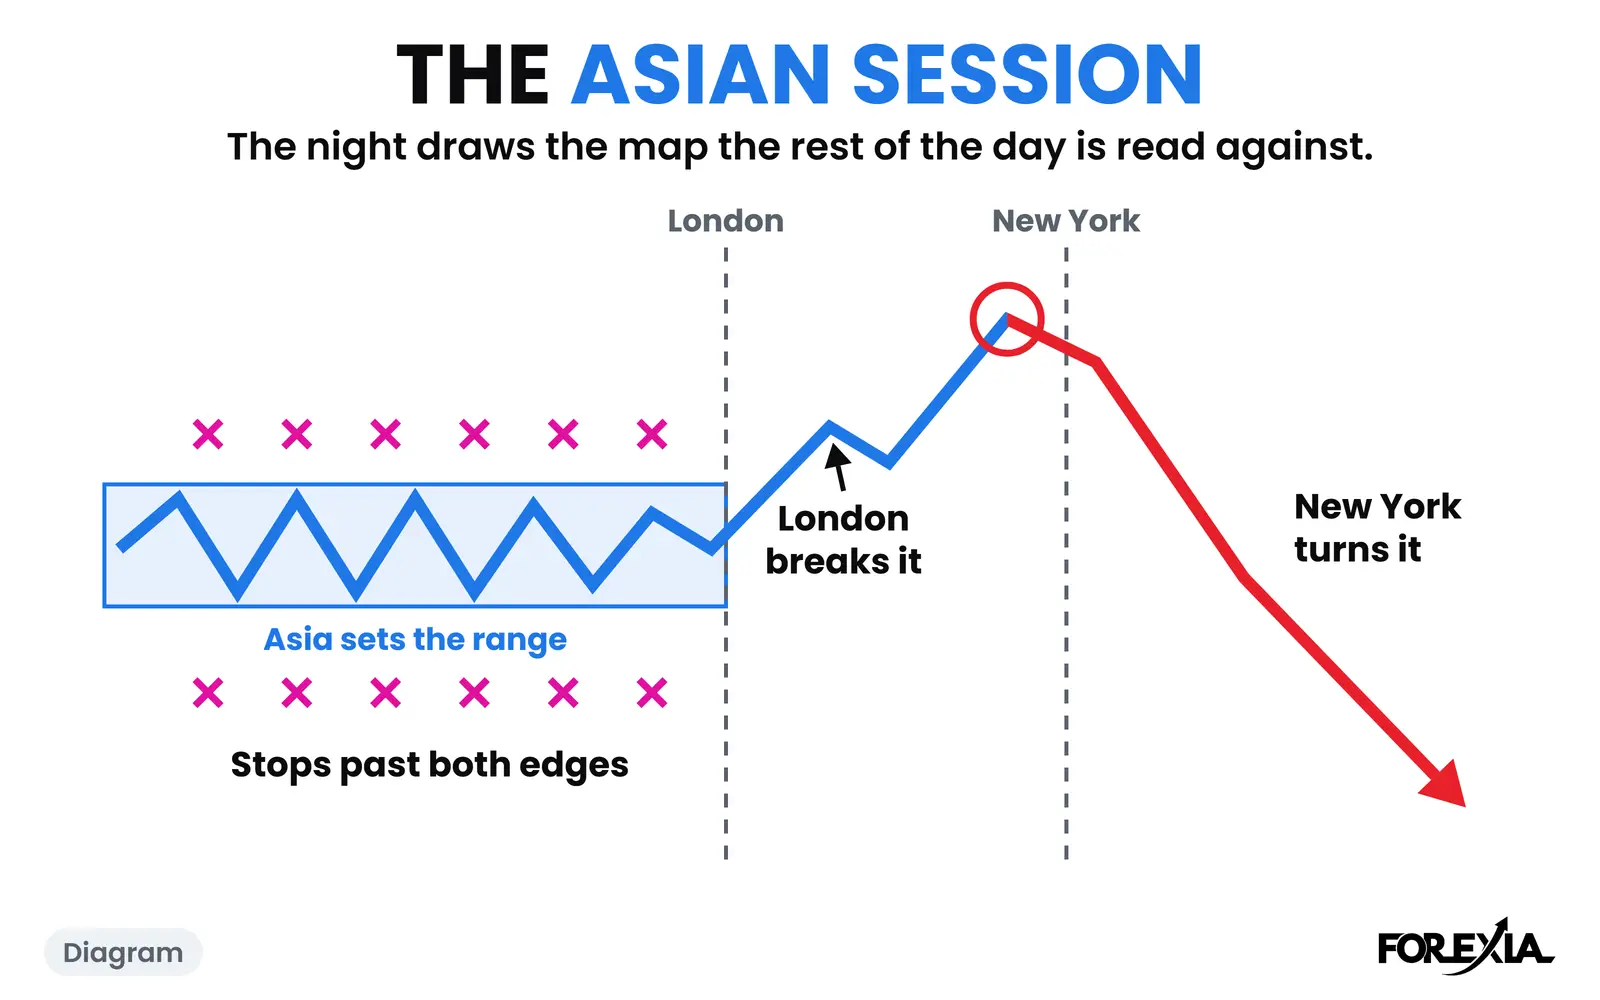
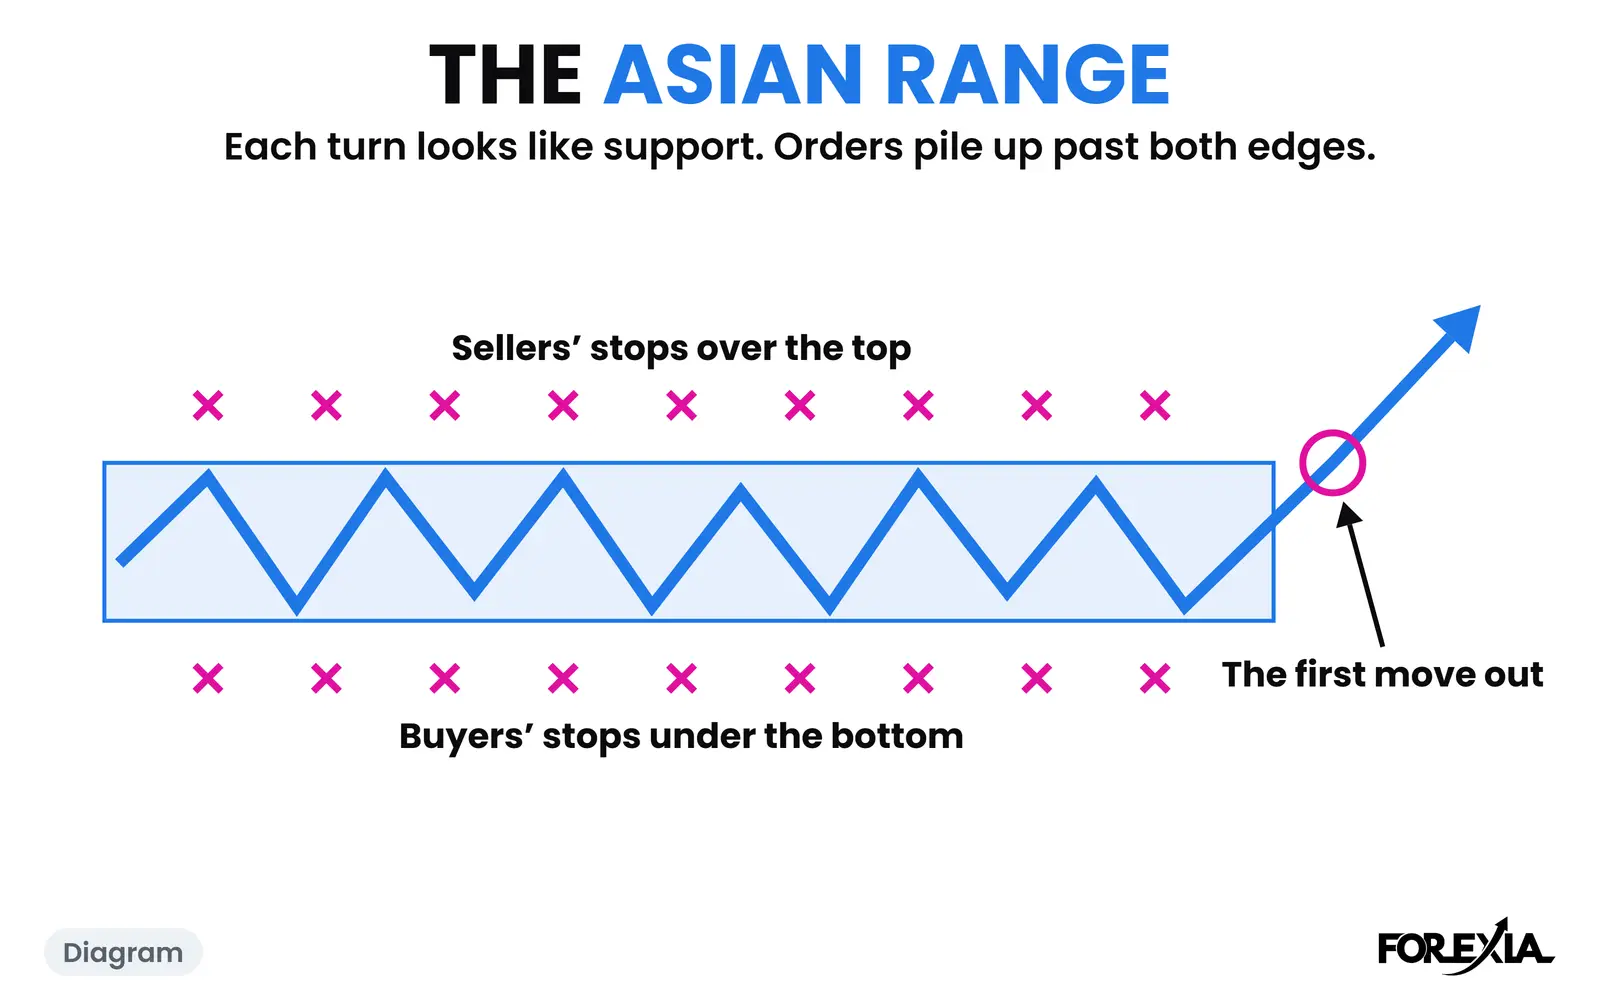
Most of the time, the same day. We counted seven dollar majors and gold on 15-minute candles from 6 April to 1 October 2026. A level is an edge of the Asian box or the previous day's high or low, taken after the London open by at least 3% of the average daily range. The Close Back's page has the full split, so here is what bears on this comparison.
- Of 1,601 levels taken, 291 had not closed back by the end of the day. Those are the real breakouts by this test, and they ran a median of 65% of an average day past the level.
- The kind of level made little difference. Not closed back on Asian box edges: 210 of 1,179. On the previous day's highs and lows: 81 of 422.
- A close back is no finish line. After 825 of 1,310 close backs, price traded past the wick again later that day, which is what USD/CHF on 20 July did.
- The later ones go deeper. Levels that closed back on the first candle had gone a median of 5% of an average day past the level, and those that took longer, 13%.
That counts candles, not trades: no entry, stop or cost. It does not say a grab can be traded.
How do you tell them apart?
You mark the level first and then read closes, knowing they can change. Wicks prove nothing, since a candle can trade back through a level and close on the wrong side. Volume is little help on spot forex, where no central exchange reports it. Size does not sort them either: a tenth of a pip held on 15 July and 2 pips did not on 20 July.
Whether it was deliberate cannot be shown. A sweep can happen with no hunter at all, from a thin market or a chain of stops feeding itself, and those candles look the same. The three seats keep this straight:
- Retail reads the first candle as the event and chases it, or sells against it.
- The market maker's seat, as we read it, sees a fill. Until the candle closes, it can go further.
- The observer waits for the close and reads it as a fact about the past, not a promise about the next hour.
Which should you trade, a liquidity grab or a breakout?
We cannot tell you that either one pays. Run as a fixed rule, trading against the hunt did not make money in our test, and many of its losses were real breakouts. That is no case for the other side either: this page makes no claim about buying breakouts. What we found when the hunt kept going has those days, and the false breakout in forex asks who a break was built for. The stop hunt guide has more dated days, and so does the USD/CHF markup from 21 September 2026.
Common mistakes
All three come from deciding before the chart has finished saying.
- Reading a wick as an answer. At 08:45 on USD/CAD a candle traded 5 pips back over Tuesday's low and closed 4 under.
- Treating a close back as final. On USD/CHF on 20 July one lasted an hour, then the breakout went on.
- Reading a huge candle as a breakout. A release candle like USD/CAD's can break a level and still come back within two hours.
Course 3 of ForexiaPRO, Reverse Price Action, teaches this read step by step in lesson 3.3.1.
Frequently asked questions
What is the difference between a liquidity grab and a breakout?
A liquidity grab trades past a level and closes back on the side it came from. A breakout closes beyond the level and stays there. The first candle can look the same on both, so the test is where candles close, and the answer can change later in the day.
How do you tell a liquidity grab from a breakout in real time?
You wait for the candle to close, and you still hold the answer loosely. On USD/CHF on 20 July 2026 a candle closed back under Friday's high, which reads as a grab, and an hour later price closed over it and kept going. Mark the level first, read the closes, and accept that the read can change.
Does volume separate a liquidity grab from a breakout?
Not on spot forex. There is no central exchange, so the volume on a retail chart is a broker's count of price changes rather than the market's. Guides that lean on a volume spike are mostly written for markets with a central record.
How often is a break of a level a real breakout?
In our count of 1,601 levels taken on seven dollar majors and gold, from 6 April to 1 October 2026, 291 had not closed back by the end of the day. Asian box edges and the previous day's highs and lows came out much the same, 210 of 1,179 and 81 of 422. That counts candles, not trades.