Previous Day High and Low Trading Strategy: A Hunt or a Real Break?
Dylan Forexia9 min read
A previous day high and low trading strategy trades yesterday's extremes in one of two ways: fade the level, or trade the break. Nearly every guide gives both. What they leave out is that both trades put their orders past the same line. This page shows what those levels did on three real days in 2026, and gives no entry, stop or target of ours.
The levels themselves, and how often price closes back through them, are on the previous day's high and low. This page is about the trades built on them.
What is a previous day high and low trading strategy?
It is a rule set built on the last completed day's two extremes, and the textbook comes in three versions. These are the guides' rules as they state them, and not ours.
- The breakout. Buy over yesterday's high, sell under yesterday's low. Often a full candle close beyond and above-average volume are required. The stop goes beyond the breakout candle, and the target is a projection of the prior range.
- The fade. Sell at yesterday's high and buy at yesterday's low, with the stop just past the line and the target at the middle of the range or the other side.
- The sweep and reclaim. Some guides wait for price to go through and close back, then trade back into the range.
Spot forex has no central tape, so "volume" there is usually a count of price changes on one feed. The day boundary matters too: a forex day runs from 17:00 New York, so on a Monday the previous day is Friday.
All three versions use the same two lines, and that is the first thing they leave out.
What do the two trades have in common?
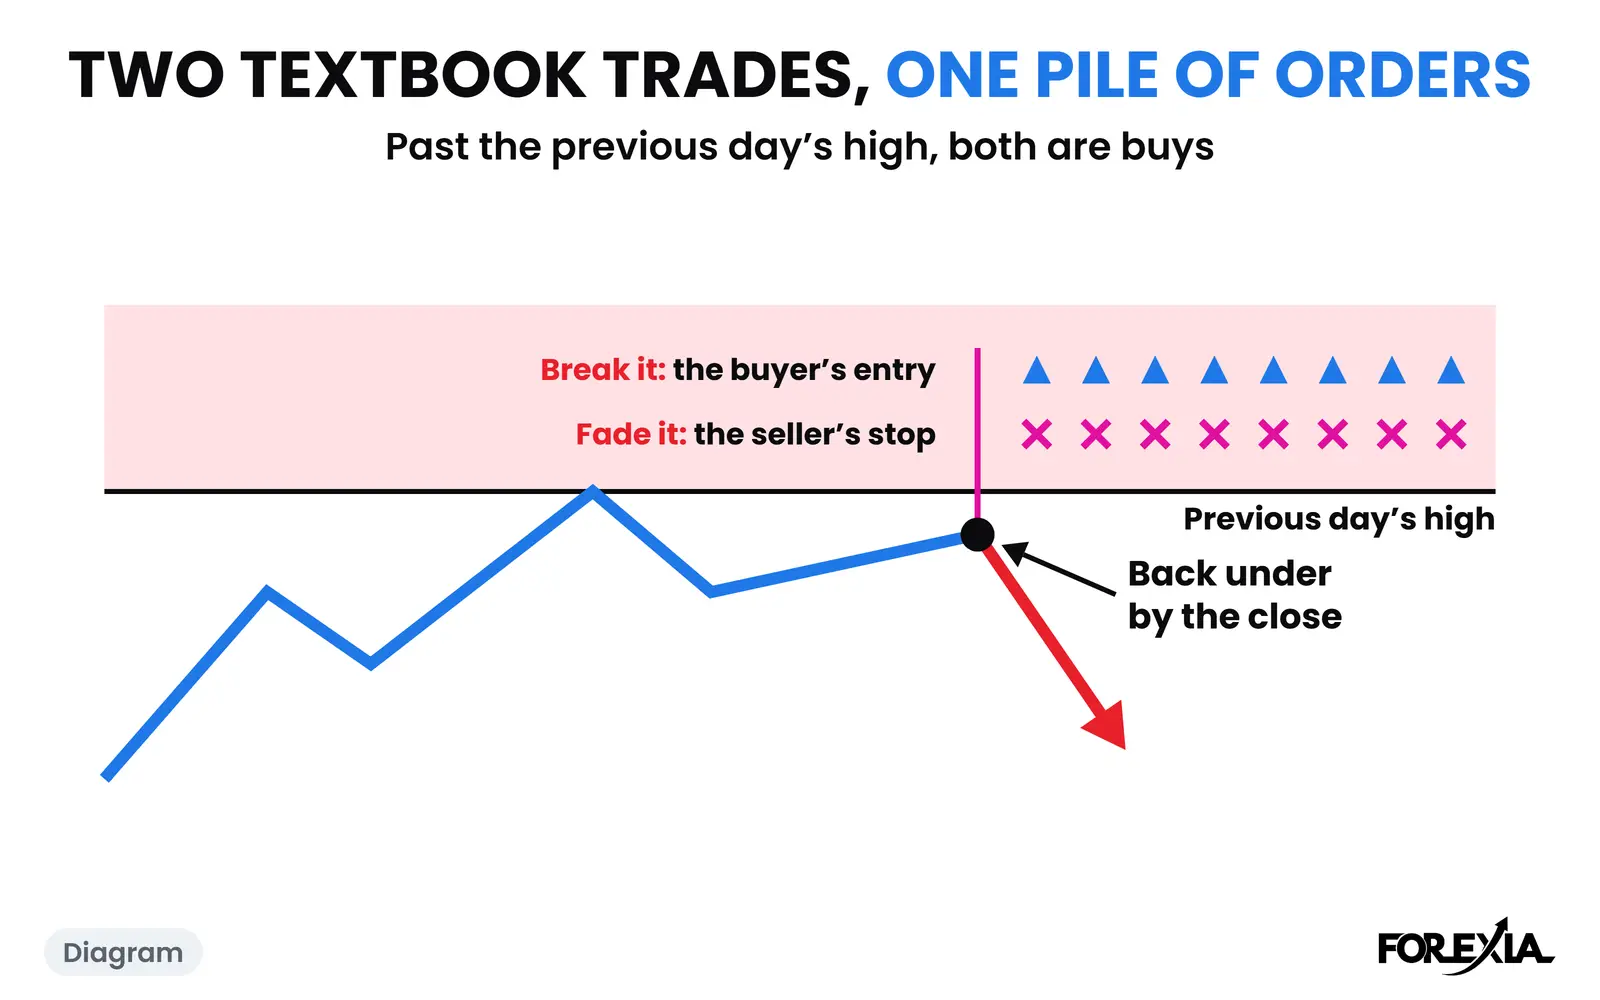
Their orders. The fader's stop goes just past the line, and the breakout trader's entry goes just past the line. Past a high, both are buy orders. Past a low, both are sells. That is the answer most guides give to where to put a stop loss in forex trading, and it is why stops pile up past highs and lows. So a move a few pips through yesterday's high fills one group's entries and closes another group's trades in the same breath. We call that move the stop hunt; most traders say liquidity sweep.
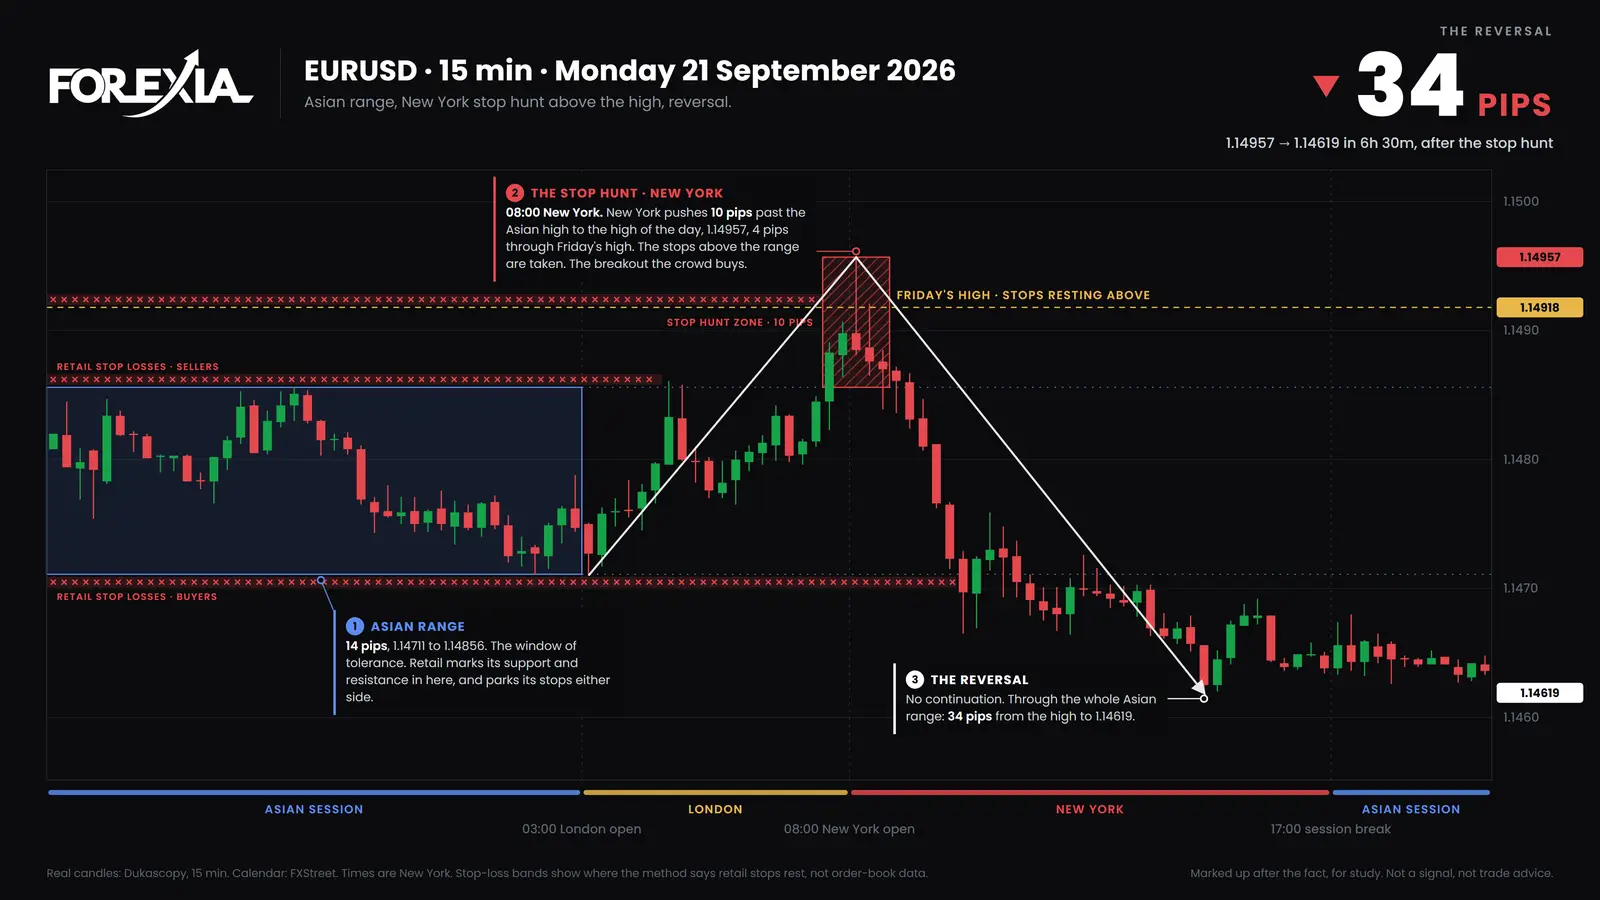
A hunt on the same candle: EUR/USD, Monday 21 September 2026
Friday's high was 1.14918, 6 pips over the night's range of 1.14711 to 1.14856. At 07:45 New York price stopped a pip short, at 1.14907. Then the 08:00 candle ran to 1.14957, 4 pips through, and closed at 1.14885, 3 pips back under. That is the close back, and no medium or high-impact release lined up with it.
The fader with a stop inside those 4 pips was out. The breakout buyer who took the first tick over the line was under water before the candle closed. The 08:15 candle reached 1.14921, a fraction over, and no candle closed above Friday's high all day. The first close under the night's range came at 10:00, at 1.14697, and by 14:30 price was at 1.14619, 34 pips off the high. The ECB president's speech, a high-impact item, came at 11:00, inside that fall.
A hunt that looked like a break: USD/JPY, Monday 28 September 2026
Friday's low was 156.938, 25 pips under the night's range. The 04:00 candle closed at 156.697, 24 pips through. By any breakout rule that is a full close beyond the level, and the textbook sells. The 04:15 candle reached 156.506, 43 pips through, and closed under as well, and so did the next two.
The 05:00 candle closed back above at 156.991. That still did not settle it. The 07:15 candle closed under the line again at 156.882, before the 07:30 closed back at 156.946. By 11:00 price was at 157.583, 108 pips off the low, and no medium or high-impact release for either currency came that day.
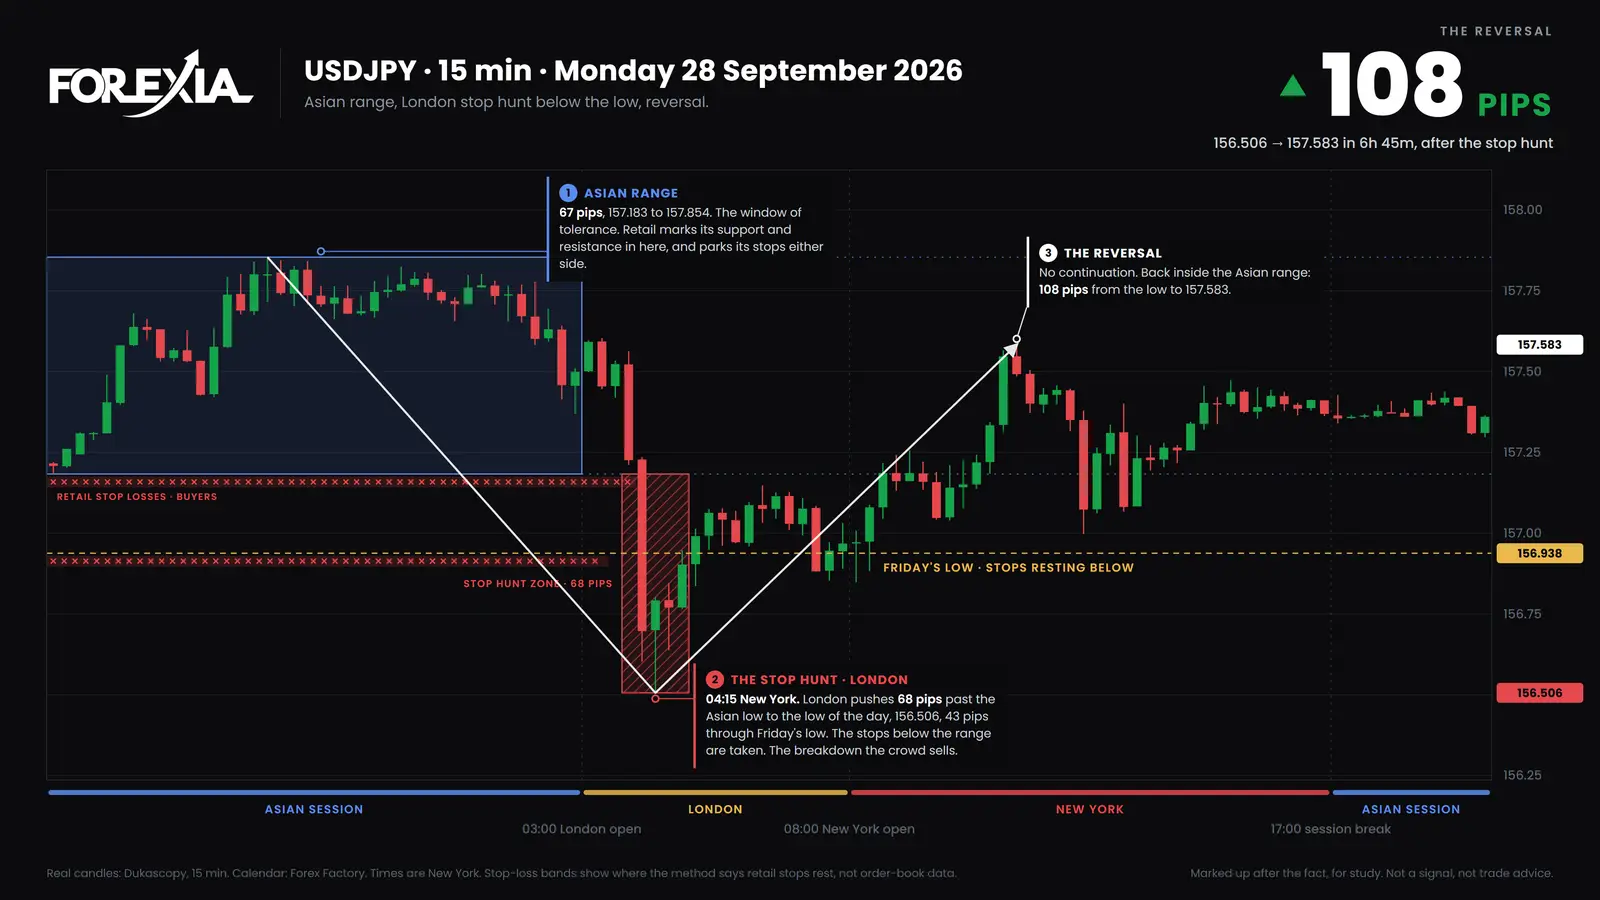
Even that was not the end of the line. In the first hours of Wednesday's session price went 13 pips under Monday's low, to 156.377. That week's other days are in the markups of 28 September.
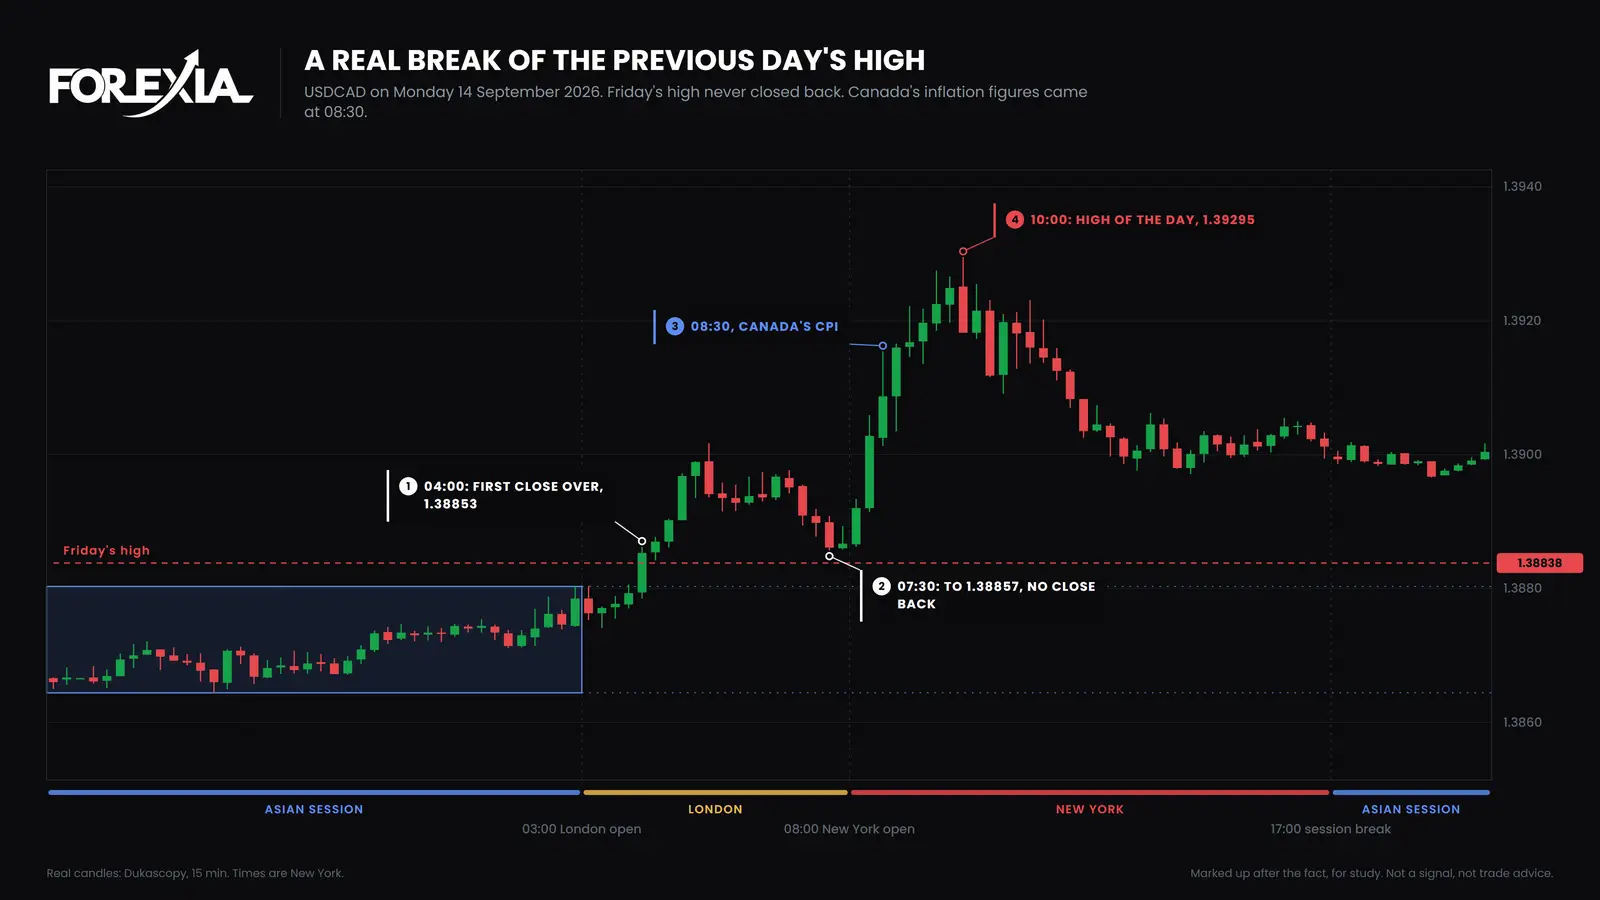
A real break: USD/CAD, Monday 14 September 2026
Some breaks are real, and our markups leave them out, because we only mark up days that reversed. Friday's high was 1.38838, 4 pips over the night's range. The 04:00 candle closed at 1.38853, under 2 pips through. It looked like nothing much, and the 04:15 candle dipped to 1.38842, under a pip from the line, before closing higher.
At 07:30 price came back again, to 1.38857, 2 pips from the line, and closed at 1.38861. A fader would have been waiting for one more candle, and it never came. Canada's inflation figures landed at 08:30, and the 10:00 candle reached 1.39295, 46 pips past the line. The day closed at 1.39012, 17 pips over it. No 15-minute candle closed back that day, or that week, because Friday's high was also last week's high and the week ran away from it.
Here is what each textbook trade met on these days. These are distances on the chart, with no stop, cost or exit applied, so they are not results.
| Day and line | Fading at the line | Trading the first close beyond |
|---|---|---|
| EUR/USD, Friday's high, 1.14918 | 4 pips against, then 30 pips the other way by 14:30 | No close beyond that day, so no trade by that rule |
| USD/JPY, Friday's low, 156.938 | 43 pips against, then 65 pips the other way by 11:00 | 19 pips further by 04:15, then 89 pips against by 11:00 |
| USD/CAD, Friday's high, 1.38838 | 46 pips against by 10:00, with no close back | 1 pip against at 04:15, then 44 pips the other way by 10:00 |
Neither column held up on all three days. That is three chosen days, and they are here to show the range of what happened, not to compare the rules.
What does the textbook strategy leave out?
It leaves out how often the line goes through, and what a close back is worth. We counted the previous day's highs and lows on seven majors and gold, on 15-minute candles from 6 April to 1 October 2026. A level counts as taken when price trades past it by at least 3% of the average daily range between the London open and 17:00 New York, and a level Asia had already passed is left out. That gives 422 levels, and the glossary page has the full table. In short, 341 closed back the same day and 81 did not.
Now split those close backs by speed, because the sweep and reclaim version depends on it. A close back on the very first candle looks the cleanest. It was also overrun the most: a later candle went past the wick on 84 of 118 (71%), against 121 of 223 (54%) where the close back took longer. EUR/USD above was one of the tidy ones that held. Most did not.
Depth tells the other half. The median trip past the line was 5% of an average day where the close back came on the first candle, and 13% where it came later. Where no close back came, it was about two thirds of a day. So the break that keeps going is a minority of levels, and it runs far. A stop just past the line is exposed to all of them.
These are counts of candles, not trades. They say nothing about a rule's result after spread and slippage, and our own mechanical test of the setup did not make money.
Three more things the rule sets do not mention:
- A release. A sweep at 03:30 says nothing about a Fed decision at 14:00, as the liquidity sweep guide shows on EUR/USD on 16 September 2026.
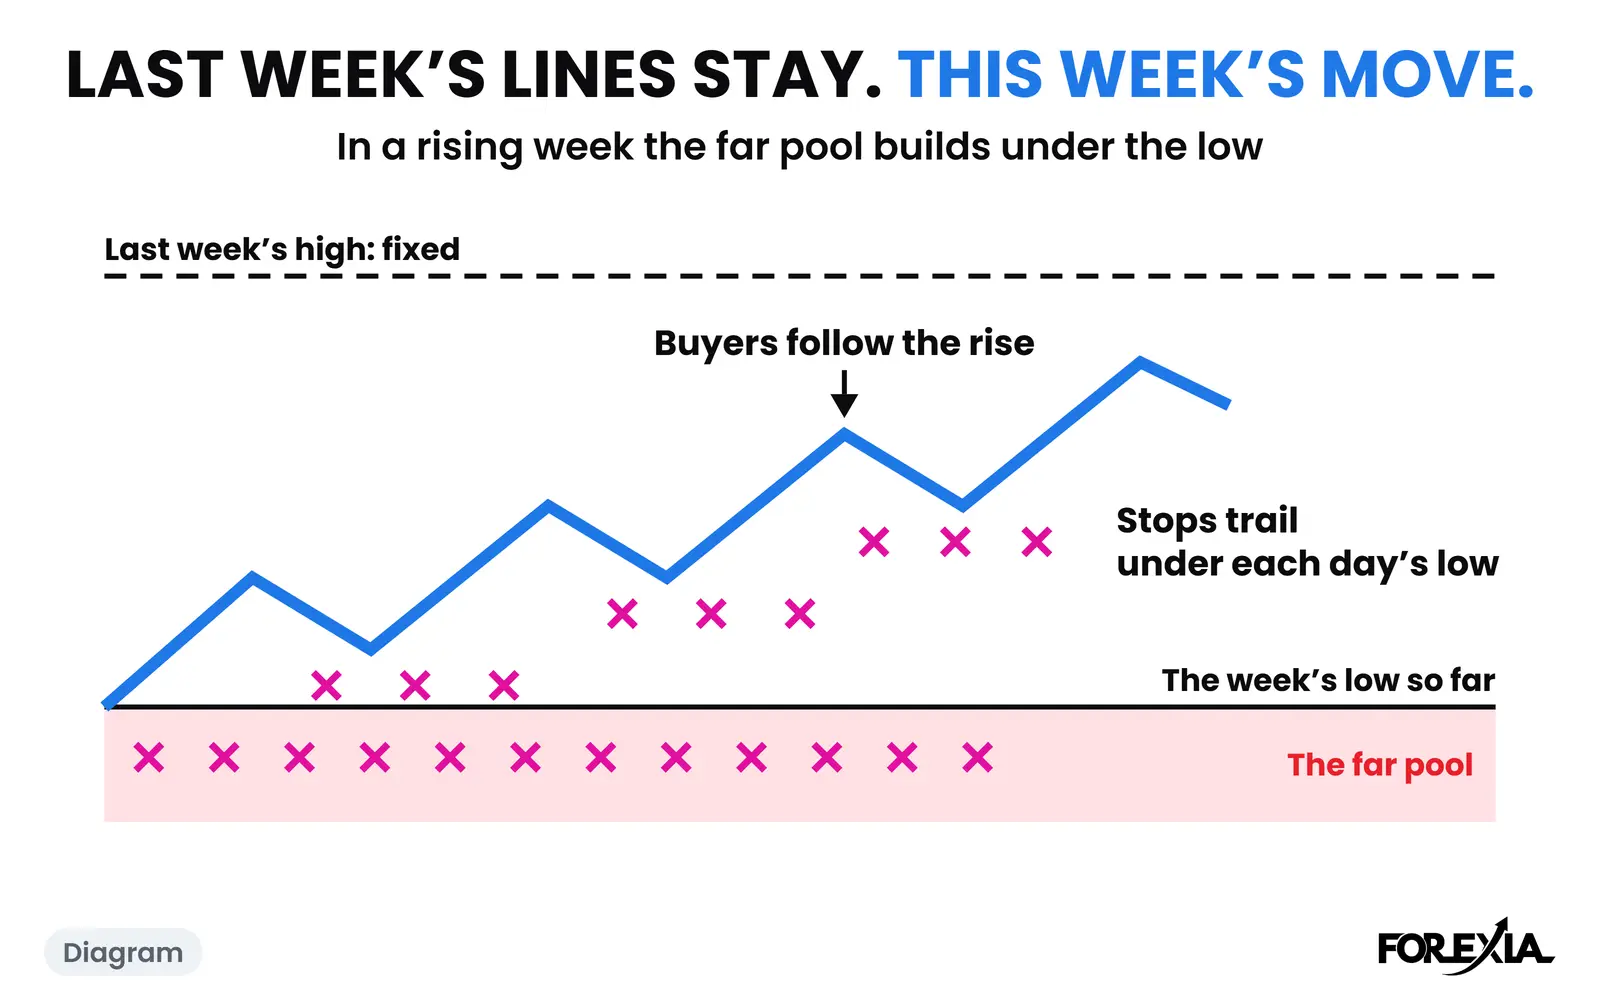
- The other pools. Yesterday's line sits on a map with the night's range and the week's levels, and finding them together changes which line matters.
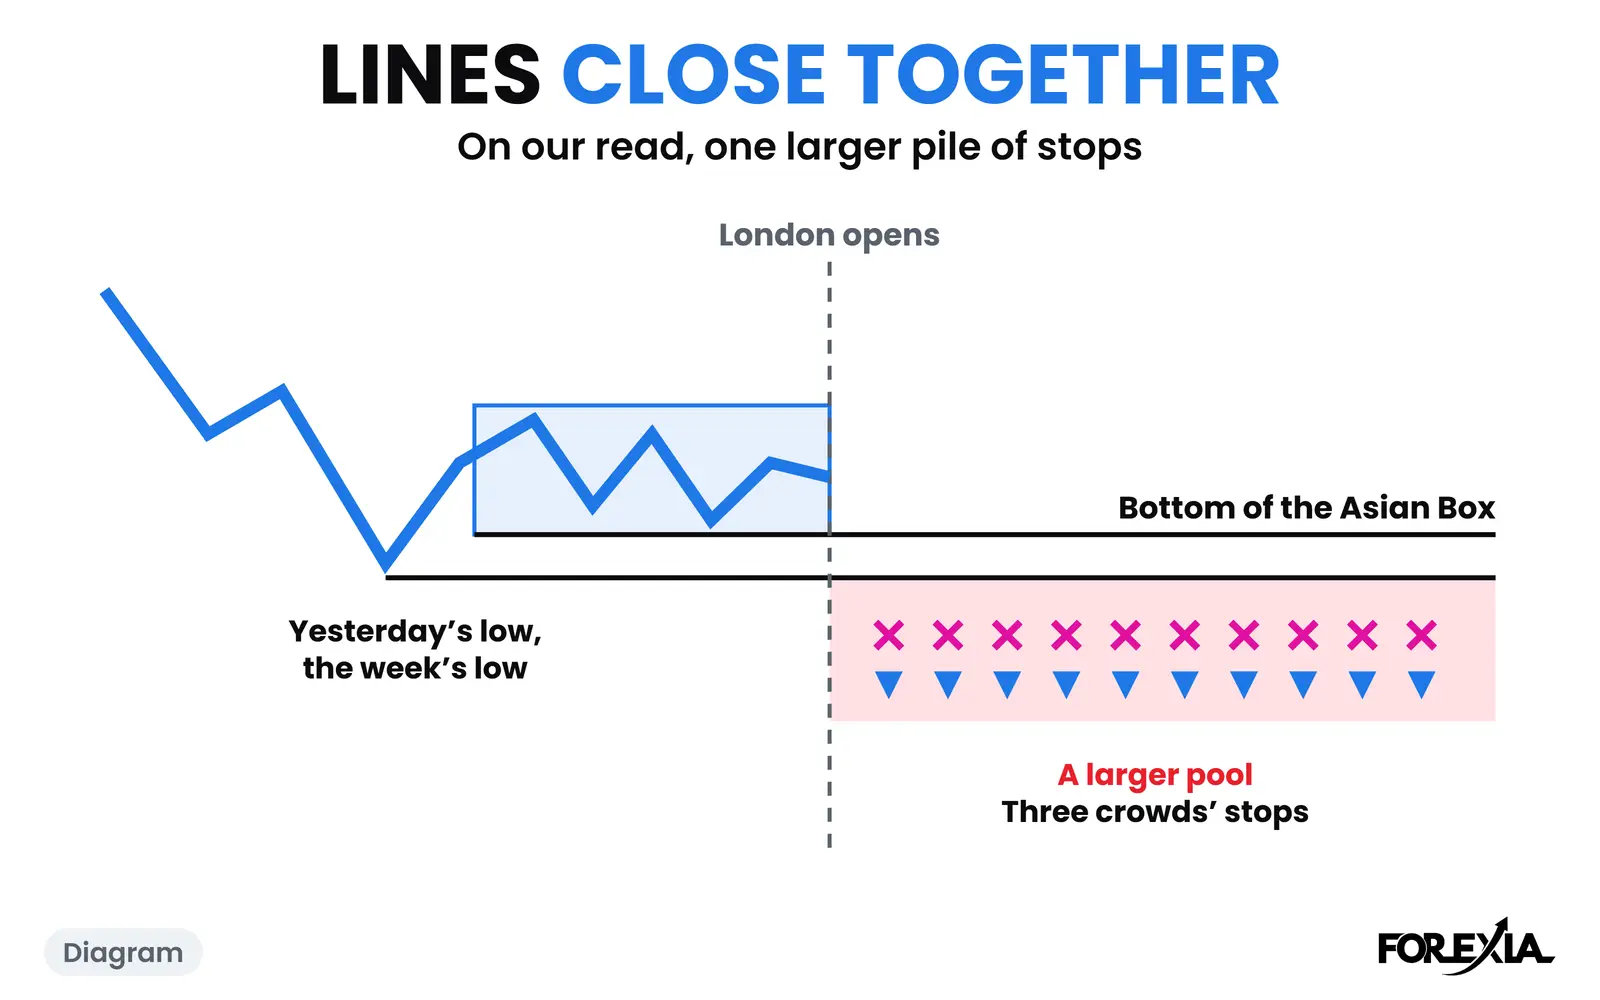
- A level already gone. If Asia traded past yesterday's low before London woke up, the line in your rule set no longer has the orders it had.
How do you avoid a stop hunt at these levels?
No distance does it. On these three days price went 4, 43 and 46 pips past the same kind of line, so a stop a few pips wider moves the problem and does not solve it. How to avoid stop hunts has its own page, and stop hunting in forex covers whether it can be shown at all. What this page can say is that a stop past yesterday's high or low sits in the same few pips as many others, and you can know that before you place it.
What did each seat see?
The three seats read the EUR/USD candle three ways.
- Retail saw a level and a trade. Sell at 1.14918, or buy over it.
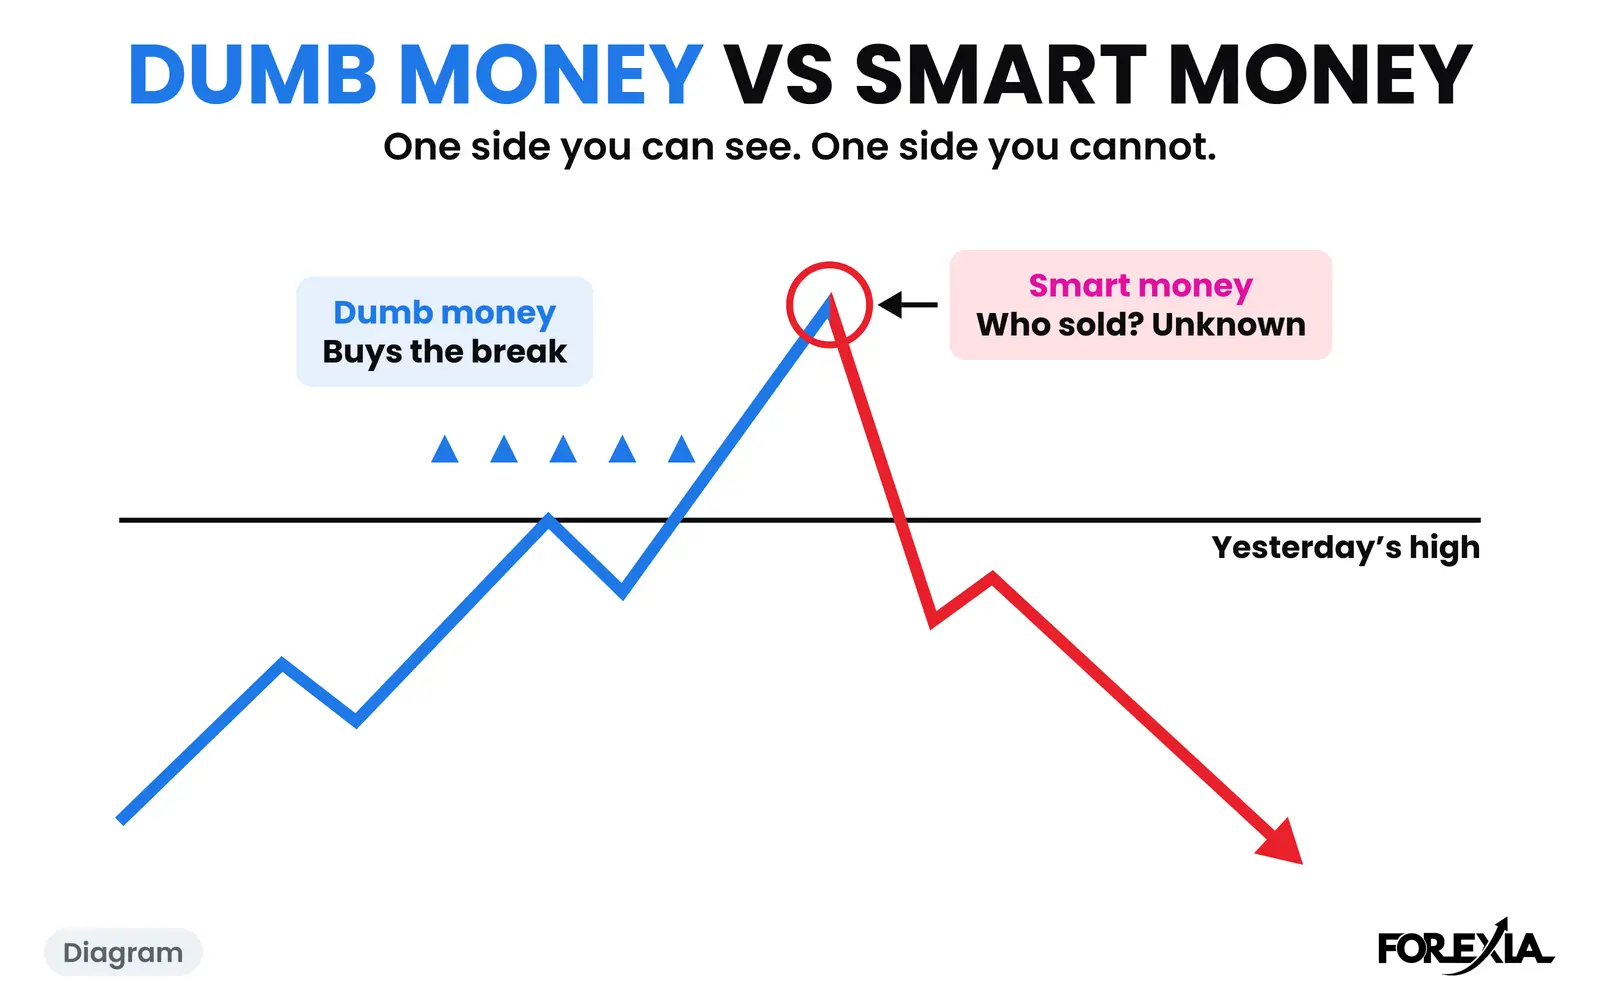
- The market maker, as we read it, saw buy orders. Stops and breakout entries over 1.14918 were all buying, and a large seller needs buyers.
- The observer saw the close. Through by 4 pips, back under by 3, on one candle. What it meant was known only later.
Common mistakes
These come from treating one candle as an answer.
- Reading the first close as the verdict. USD/JPY closed 24 pips through and turned out a hunt. USD/CAD closed under 2 pips through and turned out real.
- Reading the close back as the verdict. USD/JPY closed back at 05:00, closed under again at 07:15, and took that low again two days later.
- Testing the rule only on days you remember. Days that reversed are the ones that get marked up. For another, see the W on USD/CAD on 10 April in the markups of 6 April. A real break like USD/CAD's leaves nothing to draw.
Course 1 of ForexiaPRO, Reading the Map, teaches this read step by step in lesson 1.2.3.
Frequently asked questions
Does the previous day high and low strategy work?
We have not tested each textbook version as written. Our own test of a related setup, run as a mechanical rule against the hunt, did not make money. In our count, 341 of 422 previous-day levels taken closed back the same day, and after 205 of those a later candle went past the wick again. Those are counts of candles, not trades.
Should you trade the break or fade the level?
The chart cannot tell you in advance, which is the problem with either as a fixed rule. On EUR/USD on 21 September 2026 the break of Friday's high closed back on the same candle. On USD/CAD on 14 September 2026 the break of Friday's high never closed back that day. This page shows what happened and gives no rule of its own.
Where do most traders put their stop on these levels?
Just past the level or just past the breakout candle, which is what most guides say. That is why we read stops as pooling there. It describes where the crowd's stops are, and it is not advice on where yours should go. How far price went past the line ranged from 4 pips to 46 pips on the days on this page.
Does the chart's day boundary change these levels?
Yes. A forex trading day usually runs from 17:00 New York to 17:00 New York, so on a Monday the last completed day is Friday. A chart with a different day boundary draws different lines, so a rule tested on one platform may not be trading the same levels on another.