How Often Does New York Reverse London? A Count on 458 Days
Dylan Forexia8 min read
How often does New York reverse London? On about one day in five when London's break is still standing, by a strict rule. On 458 such market-days, New York went past London's extreme and then closed back inside the Asian range on 91 (20%). It closed back with no new extreme first on 173 (38%), and not at all on 194 (42%). These are candles, not trades, and past days only.
The strict case is the New York Reversal, our word for the dealer moving against the London Breakout in the New York session. The looser question, whether New York undid London at all, has a larger answer: 264 of the 458 days (58%) closed back inside the range.
How often does New York reverse London, out of every day?
Most days never reach the question. Of the 1,030 market-days counted, every one fell into exactly one of these rows, and only the last three had a break for New York to undo.
| What the day did | Market-days |
|---|---|
| No London candle closed outside the Asian range | 285 |
| London closed outside, and was back by New York's open | 287 |
| New York went past London's extreme, then closed back inside | 91 |
| New York closed back inside with no new extreme first | 173 |
| No New York candle closed back inside | 194 |
Two things in that table matter more than the headline.
- London undoes itself on about as many days as New York does. It did so on 287 of the 745 days it closed outside the range. New York did so on 264 of the 458 left.
- A new extreme is not a reversal. With the break still standing, New York traded past London's extreme on 269 of the 458 days. On 91 it closed back inside, and on 178 it never did.
The reversals are often small as well. Only 19 of the 91 closed beyond the far side of the range by 17:00 New York.
A looser test finds nothing either. In the longer test behind our mechanical backtest, from February 2021 to December 2024, New York moved against London's direction on 50% of 8,124 pair-days, which is a coin flip. That is another sample and another rule, so it does not belong in a sum with the table above. It says a turn in New York is not in itself a finding.
What rule did we count, on what sample?
The rule is built from closes, so a break has to be seen before New York can undo it. These are the terms.
- The Asian range: the Asian Box, the high and low from the 17:00 New York session break to the London open.
- London: from its open to the New York open at 08:00 New York. New York: from 08:00 to 17:00.
- London broke: a London candle closed outside the range. The first one is the break.
- Standing at New York's open: London's last candle closed outside, on the side of the break.
- London's extreme: the furthest price from the first close outside to the end of London.
- Past the extreme: a New York candle traded beyond it by at least 3% of the average daily range, the average of the 15 trading days before. That is our line between a touch and a hunt.
- Closed back inside: a New York candle closed inside the range, exactly on the edge included, by 17:00. A day that closed back first and only then went past London's extreme counts under "no new extreme first".
Sample and dates. Dukascopy's 15-minute bid candles on seven dollar majors and gold, from Monday 6 April to Thursday 1 October 2026: 25 whole weeks and four days, 1,030 market-days.
What is left out. The low of each day's first candle is clipped to its body, because it is often only the spread widening. Nothing after 17:00 is read, so a turn the next morning does not count. Friday 2 October onward is out. A day that closed back inside during London and went out again is counted by where London's last candle closed.
This count is by London's closes. Pages that count an edge traded through at any time after the London open, such as which side of the Asian range goes first, use another rule on the same days.
Does it differ from market to market?
The strict figure ran from 10% on AUD/USD (5 of 51) to 31% on EUR/USD (22 of 70). Samples this small, on eight markets moving on one dollar, will not rank anything.
| Market | London's break stood | New York past the extreme, then inside | Inside, no new extreme first | Not inside by 17:00 |
|---|---|---|---|---|
| EUR/USD | 70 | 22 | 22 | 26 |
| GBP/USD | 68 | 13 | 24 | 31 |
| USD/JPY | 44 | 8 | 18 | 18 |
| USD/CHF | 56 | 12 | 21 | 23 |
| AUD/USD | 51 | 5 | 23 | 23 |
| USD/CAD | 68 | 15 | 27 | 26 |
| NZD/USD | 54 | 8 | 23 | 23 |
| Gold | 47 | 8 | 15 | 24 |
| All eight | 458 | 91 | 173 | 194 |
When in the session did the 91 happen?
The push came early and the close back came later. Measured from the New York open to each candle's open, the median push past London's extreme came after 30 minutes, and the median close back after 3 hours. The push came in the first two hours on 85 of the 91. The close back came in the first four hours on 56.
Releases explain few of them. A high-impact US item fell inside the push candle on 10 of the 91, and inside the close back candle on 3.
The crowd's averages were late, too. At the close back the 20 EMA of the 15-minute closes was still on London's side of the 50 EMA on 89 of the 91. It crossed by 17:00 on 56 of those, a median of 1 hour 45 minutes after the close back. That says how late the averages were and nothing about what to do.
What did a reversal and a day without one look like?
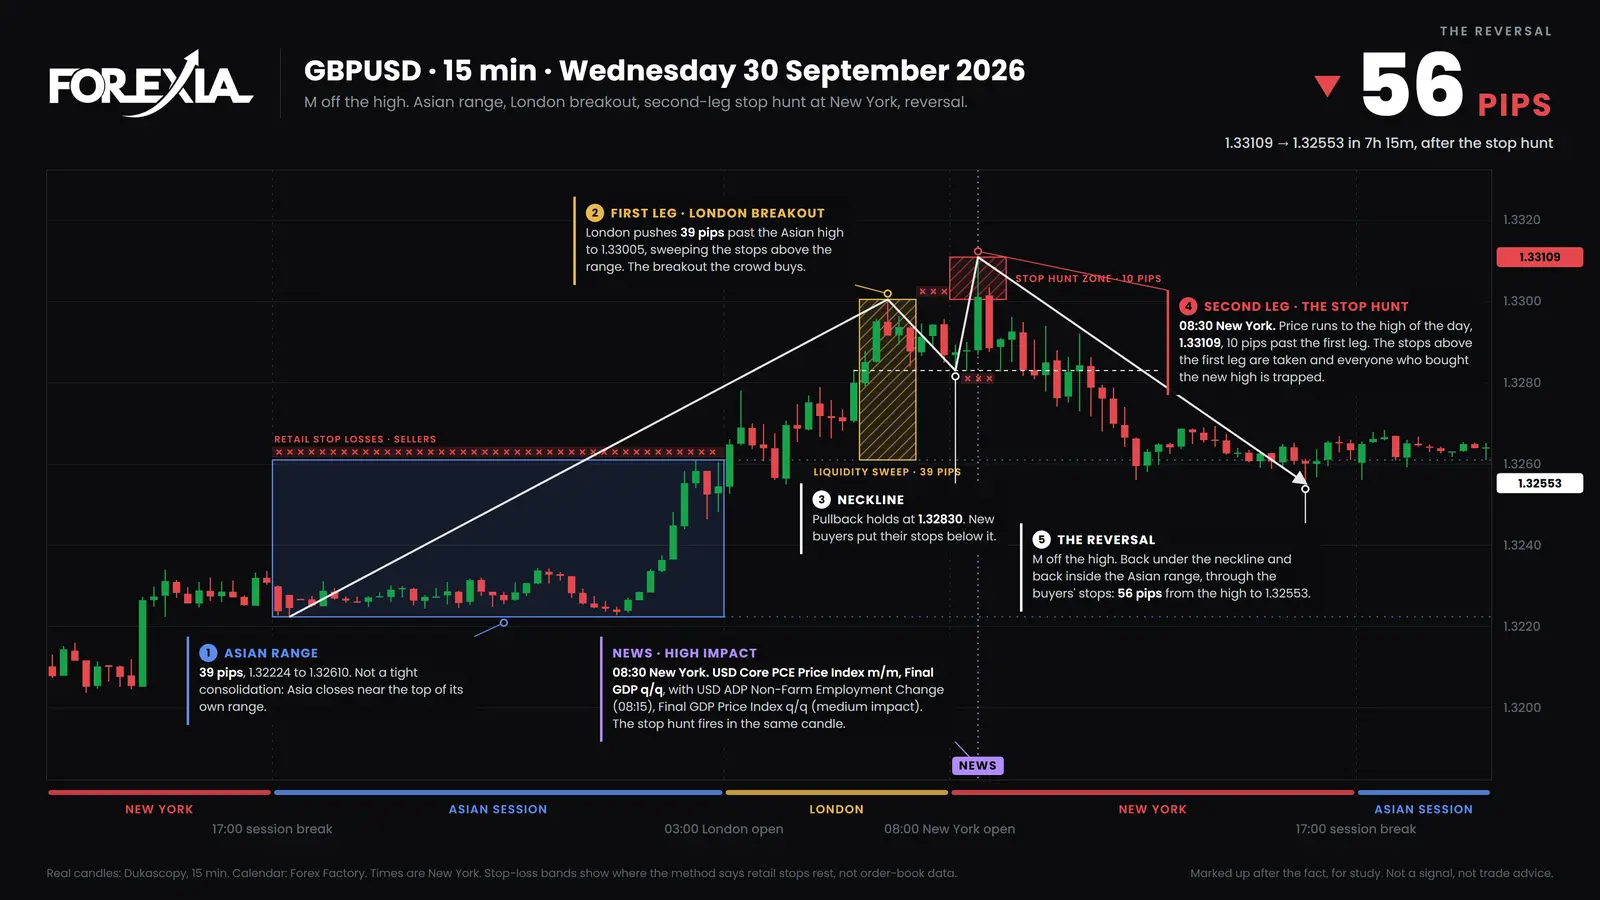
GBP/USD on Wednesday 30 September 2026 is one of the 91. The box ran from 1.32224 to 1.32610, 39 pips. The 03:00 candle closed over it, and by 06:30 London's high was 1.33005. London's last candle closed at 1.32868, still outside. The 08:30 candle, the minute of US core PCE and final GDP, ran to 1.33109, 10 pips past London's high, and closed at 1.33011. That second push is the second leg of a reversal. The 12:00 candle closed back inside at 1.32595.
It was no collapse. The low after that was 1.32553 at 15:45, far from the bottom of the box, and the last candle closed at 1.32634, back over the top by 2 pips. It counts as a reversal by the rule, and it is among the 72 of the 91 that never closed beyond the far side.
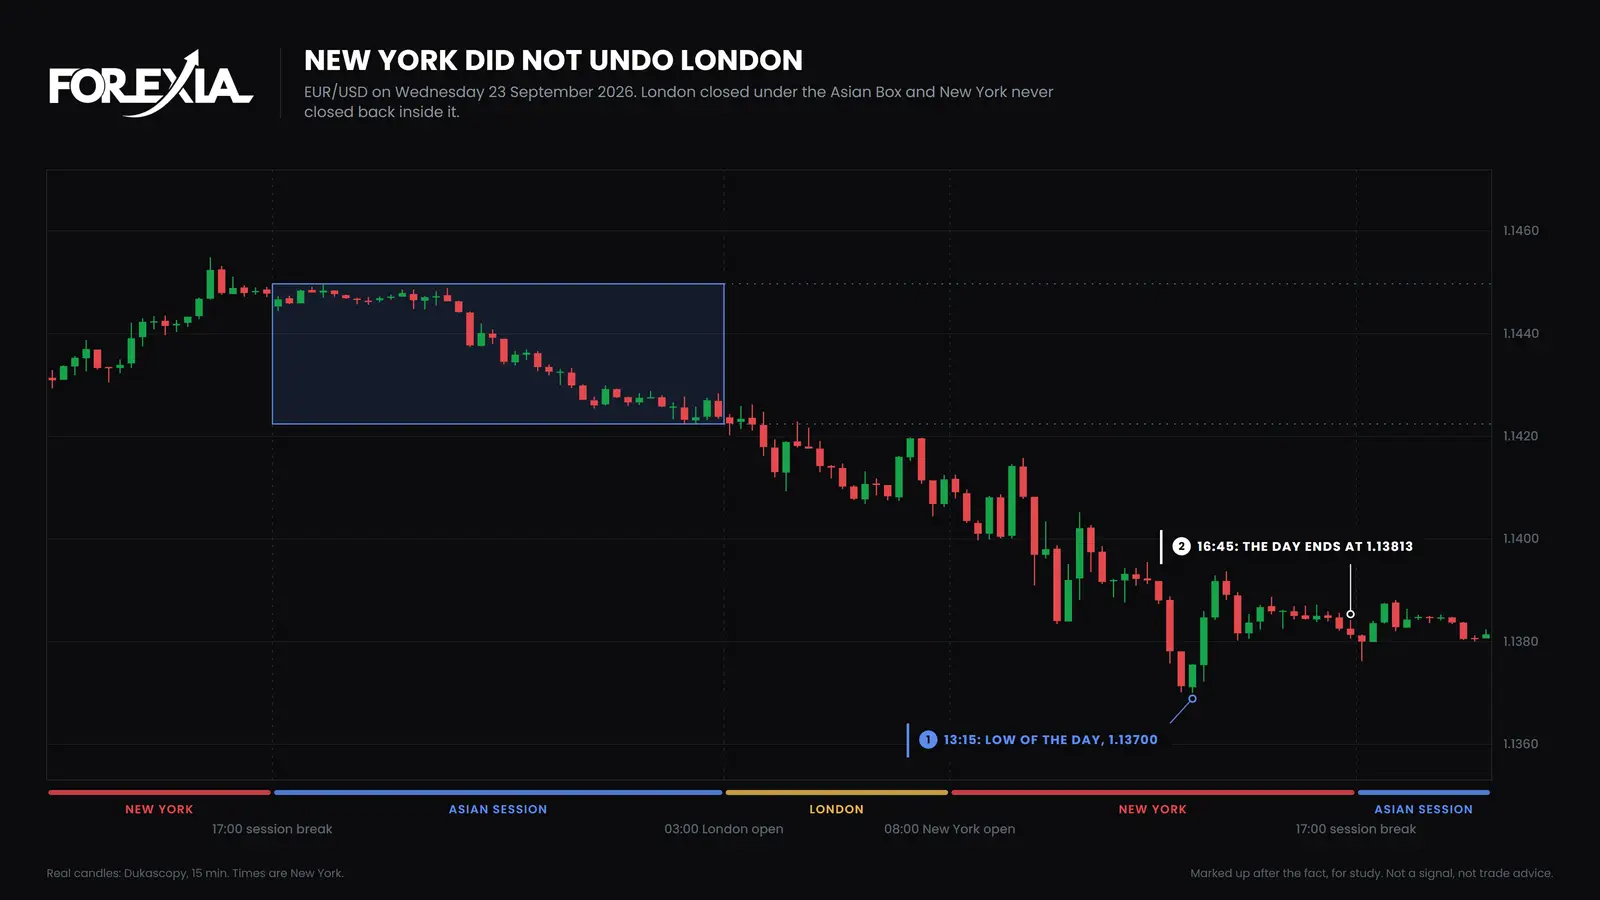
We read the push as a run on the stops left over London's high, filled by selling into them, and that is a reading. EUR/USD on Wednesday 23 September 2026 looked just the same at New York's open and went the other way. The box ran from 1.14224 to 1.14497, 27 pips. The 03:30 candle closed under it by a tenth of a pip, London's low was 1.14044 at 07:30, and London's last candle closed at 1.14116, still outside. New York carried on to 1.13700 at 13:15, 34 pips past London's low, and the day ended at 1.13813, 41 pips under the box. The crowd that sold London's break was right all day.
What does this count not prove?
It does not prove that New York will turn on any given day, or that anyone chose to turn it. The limits are these.
- Candles, not trades. There is no entry, stop, spread, commission, slippage or filter here.
- Past days only. It covers one run of months in one setting of the clocks, on one bid feed.
- Known afterwards. At New York's open, GBP/USD on 30 September and EUR/USD on 23 September looked alike. A reversal seen afterwards is not a setup.
- Not independent. The eight markets move on one dollar, so 458 days are fewer separate events than they look.
- Who sold cannot be seen. Forexia's read is that market makers use the orders London leaves. The count shows the shape and not the seller.
- It says nothing about results. Our own test of the setup as a fixed rule did not make money after costs, as our liquidity sweep backtest sets out.
For rules tested with costs, see gold trading strategies tested. One input from outside the candles has its own study: does the COT report work for forex. More of these are on our research page.
What changed when this page came back?
This page was taken down on 31 October 2026 and put back on 11 November 2026. Its figures were rerun on 11 November 2026 with scripts/seo-counts.mjs. Every count matched the stored file exactly, to the candle. The sample still ends on 1 October 2026. No finding was reworded to read better than the numbers.
Course 2 of ForexiaPRO, The Chaos Pattern, teaches this read step by step in lesson 2.4.1, The New York Reversal.
Frequently asked questions
How often does New York reverse the London move?
On seven dollar majors and gold from 6 April to 1 October 2026, London's break of the Asian range was still standing at New York's open on 458 market-days. New York went past London's extreme and then closed back inside the range on 91 (20%). It closed back with no new extreme first on 173 (38%), and not at all on 194 (42%).
What time does New York reverse London?
On the 91 days, the median push past London's extreme came 30 minutes after the 08:00 New York open, and the median close back inside the range came 3 hours after it. The candles are named by their open. These are medians read afterwards, not a timetable.
Does a new high in New York mean London's move is over?
No. With London's break still standing, New York went past London's extreme on 269 of the 458 days. On 91 it then closed back inside the Asian range, and on 178 it never did.