Double Top Failure Rate: How Often Double Tops and Bottoms Fail, Counted
Dylan Forexia7 min read
The double top failure rate depends on what you call a failure. Of 983 double tops and double bottoms on 15-minute forex and gold candles, 680 (69%) never closed through the neckline that day, or went past the peak first. Of the 303 that did close through it, 104 (34%) traded back past the peak before reaching the textbook's target. These are shapes on candles, not trades, with no costs, on past days only.
A double top is two highs at about the same price with a dip between them, and the low of that dip is the neckline. A double bottom is the mirror. The book's trade is a close through the neckline with a stop past the peaks. Our guide to price action has the shapes, and our word for the pair is M and W reversals.
What is the double top failure rate in our count?
There are two failures to count, and they answer different questions.
| What the 983 shapes did | Count | Share |
|---|---|---|
| Never closed through the neckline that day, or went past the peak first | 680 | 69% of the shapes |
| Closed through the neckline, the book's signal | 303 | 31% of the shapes |
| Of those 303, traded back past the peak before the book's target | 104 | 34% of the 303 |
- The first is the shape that never gave a signal. Nearly seven in ten did not. A chart full of double tops is mostly patterns that nothing came of, and they are not in any diagram.
- The second is the shape that signalled and then failed. One in three did. This is the failure a stop past the peak pays for.
We do not print the rest of the 303 as a success figure. Reaching a drawn target on a candle is not a trade, and a number like that gets lifted out of its sentence and read as a win. Whether these failures can be sorted in advance is below, and on our evidence they cannot.
Published pattern statistics we read use other samples and other definitions, mostly stock charts and failure defined as a small move after the break. Their figures cannot be set beside these.
What rule did we count, on what sample?
The rule was written before the first count and not changed after it, so nothing was tuned to the result. Bottoms use the mirror of each line.
- A peak: a candle whose high is the highest of the 4 candles either side of it.
- A double top: two peaks 2 to 12 hours apart inside one trading day, within 10% of the average daily range of each other, with no candle between them higher than the lower of the two. The average is the 15 trading days before. Each second peak is used once, with the nearest first peak that fits, so one peak can sit in two shapes.
- The neckline: the lowest low between the peaks, at least 25% of the average daily range under the lower peak.
- Closed through the neckline: a close through it by that day's 17:00 New York, with no trade past the higher peak first.
- Back past the peak: from the next candle, for up to 96 candles (a day), a candle traded past the higher peak before reaching the book's target, the pattern's height measured from the neckline. A candle that did both counts as back past the peak.
Sample and dates. Dukascopy's 15-minute bid candles on seven dollar majors and gold, from Monday 6 April to Thursday 1 October 2026: 25 whole weeks and four days, 1,030 market-days. That found 505 tops and 478 bottoms.
What is left out. One shape whose following day ran past the end of 1 October, because its ending was not seen. Patterns across more than one trading day, and any chart other than 15 minutes. Friday 2 October onward. The low of each day's first candle is clipped to its body, because it is often only the spread widening.
Do double bottoms fail as often as double tops?
Close to it, and tops were somewhat worse in this sample. Fewer tops closed through the neckline, and more of those that did went back past the peak.
| Side | Shapes | Never closed through | Closed through | Back past the peak first |
|---|---|---|---|---|
| Double tops | 505 | 367 | 138 | 55 (40%) |
| Double bottoms | 478 | 313 | 165 | 49 (30%) |
We would not lean on that gap. All eight are priced against the dollar, so one stretch of dollar selling or buying can tilt tops against bottoms for all of them, and this is 25 weeks and four days. It is not evidence that double bottoms are the more reliable shape.
Nor did a second peak past the first sort them. Where the second peak traded past the first, 49 of 147 went back past the peak. Where it stopped short, 55 of 156 did. That gap is too small to read anything into.
Does the failure rate differ by market?
It ranged from 9 of 37 on USD/JPY to 24 of 53 on AUD/USD, and those samples are too small to rank anything.
| Market | Shapes | Never closed through | Closed through | Back past the peak first |
|---|---|---|---|---|
| EUR/USD | 124 | 88 | 36 | 15 |
| GBP/USD | 113 | 77 | 36 | 10 |
| USD/JPY | 132 | 95 | 37 | 9 |
| USD/CHF | 114 | 78 | 36 | 12 |
| AUD/USD | 161 | 108 | 53 | 24 |
| USD/CAD | 120 | 76 | 44 | 15 |
| NZD/USD | 111 | 78 | 33 | 10 |
| Gold | 108 | 80 | 28 | 9 |
| All eight | 983 | 680 | 303 | 104 |
What did a failure look like on a real day?
Both days below passed every line of the rule, and both failed within two hours of the signal. We picked them to show the failure, so they say nothing about how often it comes.
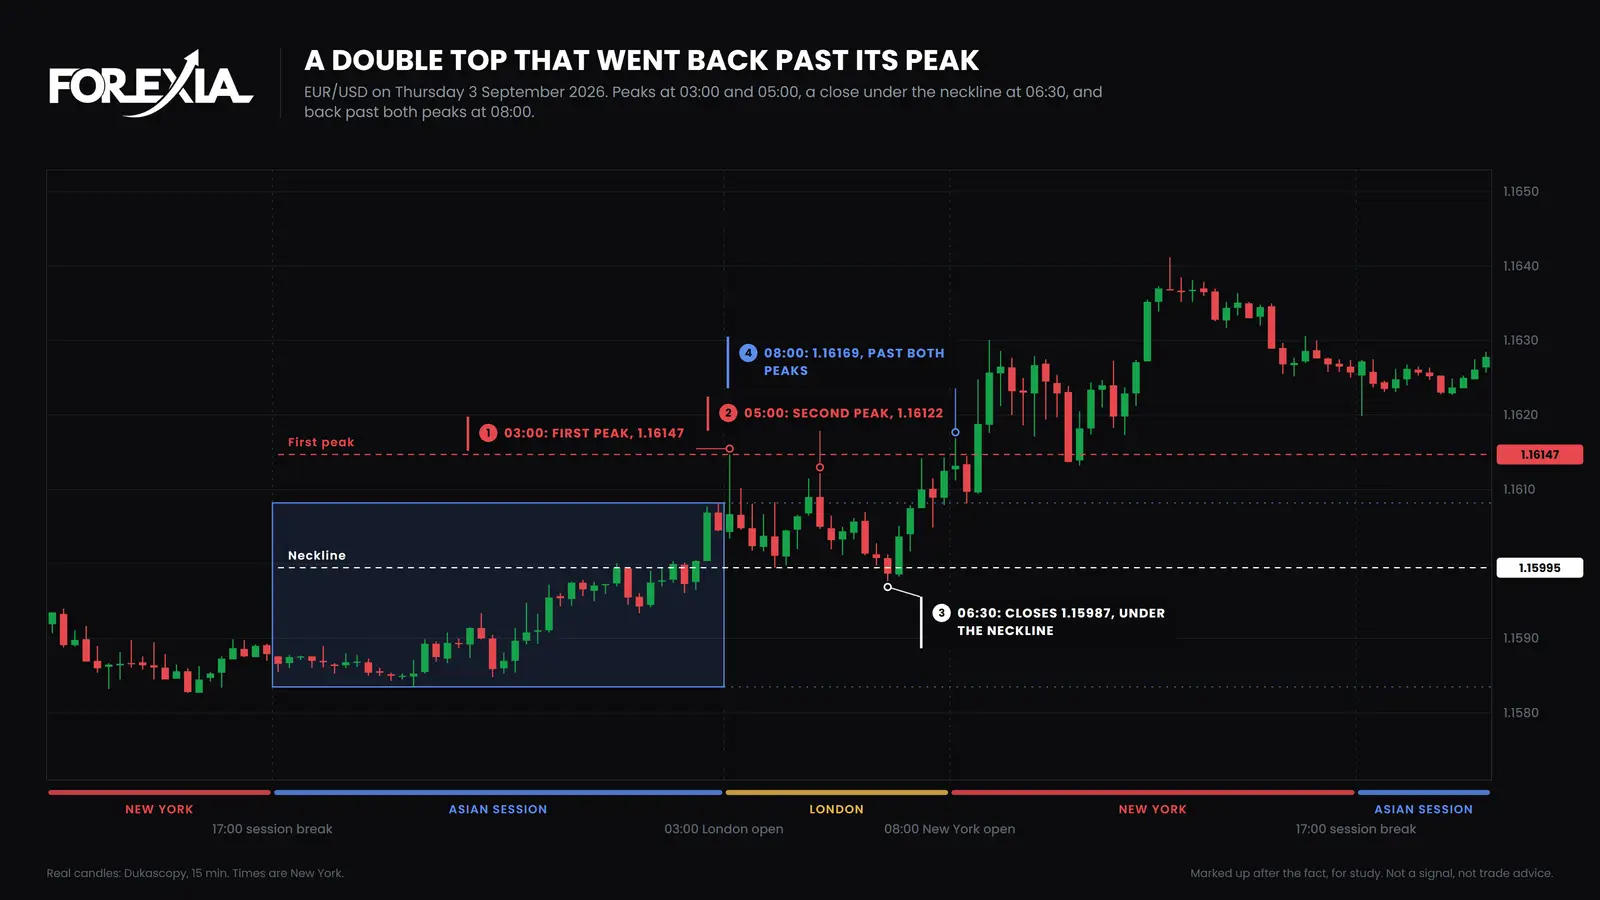
EUR/USD on Thursday 3 September 2026 printed peaks at 1.16147 at 03:00 and 1.16122 at 05:00, with a dip to 1.15995 at 04:00. The 06:30 candle closed at 1.15987, under that neckline by less than a pip: the book's sell. That candle's low of 1.15977 was as far as it went. The 08:00 candle traded to 1.16169, past both peaks. The 08:30 candle, with US jobless claims on the calendar as a medium-impact item, went on to 1.16248. We read the first peak as a hunt of stops over a level, and the book's stop over the peaks as the next pool of them. That is a reading.
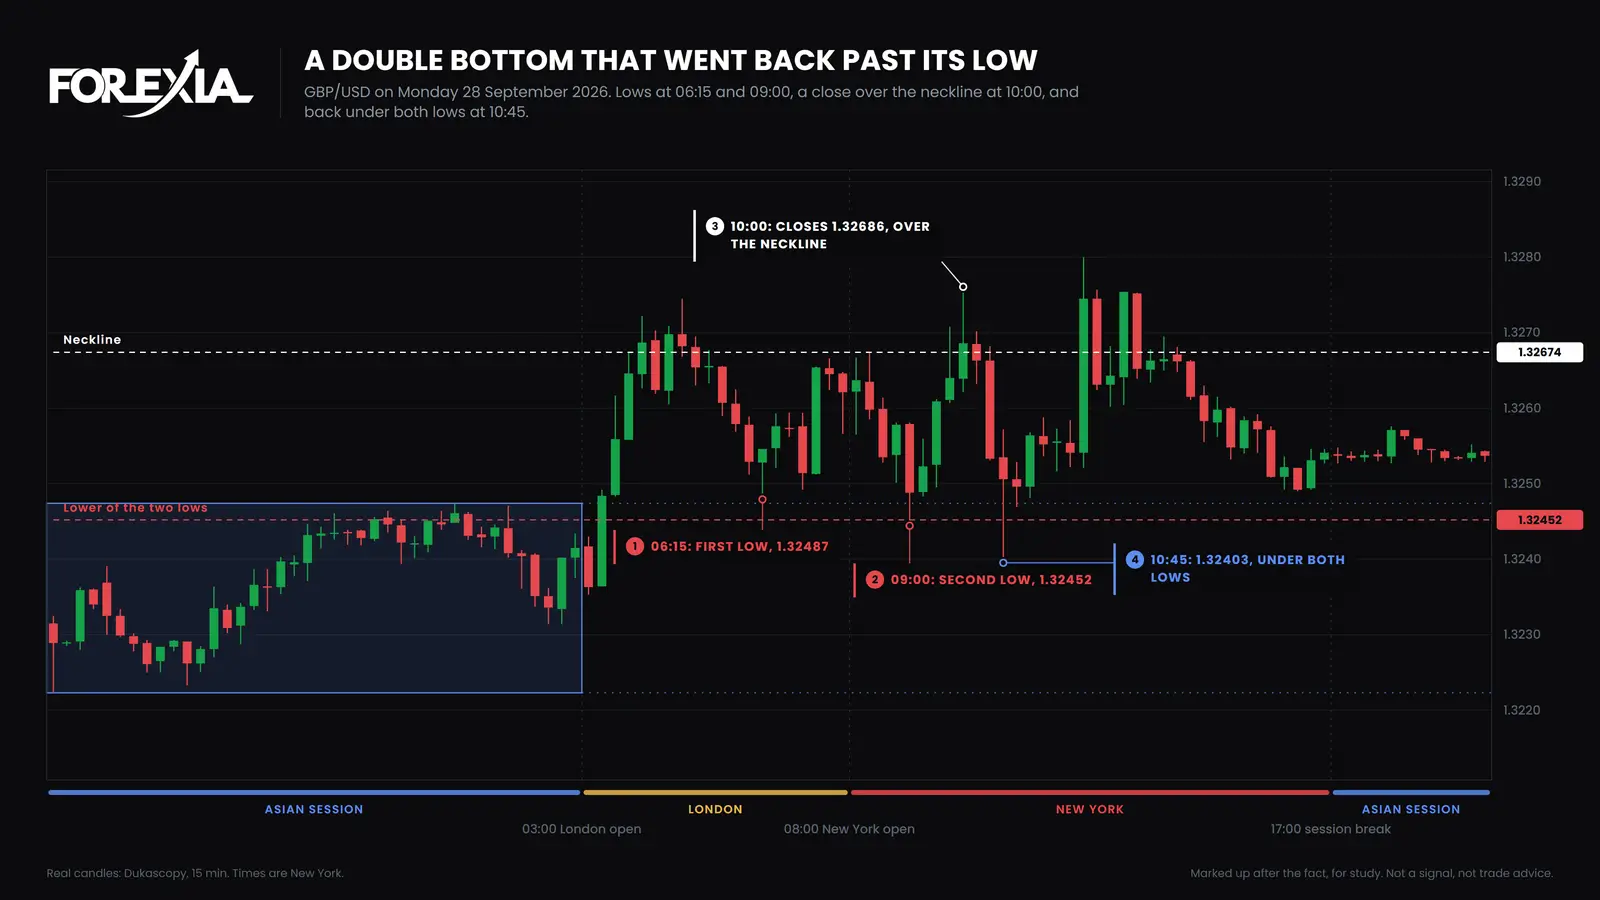
GBP/USD on Monday 28 September 2026 did the mirror. It printed lows at 1.32487 at 06:15 and 1.32452 at 09:00, with a neckline at 1.32674 from the 08:15 candle. The 10:00 candle closed over the neckline at 1.32686: the book's buy. The 10:45 candle traded to 1.32403, under both lows and 5 pips past the lower one, and closed at 1.32506. No high-impact US item was on the calendar that day.
Why this keeps happening is a separate question, and why double tops and double bottoms fail takes it. Other shapes have their own counts, such as which way a rising wedge breaks. What to look for on a chart is in how to spot reverse price action.
What does this count not prove?
It does not prove that a double top is a bad trade or a good one. The limits are these.
- Shapes on candles, not trades. There is no entry, spread, commission, slippage or filter here. A stop past the peak is what the book says, not something we ran.
- Past days only. It covers 25 weeks and four days in one setting of the clocks, on one bid feed.
- A rule we wrote. Another definition of a peak, a gap or a neckline would find other shapes and other counts. Only one chart, 15 minutes, was counted, inside one trading day.
- Not independent. The eight markets move on one dollar, so the same morning can print several of these.
- It does not rescue the opposite trade. A failure seen afterwards is not a reason to fade the next one. Our own test of trading against the hunt, as a fixed rule, lost money after costs, as our liquidity sweep backtest sets out.
- The Stop Hunt is our reading. The candles show price going back past a peak. They do not show who took it there.
Course 3 of ForexiaPRO, Reverse Price Action, teaches this read step by step.
Frequently asked questions
How often do double tops fail?
Counting double tops and double bottoms together on 15-minute forex and gold candles from 6 April to 1 October 2026, 680 of 983 never closed through the neckline that day, or went past the peak first. Of the 303 that did close through it, 104 (34%) traded back past the peak before reaching the textbook's target.
Do double tops fail more often than double bottoms?
A little, in this sample. After a close through the neckline, 55 of 138 tops went back past the peak first, against 49 of 165 bottoms. Eight markets moving on one dollar over 25 weeks is too little to lean on that gap.
Is a double top reliable after the neckline breaks?
Less than the diagrams suggest. About one in three of those that closed through the neckline went back past the peak before the textbook's target. Our count has no costs and no trades, and we do not publish the other side of that figure as a success rate.