Forex Weekly Cycle Examples: Real Weeks Read Day by Day
Dylan Forexia7 min read
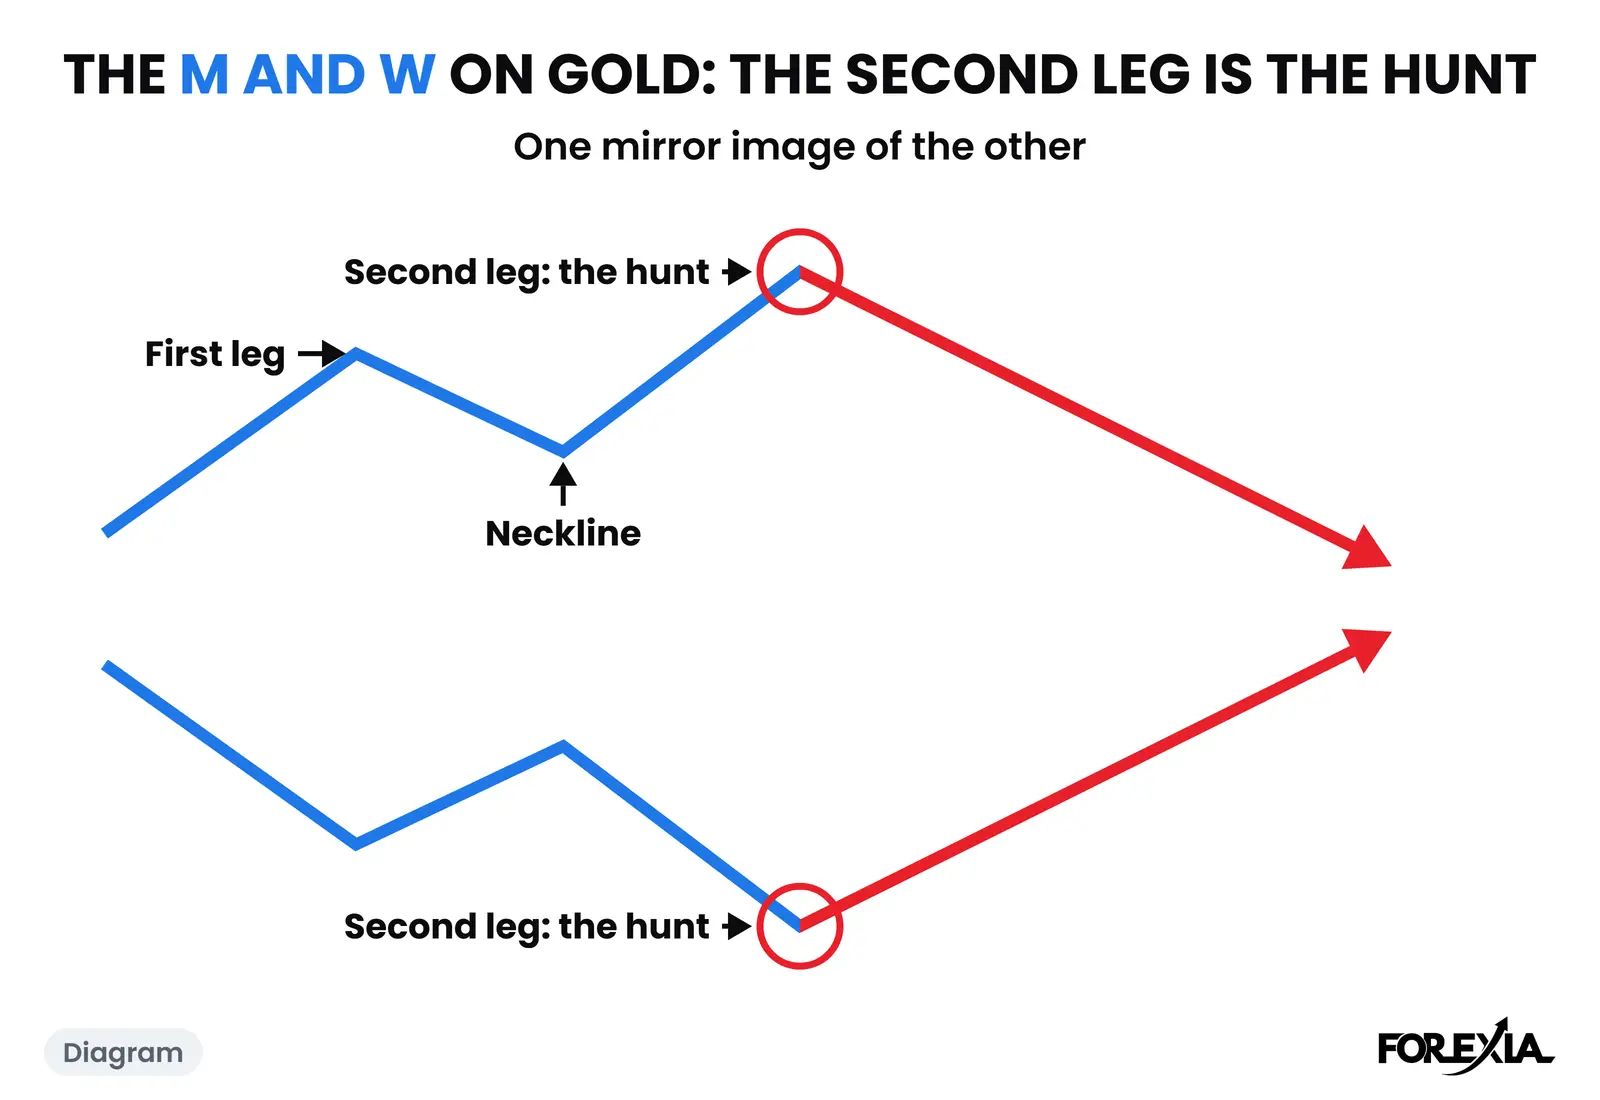
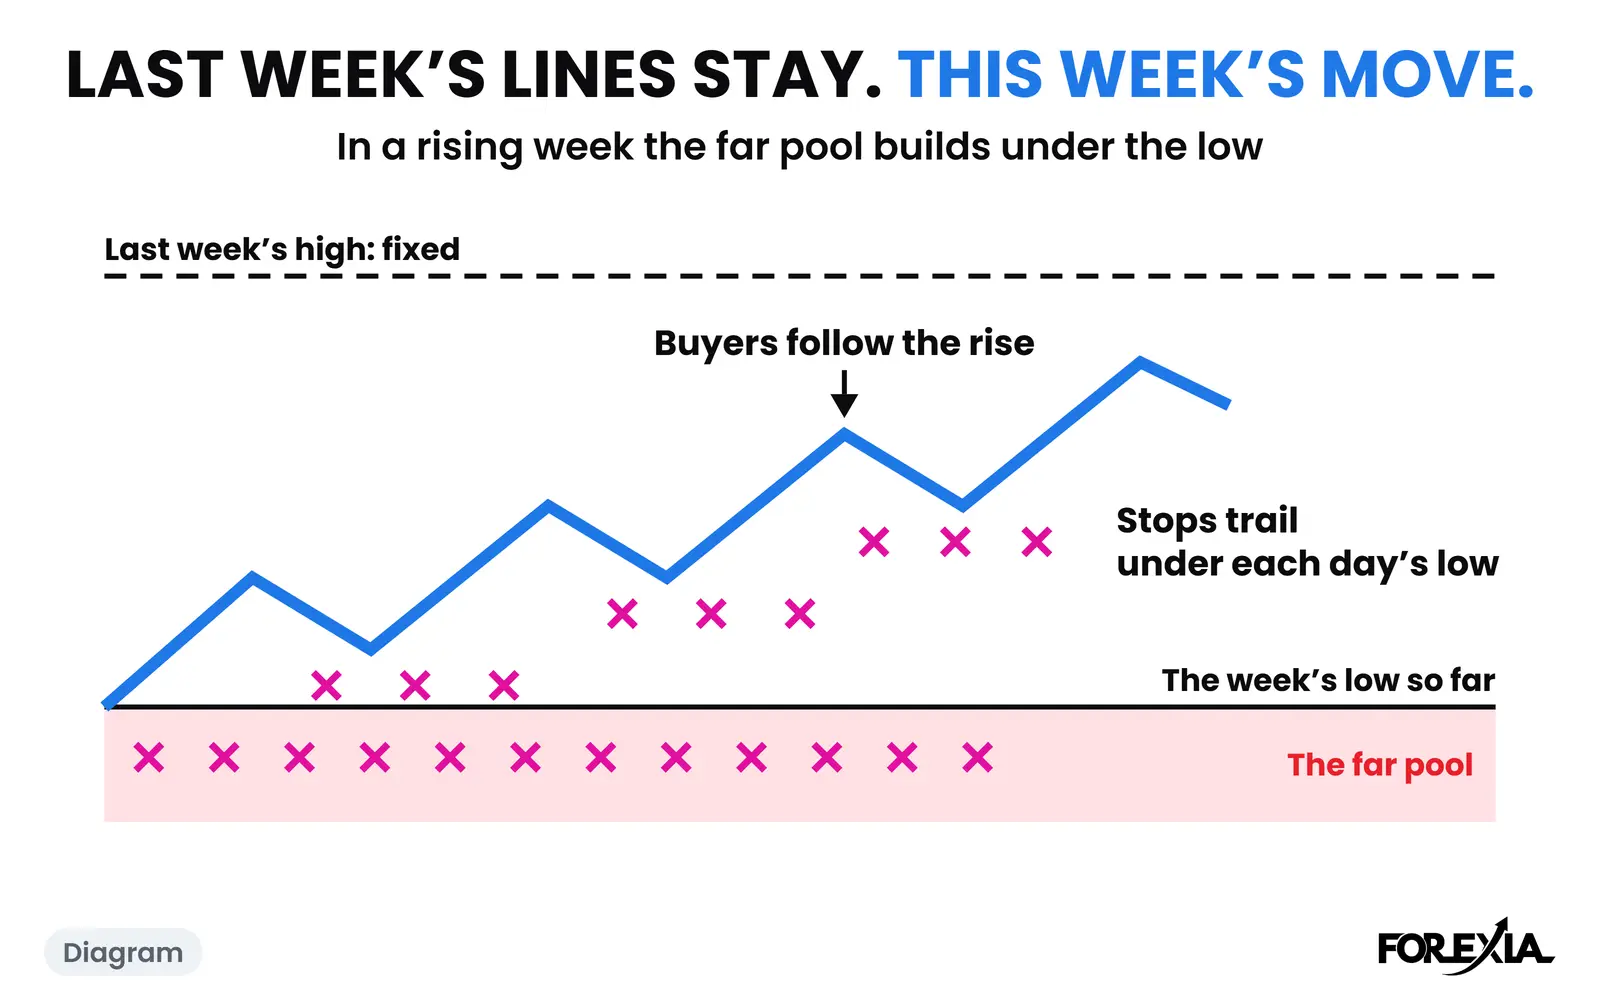
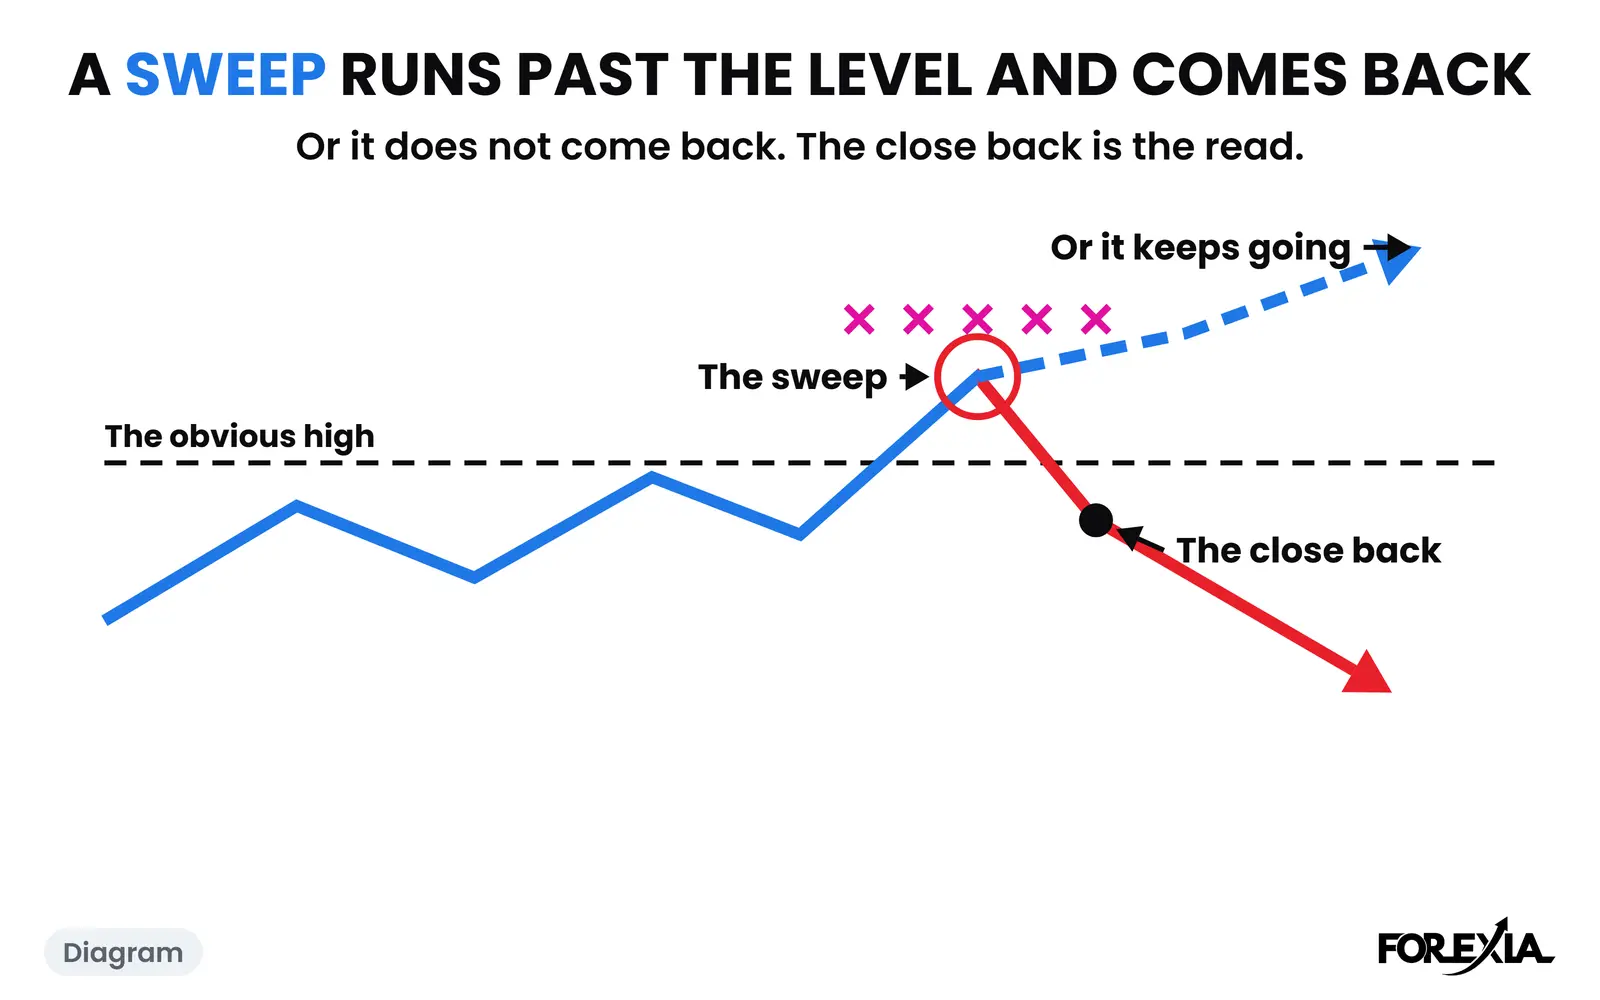
Forex weekly cycle examples are only useful if they include the weeks that did not behave. Here are five real weeks, read day by day: one that played the cycle in order, one that turned a day early, one a day late, one that only partly followed and one that never turned. Each part is named as the induction, the trap or the reversal where it fits, and is explained in the Weekly Script.
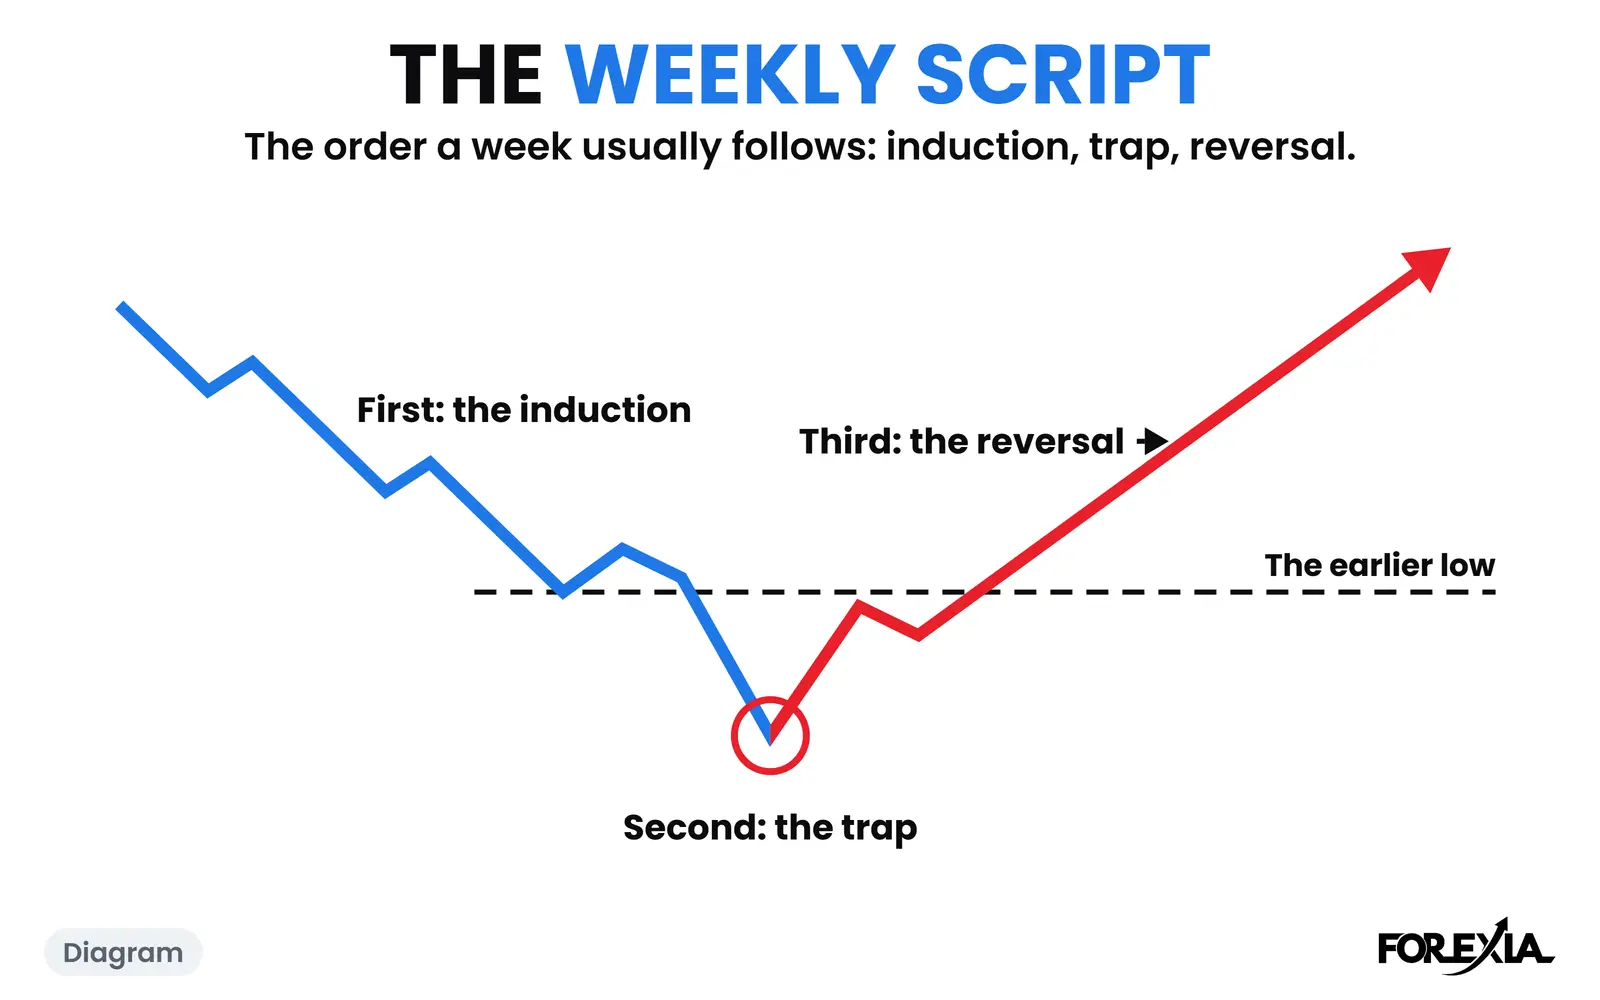
The weeks were marked up afterwards, for study, on Dukascopy candles in New York time. They are chosen examples. One dollar moves several of them, and none is a signal. The overview is in the weekly cycle guide, and how to read the forex week explains the order.
What does a week that plays the cycle in order look like?
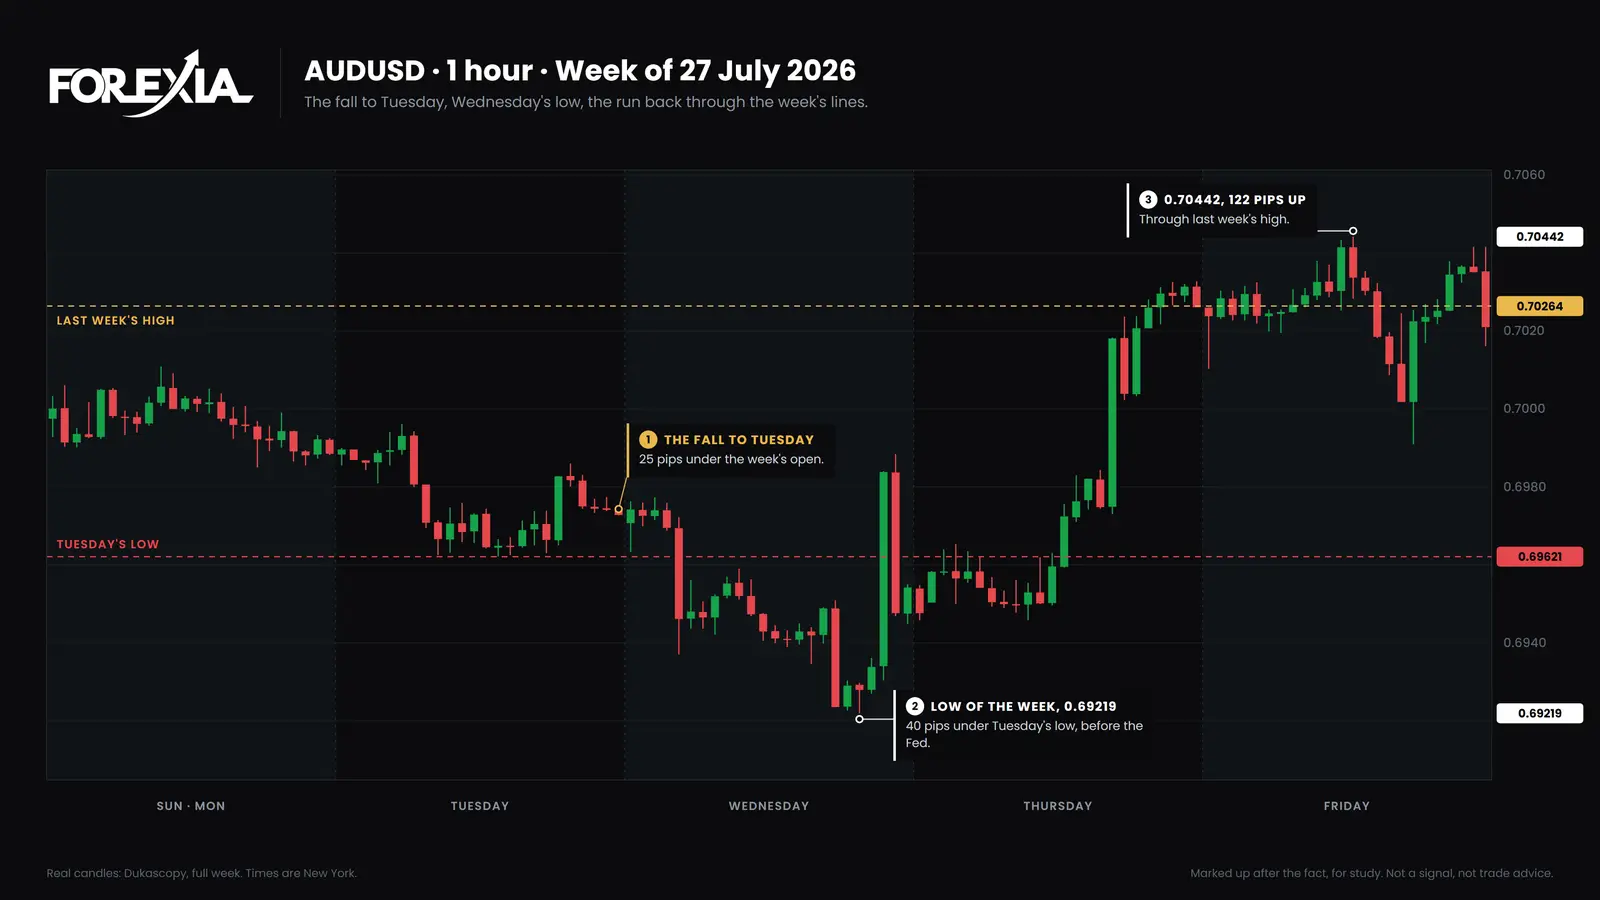
AUD/USD in the week of 27 July 2026 played all three parts. Each day runs from the 17:00 break before it.
| Day | High | Low | Close | Its part |
|---|---|---|---|---|
| Sun and Mon | 0.70109 | 0.69850 | 0.69885 | The induction starts |
| Tuesday | 0.69961 | 0.69621 | 0.69728 | More of it, closing 25 pips under the open |
| Wednesday | 0.69884 | 0.69219 | 0.69542 | The trap, around the Fed |
| Thursday | 0.70328 | 0.69458 | 0.70261 | The reversal runs through the week's lines |
| Friday | 0.70442 | 0.69909 | 0.70210 | It goes on, then gives some back |
The week opened at 0.69975. The low of the week came at 12:15 New York on Wednesday at 0.69219, 40 pips under Tuesday's low, and the Fed's decision at 14:00 came nearly two hours after it. The 14:30 candle closed back over Tuesday's low at 0.69707. On Thursday a candle closed over last week's high of 0.70264 by 12:15, and at 05:00 on Friday price reached 0.70442, 122 pips off the low.
What does a week that turns a day early look like?
Gold in the week of 11 May 2026 made its high in Tuesday's session. It opened at 4681.26 and closed Monday at 4735.19, 54 pips higher. We count $1 as 1 pip. Monday's high was 4748.48. At 20:15 that night, already Tuesday's session, gold reached 4773.34, the high of the week, 25 pips over Monday's high. The 21:00 candle closed back under it.
US CPI came at 08:30 on Tuesday, about 12 hours later, and that candle stayed inside 19 pips. Gold fell through the week's open at 09:45 and wicked under Monday's low at 11:15, to 4638.23, then bounced 88 pips by that evening. The first close under Monday's low came late on Thursday, and by 09:45 on Friday gold was at 4511.22, 262 pips off the high.
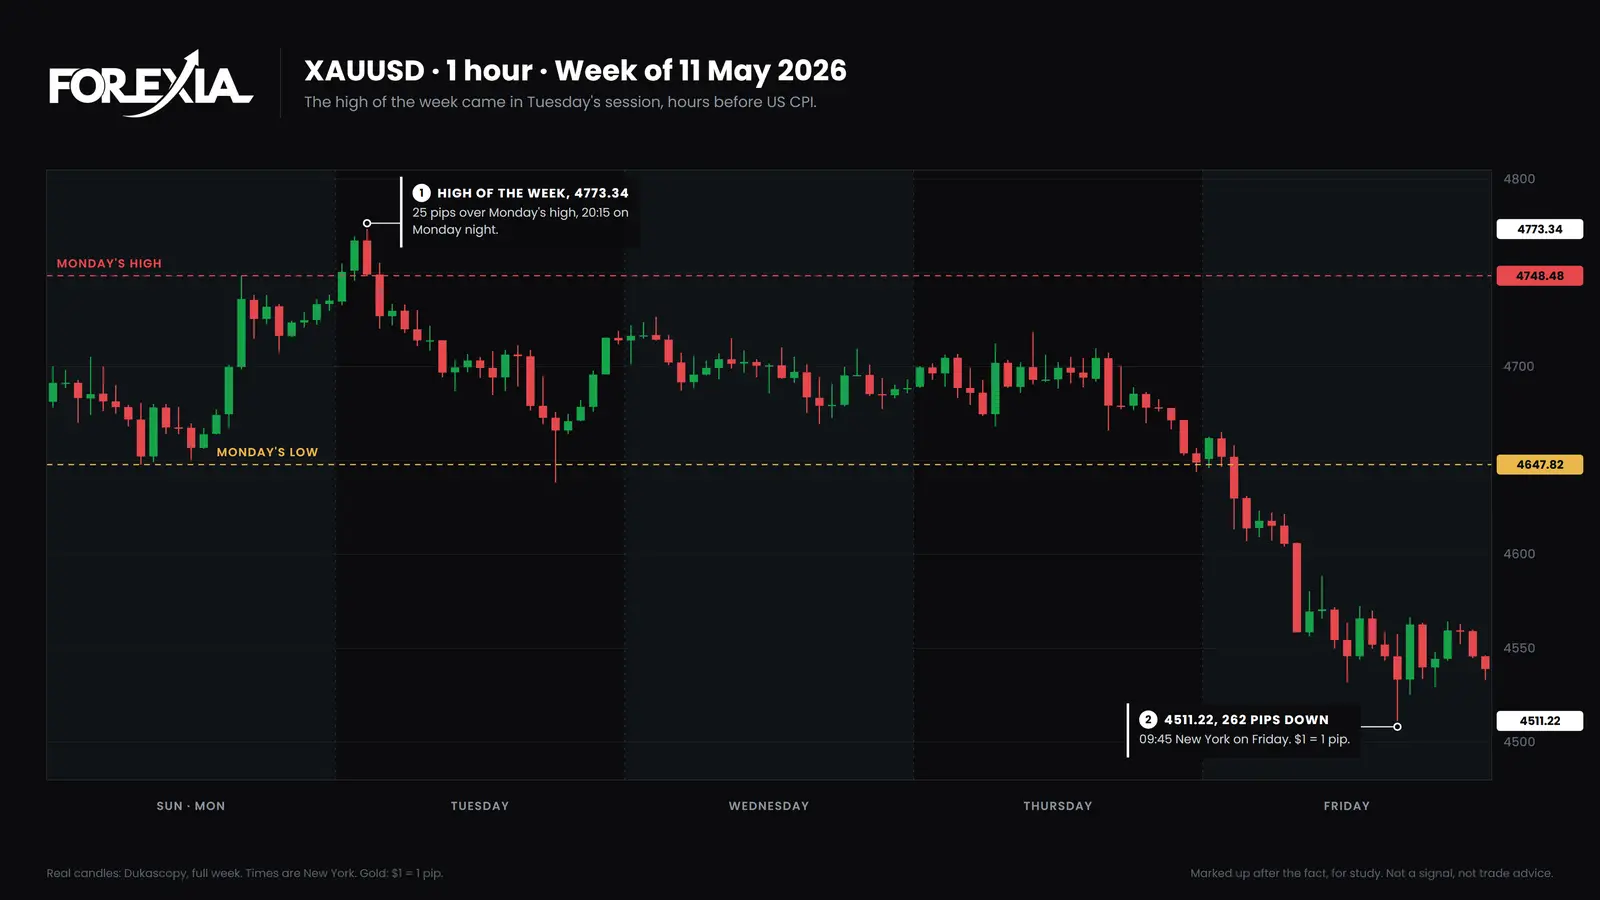
On the Tuesday Anchor reading, this is a Tuesday turn. It came before the inflation release, and not because of it.
And a week that turns a day late?
GBP/USD in the week of 27 April 2026 had no induction. By Tuesday's close the pound was 15 pips from its 1.35001 open, after a range from 1.34628 to 1.35758. The low of the week came at 02:00 on Thursday at 1.34539, 3.5 pips under Wednesday's low, on a candle that closed back over it. By 10:15 on Friday the pound was at 1.36576, 204 pips off the low. Thursday reversal forex reads that week candle by candle.
What does a week that only partly follows look like?
GBP/USD in the week of 31 August 2026 followed some of it. From Sunday to Tuesday it ranged, only 16 pips net between 1.35058 and 1.35651. On Wednesday at 08:45 New York it made the low of the week, 1.34743, which was 91 pips under Monday's high and 31 pips through Tuesday's low. That is more than a stop hunt. The rise that followed reached 1.35490 by Friday, 75 pips in 42 hours and 45 minutes, and gave back 82% of the fall. The sellers' stops we read above Tuesday's high, 1.35594, were not reached.
It had the low on Wednesday, so the turn was there. It lacked the induction, the clean hunt and the full run, and the week's own write-up counted one of four checks held. The same week on gold held all four, so the same dollar produced a textbook week and a partial one. How to review a forex trading week sets out the checks.
What does a week that never turns look like?
USD/CAD in the week of 21 September 2026 opened at 1.39815 and closed every day higher: 1.40341, 1.40616, 1.41007, 1.41346, 1.41371. It even offered a trap to point at. In Wednesday's session price edged over Tuesday's high of 1.40838, by about a pip at first and never by more than 10, and 15-minute candles closed back under it on and off until 09:15. Then it rose for two more days, to a high of 1.41543 at 03:00 on Friday.
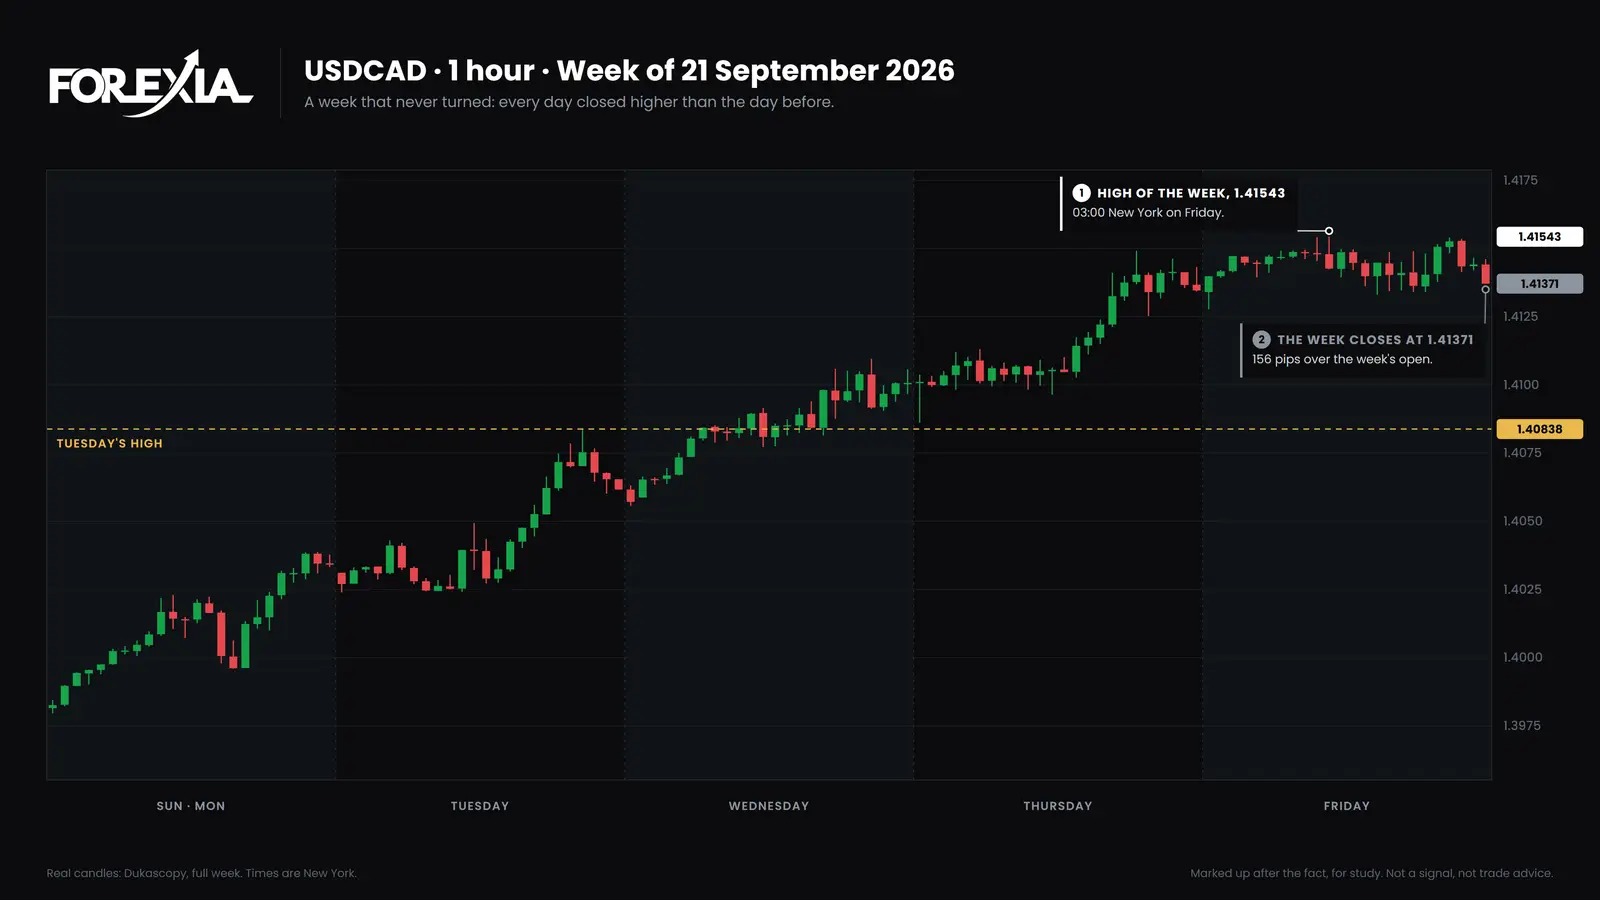
In the same week USD/JPY rose to a high of 159.034 on Thursday and fell 210 pips to 156.938 by Friday. Same dollar, two stories. Our weekly cycle charts never show a week like USD/CAD's, because we only draw one when the week turned, and that is the biggest limit on every example above.
What do these forex weekly cycle examples have in common?
They share a way of being read and very little else. Here are the five weeks side by side, with the part of the cycle that differed in each, so a reader can see what moved and what stayed put. Each row is one market's week, chosen after it finished.
| Week | Where the turn came | Part that differed |
|---|---|---|
| AUD/USD, 27 July 2026 | Wednesday | None: the order held |
| Gold, 11 May 2026 | Tuesday's session | A day early |
| GBP/USD, 27 April 2026 | Thursday | A day late, no induction |
| GBP/USD, 31 August 2026 | Wednesday | Ranged, a deeper run past the level, partial reversal |
| USD/CAD, 21 September 2026 | Never | No turn at all |
What they share is the order of the questions and not the order of the days: where is the crowd, which level has gone, did price close back. The order of the parts held on the weeks that turned. The day of the turn moved on three of the five rows, and one row had no turn to move.
What can these examples not tell you?
They cannot tell you that this week will turn, on which day, or how far it will run, and five weeks are too few to put a rate on any of it. Every one was chosen after the week ended, which flatters the idea, and a reversal seen afterwards is not a setup. Our own test of the daily setup as a mechanical rule did not make money. What the WTF Reversal is takes the run in the second half of the week further, and forex average range by weekday shows how big each day usually is.
Sources
All figures are read from our weekly-cycle chart write-ups, on Dukascopy candles in New York time. The GBP/USD week of 31 August 2026 is from the weekly-cycle write-up of that week, and the others from the weekly-cycle hub's text. The Fed's 14:00 decision time is on its meeting calendar.
Course 4 of ForexiaPRO, The Week, in production, teaches reading real weeks like these.
For study only. This page is not a signal and not trade advice. Charts are Dukascopy candles, marked up after the fact.
Frequently asked questions
What are examples of the forex weekly cycle?
AUD/USD in the week of 27 July 2026 played it in order, with the low of the week on Wednesday. Gold in the week of 11 May turned a day early, GBP/USD in the week of 27 April a day late, and USD/CAD in the week of 21 September never turned.
Do all forex weeks follow the weekly cycle?
No. We only draw a weekly cycle chart when the week turned, so every example here was chosen after the week ended. They show what the cycle looks like and say nothing about how often it happens.
What does a partly followed week look like?
GBP/USD in the week of 31 August 2026 ranged from Sunday to Tuesday, ran 31 pips past Tuesday's low on Wednesday and gave back 82% of its fall before the rise. The low of the week came on Wednesday, and only one of four checks held.