How to Read the Forex Week: The Weekly Script on a Real Week
Dylan Forexia6 min read
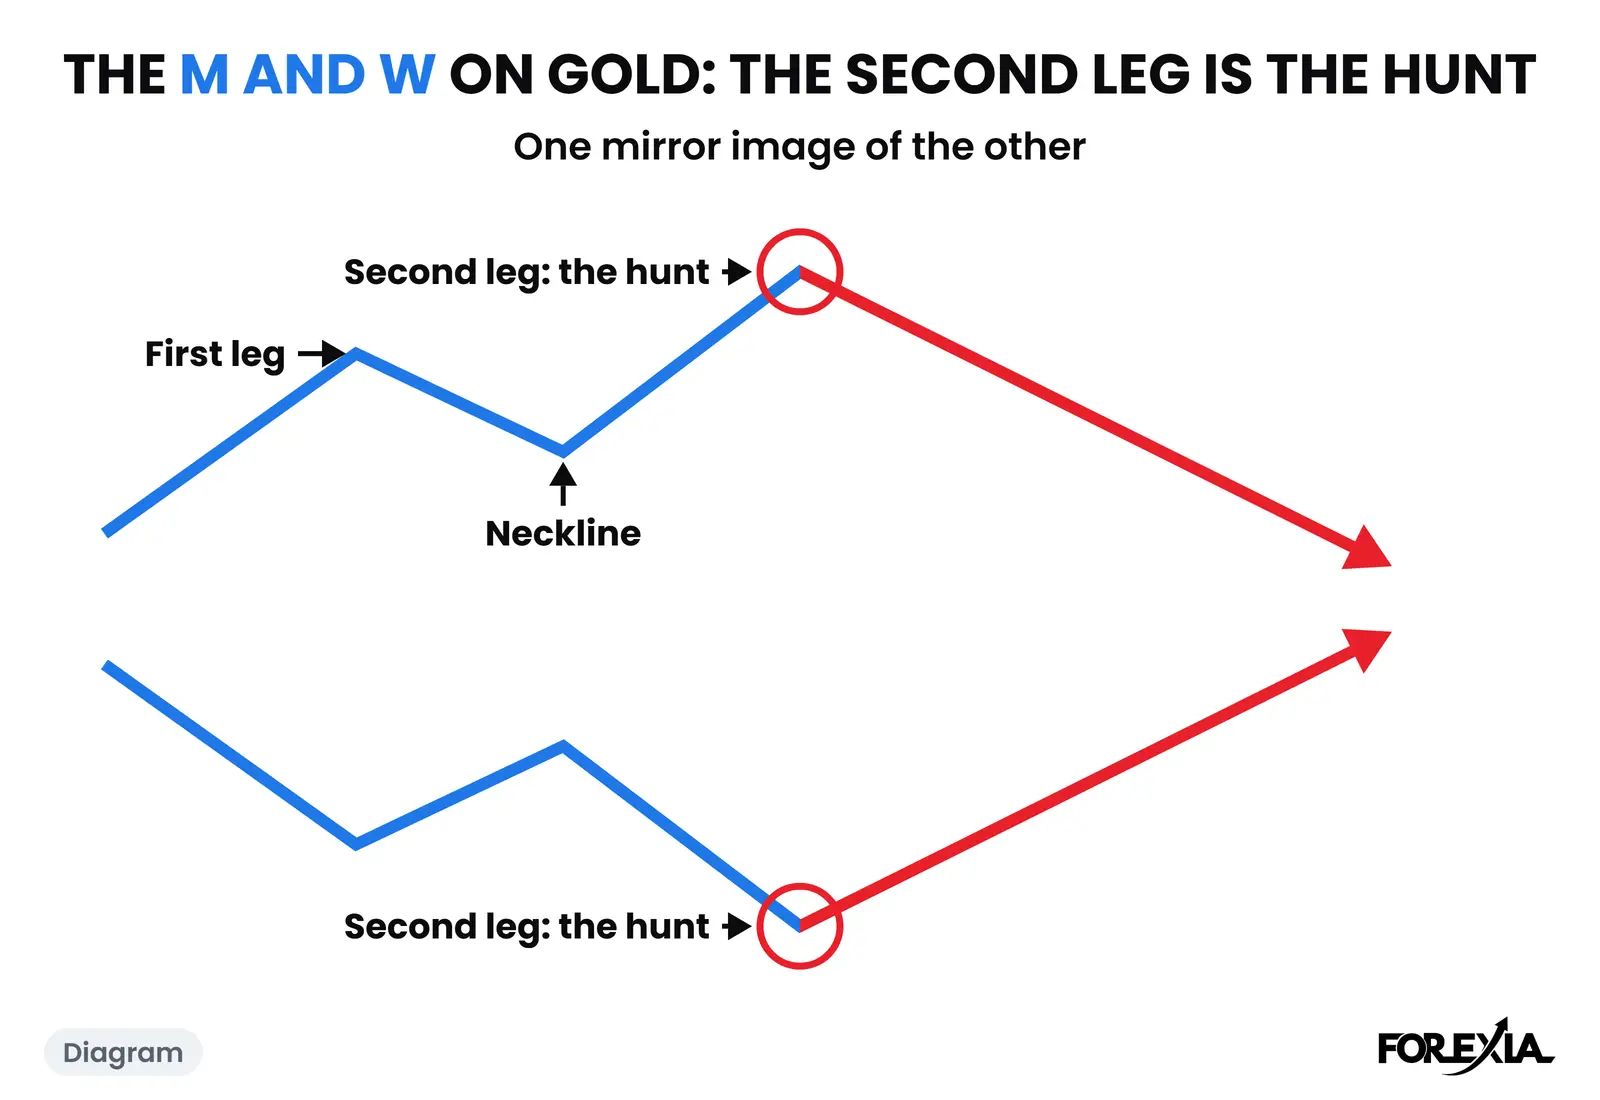
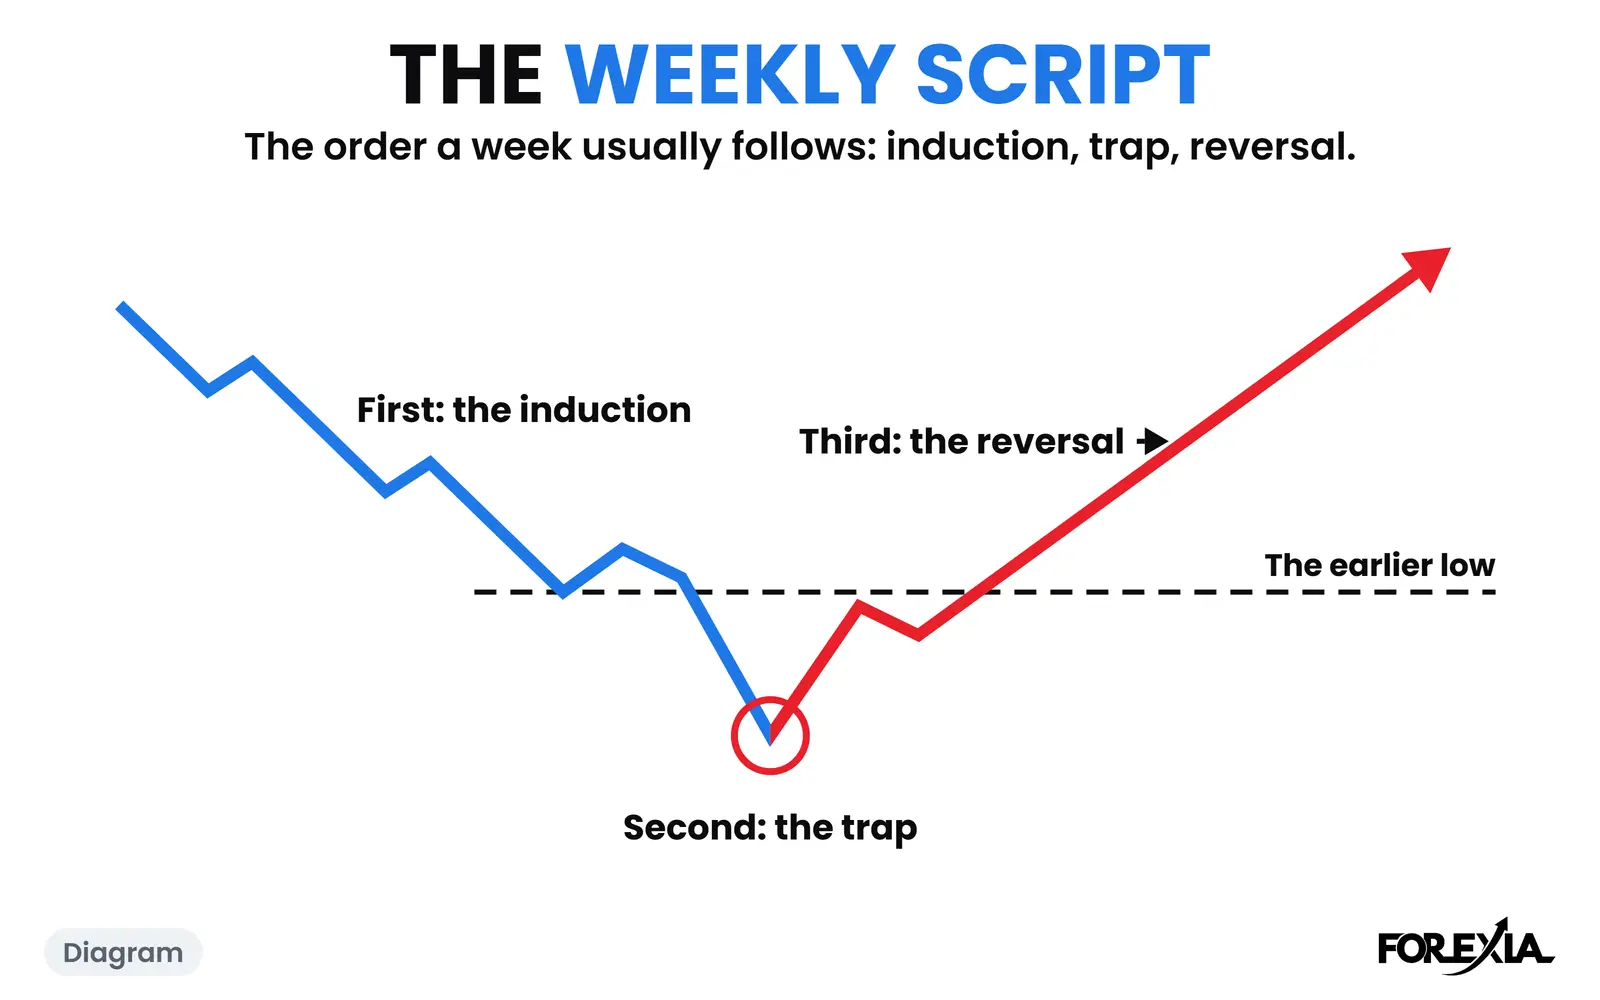
How to read the forex week: ask which of three parts it has reached, a trend that pulls the crowd in, a trap past an earlier extreme, or the reversal back through the crowd's stops. We call that order the Weekly Script. It is a way of reading what the candles did, day by day, and some weeks never play it.
This page reads one real week from Sunday to Friday, then shows a week that did not follow it. The wider guide to the weekly cycle sets out each part, and forex weekly cycle examples collects more weeks.
How do you read the forex week, day by day?
You read it as a sequence and ask one question each day: which part is this? A forex day here runs from the 17:00 New York session break to the next, so Sunday evening already belongs to Monday and Tuesday evening already belongs to Wednesday. Reading by calendar date alone puts a Tuesday night candle on the wrong day.
The three parts have names.
- The induction. The Induction Trend is the trend of Sunday, Monday and Tuesday that dumb money follows. It looks like the easy trade.
- The trap. The Midweek Trap is a run past an earlier day's extreme, usually on Wednesday. Whether it was a trap is only known when price closes back.
- The reversal. The WTF Reversal is the run back through the herd's stops on Wednesday, Thursday and Friday, toward the Week's High and Low.
"Plan" and "market makers" are our reading of why the order repeats. Spot forex trades over the counter, so no public book shows anyone's stops. What can be shown is the order of the candles.
What does a real week look like?
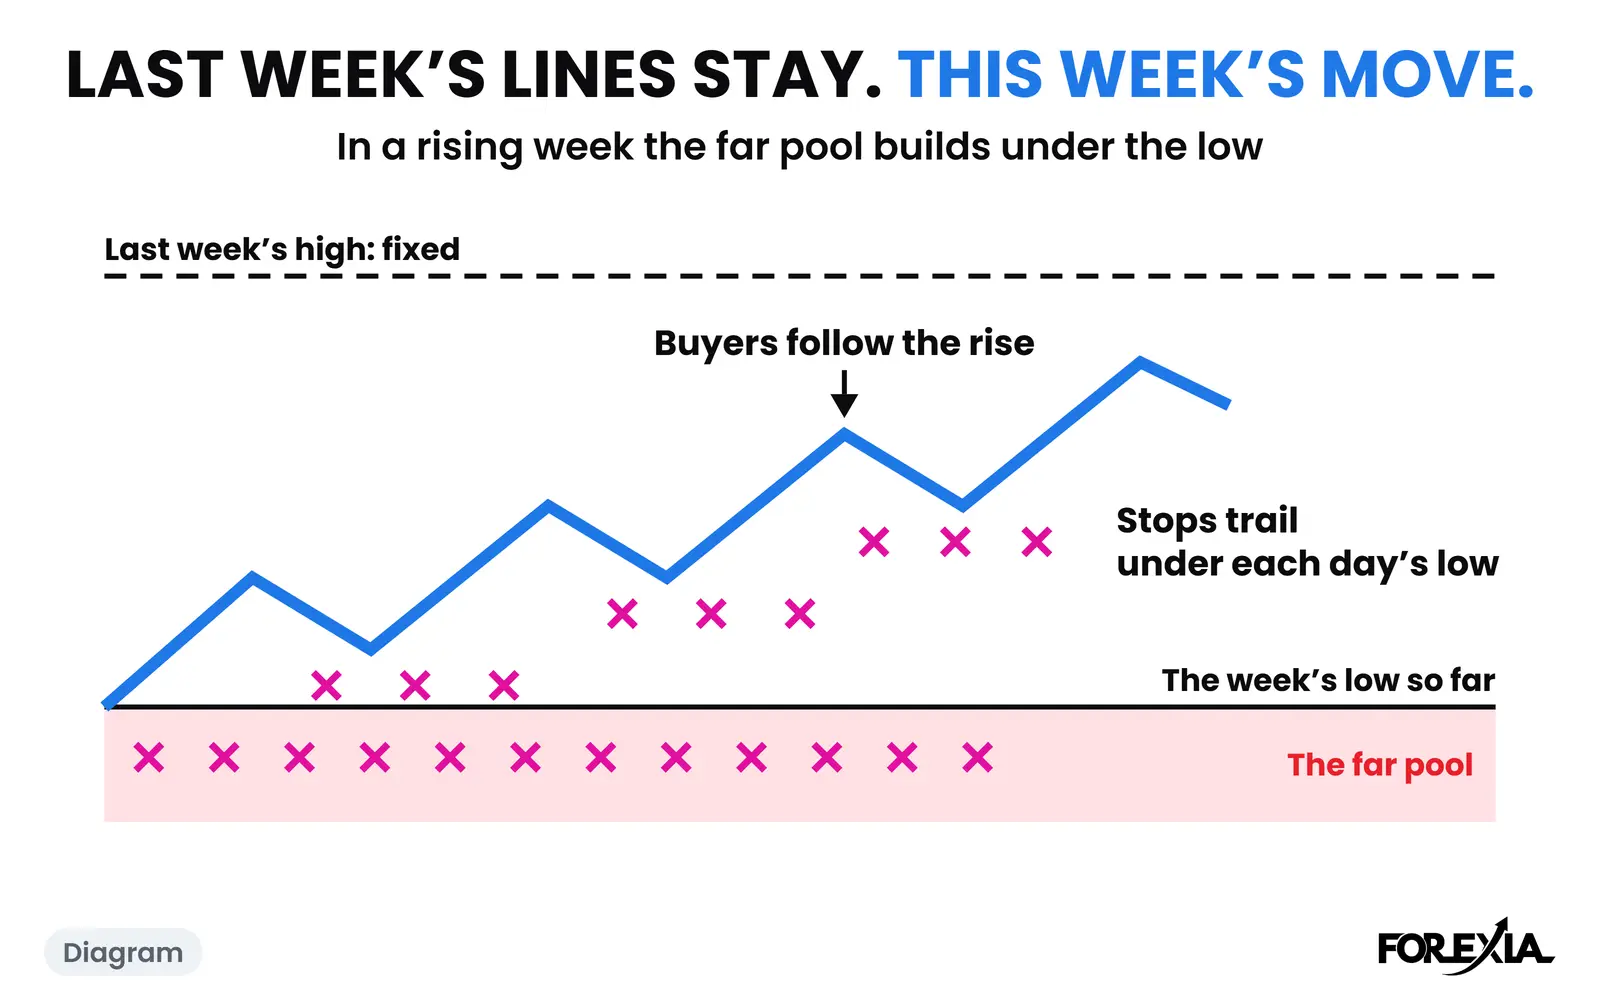
AUD/USD in the week of 27 July 2026 played all three parts, and each can be read from the numbers. The week opened at 0.69975. Monday closed at 0.69885 and Tuesday at 0.69728, 25 pips under the open, with Tuesday's low at 0.69621. Selling had been right twice, and we read the sellers' stops as trailing over each day's high. That is the induction.
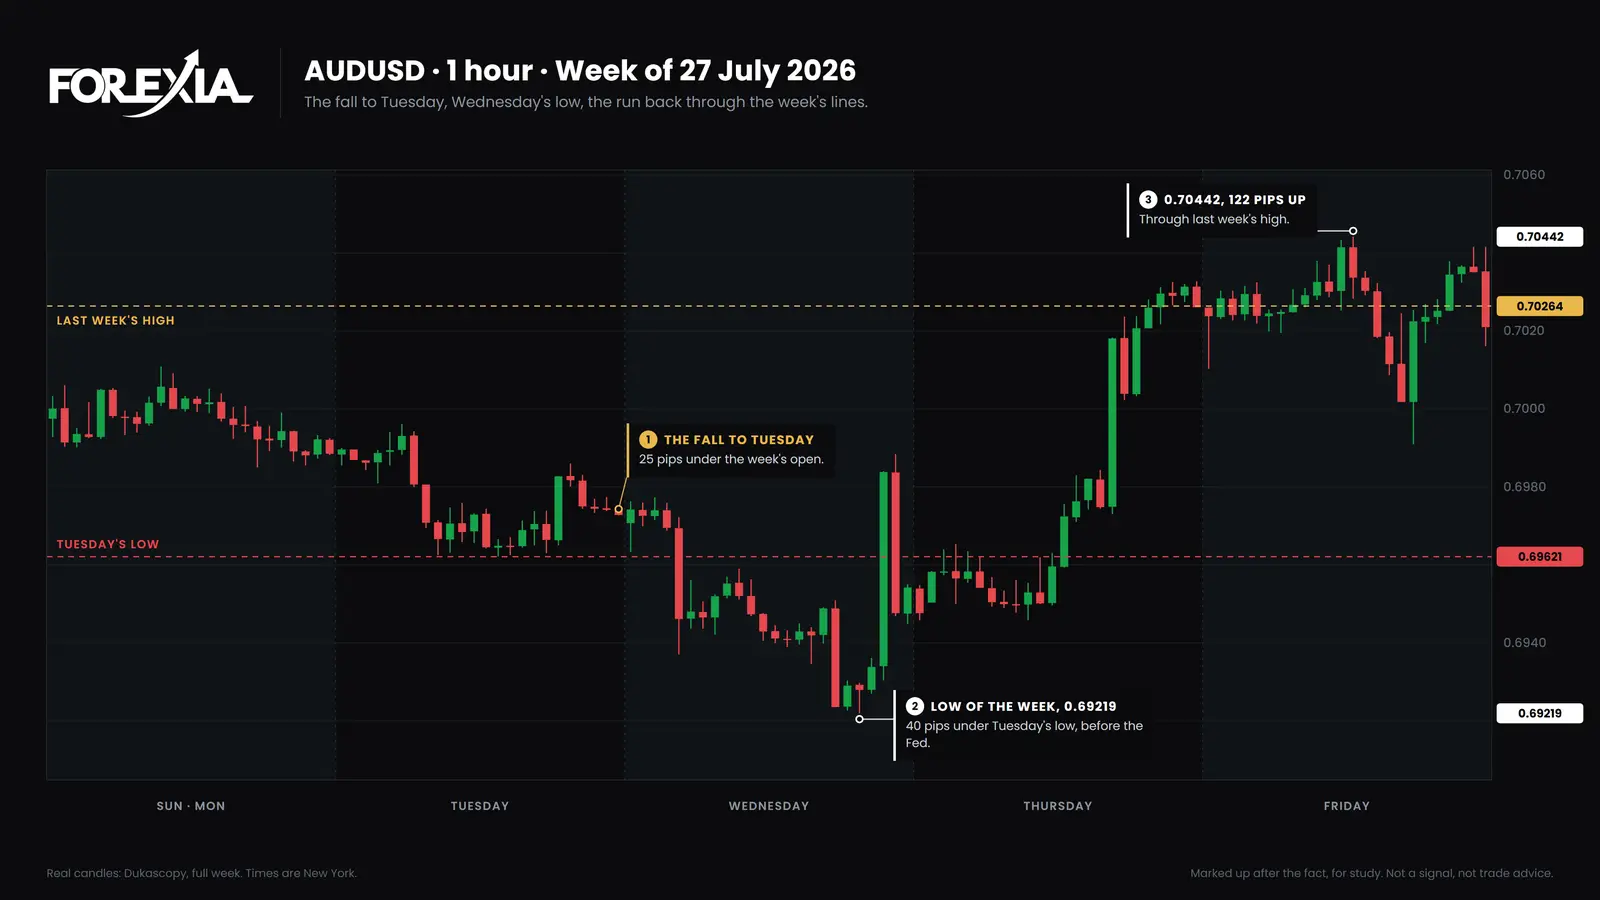
- The induction, Sunday to Tuesday. Two down days, each with a lower low. Anyone selling was ahead.
- The trap, Wednesday. Tuesday's low went at 21:30 on Tuesday evening, in Wednesday's session, when Australian CPI landed: that candle fell to 0.69370. The low of the week came at 12:15 on Wednesday at 0.69219, 40 pips under Tuesday's low. The Fed's decision came at 14:00, nearly two hours after the low, and the 14:30 candle closed back over Tuesday's low at 0.69707. Wednesday still closed under that line, at 0.69542, so even the close back was not clean.
- The reversal, Thursday and Friday. On Thursday the 09:30 candle closed at 0.70043, over Tuesday's high and the week's open. The 09:45 candle closed over Monday's high at 0.70181, and by 12:15 a candle had closed over last week's high of 0.70264. At 05:00 on Friday price reached 0.70442, 122 pips off the low. Friday then gave some back, to 0.69909 at 10:00, and the week closed at 0.70210.
Each part sat where the name puts it, and each only looked like a part afterwards. At 09:00 on Wednesday a seller saw a trend and a break lower.
What can you read on the Sunday before the week starts?
Very little, and it is worth knowing how little. On the Sunday before that AUD/USD week, last week's high was 0.70264 and its low 0.69618, 65 pips apart, with one rollover print left out. The week opened at 0.69975, 19 pips over Friday's close and nearer the high than the low. The calendar held Australian CPI and a Fed decision, both in Wednesday's session.
That is a map of where stops are likely to rest, and nothing in it said which line would go first. Both went that week. The forex weekly outlook sets out what goes on a Sunday map and what does not.
What does each seat see during that week?
The Three Seats read the same candles differently. Retail takes each day as a new trade: a trend on Monday, more of it on Tuesday, a breakdown on Wednesday. The market maker, on our reading, has one plan across the five days: bring the crowd in, take its stops, run the other way. The observer asks only which part the week has reached and which one could come next.
On the AUD/USD week the seller's problem was timing. Being right on Monday and Tuesday said nothing about Wednesday afternoon. A bias to sell was correct for two days and wrong from the Fed. That gap, between a direction that is right and a position that survives, is what why you lose money trading a trend is about.
Does every week follow the script?
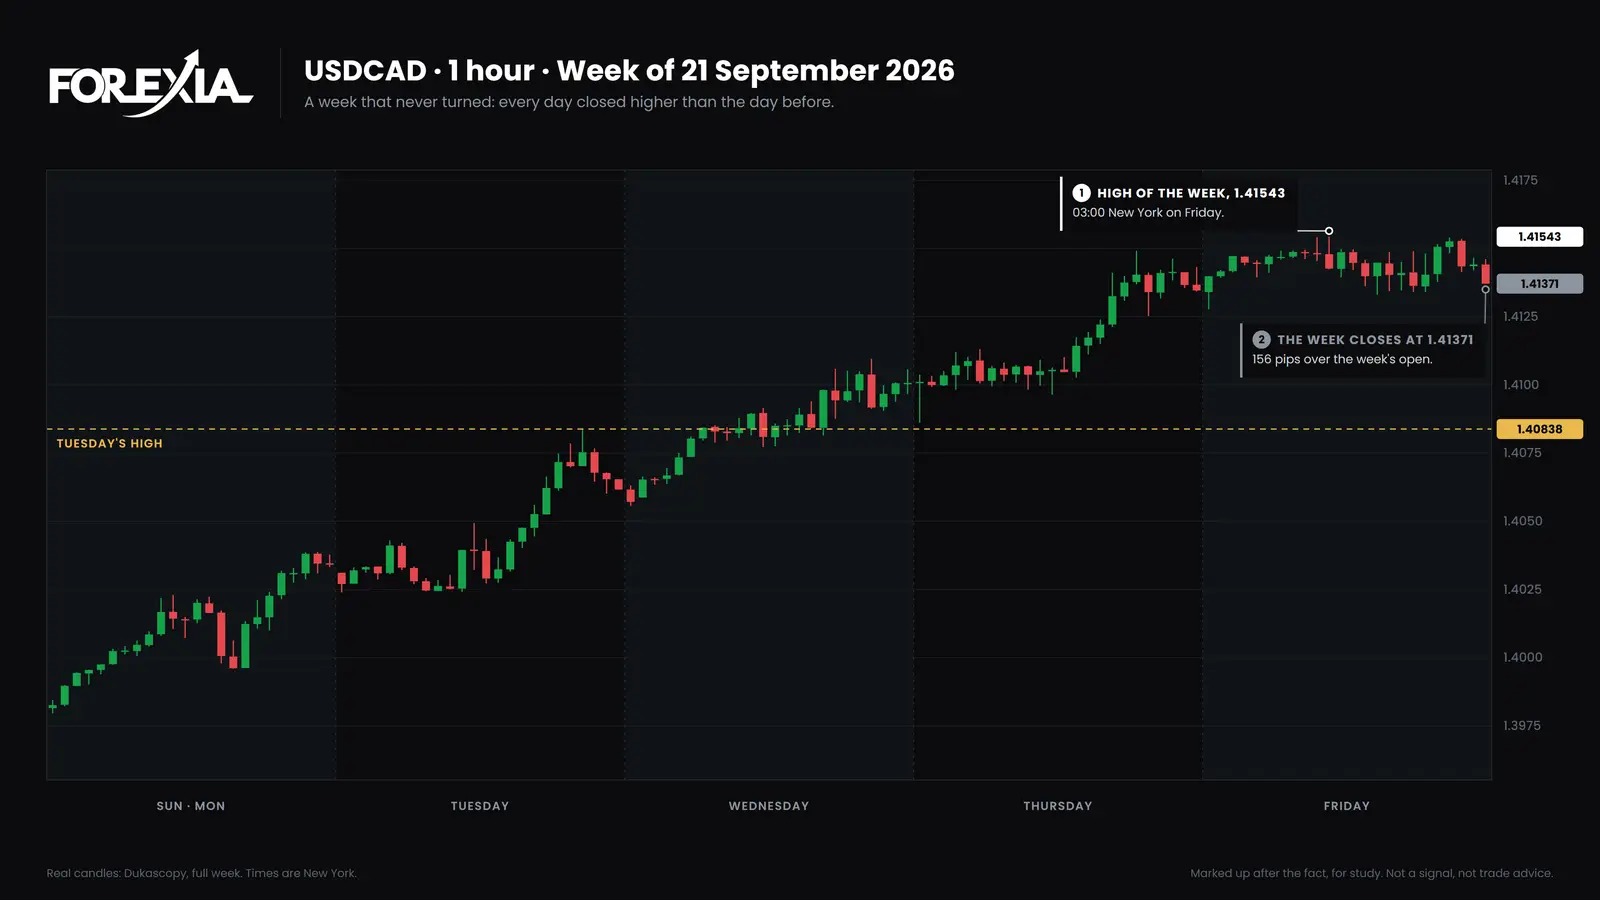
No, and the weeks that do not are the ones that teach most. USD/CAD in the week of 21 September 2026 opened at 1.39815 and closed higher on every day: 1.40341, 1.40616, 1.41007, 1.41346, 1.41371. On Wednesday's session price even edged over Tuesday's high of 1.40838, by about a pip at first and never by more than 10, and 15-minute candles closed back under it on and off until 09:15. That is the picture of a hunt and a close back, and it was neither. It rose for two more days, to a high of 1.41543 at 03:00 on Friday.
The same week, USD/JPY rose to 159.034 on Thursday and fell 210 pips to 156.938 by Friday. Same dollar, two stories, so nothing on the calendar told you which week you were in.
Some weeks also turn a day early or a day late. Gold's low in the week of 27 July 2026 came on Wednesday, while the euro's came on Tuesday, and on USD/CHF in the week of 28 September the trap came on Thursday. Thursday reversal forex takes up those late turns.
What can this read not tell you?
It cannot tell you that this week will turn, or when. It describes a finished week, and every example here was chosen after it ended. We draw a weekly chart only when the week turned, so the charts are not a sample, and a reversal you can see afterwards is not a setup. Our own test of the daily setup as a mechanical rule did not make money.
What the read gives you instead is a question for each day. Early in the week, ask whether the trend is easy and who has joined it. Midweek, ask which line price has just gone past and whether it came back. Late in the week, ask what the run has gone through and what is left. How to spot a mid-week reversal and what the WTF Reversal is take the last two further. A week marked up in full is on the 4 May 2026 weekly cycle page.
Sources
The figures come from our own chart markups, drawn on Dukascopy candles in New York time. Releases are from the calendar the markups use.
- AUD/USD, week of 27 July 2026, and USD/CAD and USD/JPY, week of 21 September 2026: the weekly-cycle chart write-ups.
- The Federal Reserve's meeting calendar, for the 14:00 decision.
Course 4 of ForexiaPRO, The Week, in production, teaches this read step by step.
For study only. This page is not a signal and not trade advice. Charts are Dukascopy candles, marked up after the fact.
Frequently asked questions
How do you read a forex week?
Ask which of three parts the week has reached: the trend of Sunday to Tuesday that pulls the crowd in, a trap past an earlier extreme, or the reversal through the crowd's stops. The order is our read of the candles, and it can only be named with certainty once the week has turned.
Does every forex week follow the weekly script?
No. USD/CAD closed higher on every day of the week of 21 September 2026 and never turned. We only draw a weekly chart when the week turned, so every example here was chosen after the week ended.
What is the market maker weekly cycle?
It is the same order seen from the market maker's seat: bring the crowd in with an easy trend, take its stops, then run the other way. Nobody outside can show that a plan exists. Only the order of the candles can be shown.