
The Midweek Trap: A Multi-Day M on One Real Week, Read Candle by Candle
The Midweek Trap is Wednesday's trap: a multi-day, multi-session M. It is the last push of a rising week, run past an earlier day's high, and it looks like the moment the trend is confirmed. "Trap" is our reading of what the shape does to the people who trust it.
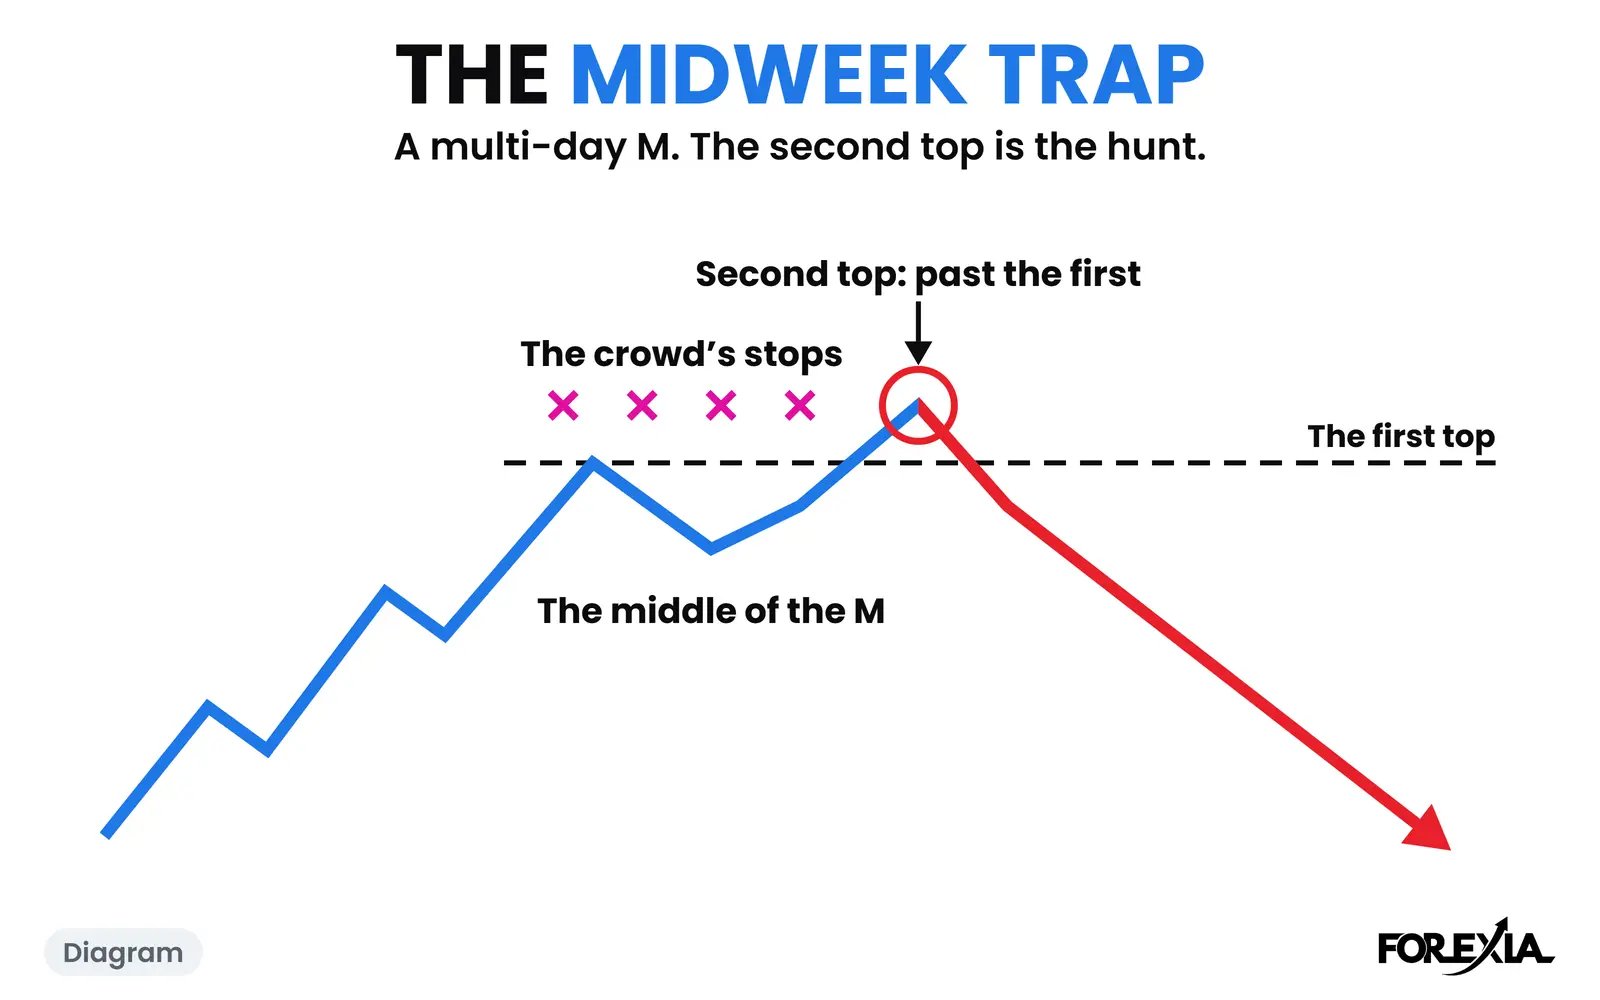
What does the Midweek Trap look like on a chart?
It looks like a breakout that has been waiting for you. USD/JPY opened the week of 6 July 2026 at 161.271. Monday ran up 80 pips on the day, with a high of 162.425 at 08:45 New York. That is the first top of the M.
Tuesday did very little. It dipped to 161.659, recovered and closed at 162.090, 2 pips up on the day. That dip is the middle of the M.
At 11:30 on Wednesday price reached 162.708, the high of the week, 28 pips over Monday's high. That is the Stop Hunt, what most traders call a liquidity sweep, and the second top. By then the rise had covered 145 pips from Monday's low in three days. Anyone reading the chart for a trend saw a fresh high.
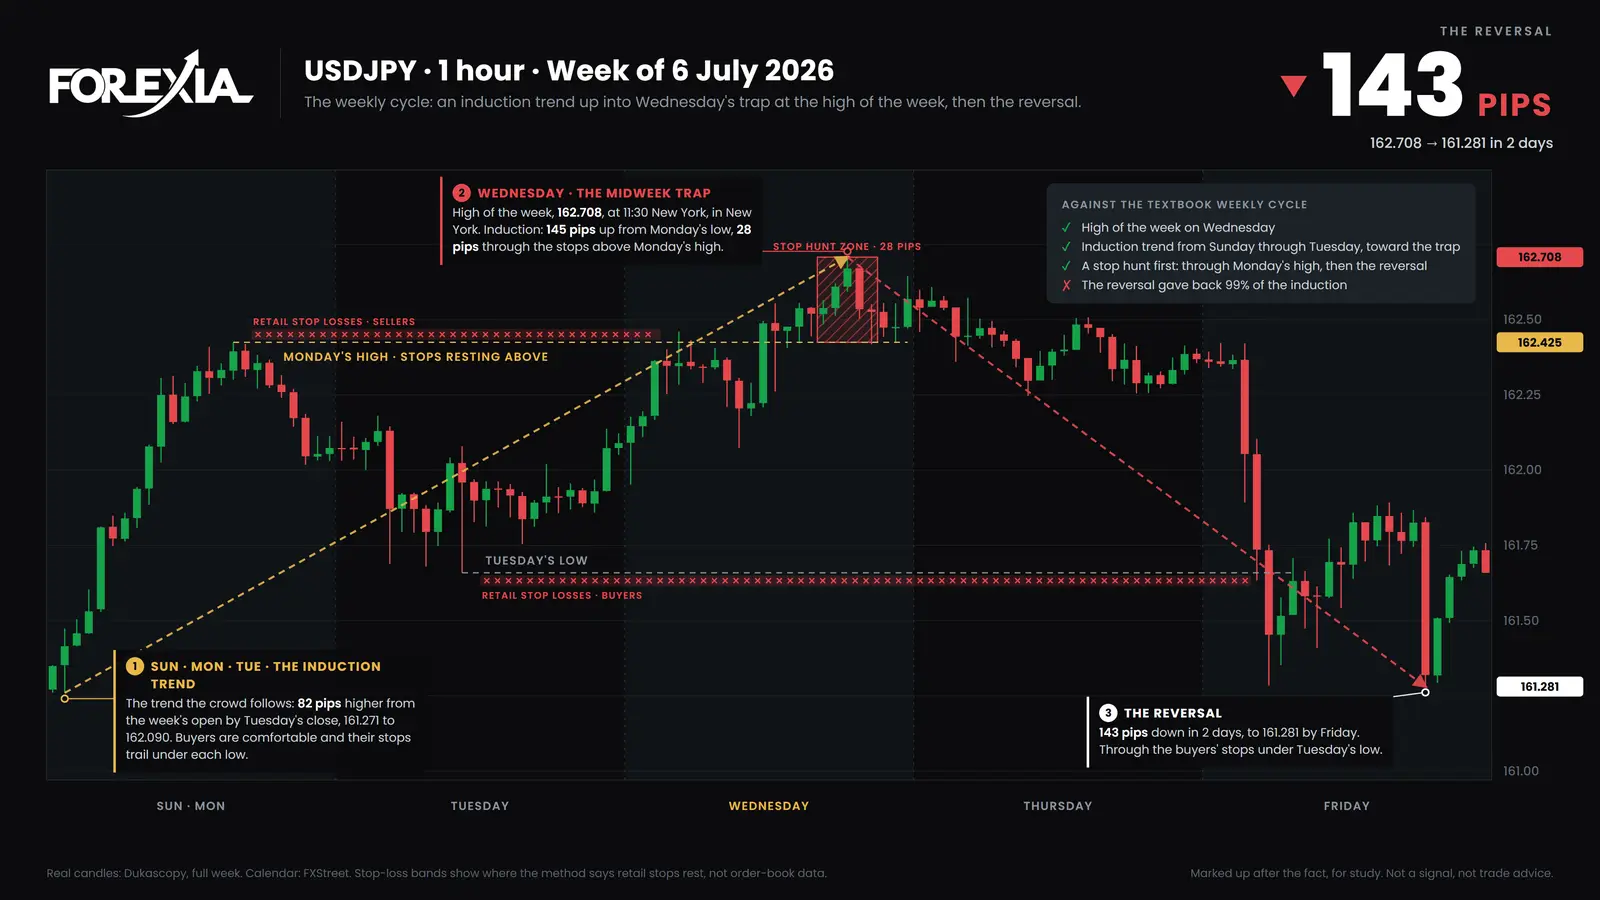
Then nothing happened for a long time. The 20:00 candle on Wednesday night closed back under Monday's high at 162.400, and the first hourly close under it was the 01:00 hour. Thursday's session stayed inside 36 pips. Tuesday's low did not go until 21:15 on Thursday night, nearly a day and a half after the high. By 11:45 on Friday price was at 161.281, 143 pips off the top.
The Three Seats read the second top differently. Retail sees a new high and a trend it has watched for three days. The market maker, on our reading, sees the orders it needed, stacked above Monday's high. The observer sees two tops and waits for a close.
The Midweek Trap and a double top: what is the difference?
The shape is the same, and the context is what differs. A double top is a pattern on any chart at any time, and guides read it as a signal in itself. The Midweek Trap is a place in the Weekly Script: it comes after days of the Induction Trend, so the people it catches are the ones that trend brought in.
It also differs from the M of M & W Reversals, which is built inside one day from a clear Asian range. This one stretches across days and sessions.
On USD/JPY that week the chart showed a breakout until the 20:00 candle closed back under Monday's high. A week can stay a breakout, so the word names something you can only be sure of afterwards.
Weekly profile guides describe a similar idea with schematic drawings, and the weekly cycle forex guide places it in the whole week.
What did price do around the Midweek Trap that week?
It went quiet twice. Tuesday stayed inside 52 pips before the hunt, and Thursday inside 36 after it, against 116 on Monday. Our reading is that quiet hours let orders build on both sides: breakout buyers above, stops under the lows. No public book shows forex stops, so that cannot be proved, and one week does not make a rule.
Wednesday in the name is the usual place, not a date. On USD/CHF in the week of 28 September 2026 Wednesday closed near its high, and the trap came on Thursday.
What do traders get wrong about the Midweek Trap?
Three readings cost the most.
- Reading the second top as confirmation. At 11:30 on Wednesday the chart showed a higher high, and that was the week's last one.
- Expecting a fast turn. The fall through Tuesday's low took nearly a day and a half to start. A close back is not a clock.
- Calling every midweek high a trap. A week can keep rising into Friday. A reversal seen afterwards is not a setup, and our own test of the daily setup as a mechanical rule did not make money.
Which words does the Midweek Trap lead into?
Three sit next to it.
- Mid-Week Reversal: the turn itself, after the trap.
- M & W Reversals: M off the highs, W off the lows, from a clear Asian range.
- The WTF Reversal: the reversal through the herd's stops on Wednesday, Thursday and Friday.
Where is the Midweek Trap taught?
The Midweek Trap is taught in Course 4 of ForexiaPRO, The Week, in production.
Related words
Frequently asked questions
What is the Midweek Trap?
It is Wednesday's trap: a multi-day, multi-session M in a rising week. The trap is a stop hunt past the earlier days' extreme, followed by a close back inside it.
What did the Midweek Trap look like on USD/JPY in the week of 6 July 2026?
Monday's high was 162.425 and Tuesday was quiet. At 11:30 on Wednesday price reached 162.708, 28 pips over Monday's high, and that night a candle closed back under it. By Friday price was 143 pips off the top. Until the close back, the same picture was a breakout.
Is the Midweek Trap just a double top?
The shape is the same. The difference is where it sits: after days of the Induction Trend, across several days and sessions. A double top can appear on any chart at any time.
Does the Midweek Trap always come on Wednesday?
No. The name gives its usual place in the week, not a date. On USD/CHF in the week of 28 September 2026 Wednesday closed near its high, and the trap came on Thursday.