Forex Weekly Outlook: How We Map the Week on Sunday
Dylan Forexia6 min read
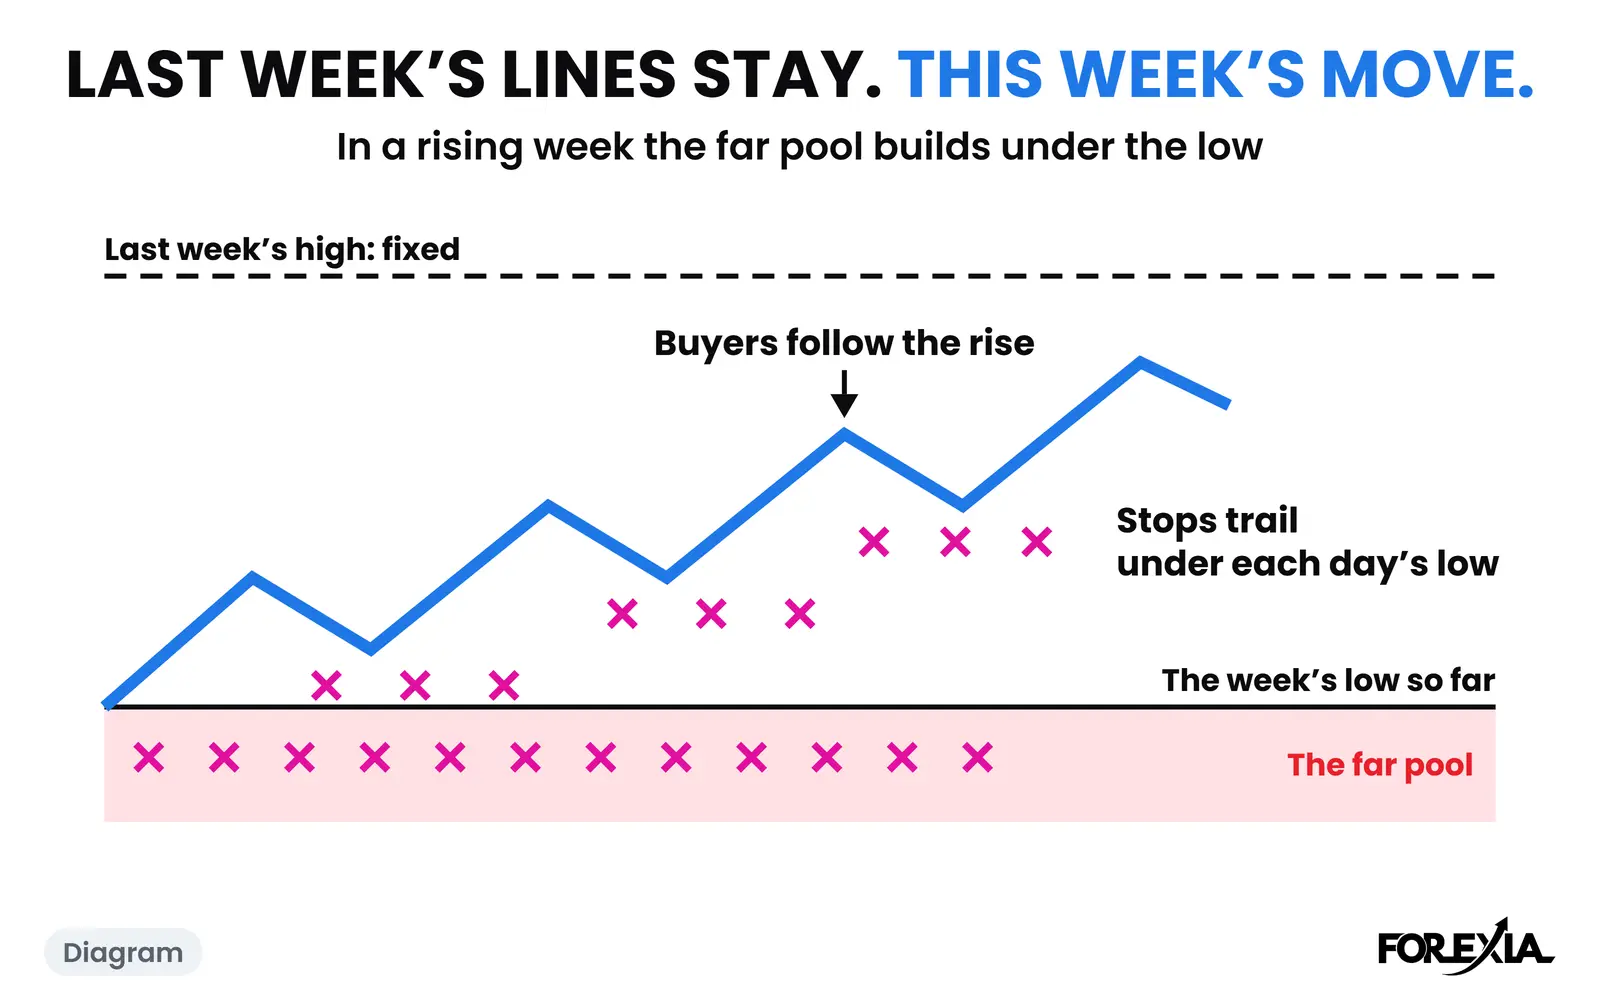
A forex weekly outlook, in our format, is a map and not a forecast. It starts with last week's high and low, adds where the large speculators stand in the COT report, and lists the calendar for the week. The map says where stops are likely to rest. It does not say where price will go, or which line goes first.
This page sets out what goes on the map, shows one real Sunday with its numbers, and then says what that Sunday could not tell anyone. How to read the forex week covers what comes after the map, from Monday on.
What goes into a forex weekly outlook?
Four things go on it, in this order.
- Last week's high and low. They are fixed on Friday, so they can be drawn before the week opens. We read them as places where stops and breakout orders rest. The week's high and low is the word for this week's own extremes as they form, which move.
- Where the week opened against them. The first candles after the 17:00 New York open show whether the market opened nearer the high, nearer the low or in the middle, and how far from Friday's close.
- The COT stance. The COT report, published by the CFTC each Friday, shows where the large speculators stand. We read that as a position in a three-year range, the index from 0 to 100. A stance is called crowded at an index of 20 or under, or 80 or over. How to read the COT report explains the index. Its research results are on their own pages, and this page does not quote them.
- The calendar. Which high-impact releases land in which session. A release is a reason for a candle to be large, and it can hide or imitate a stop hunt.
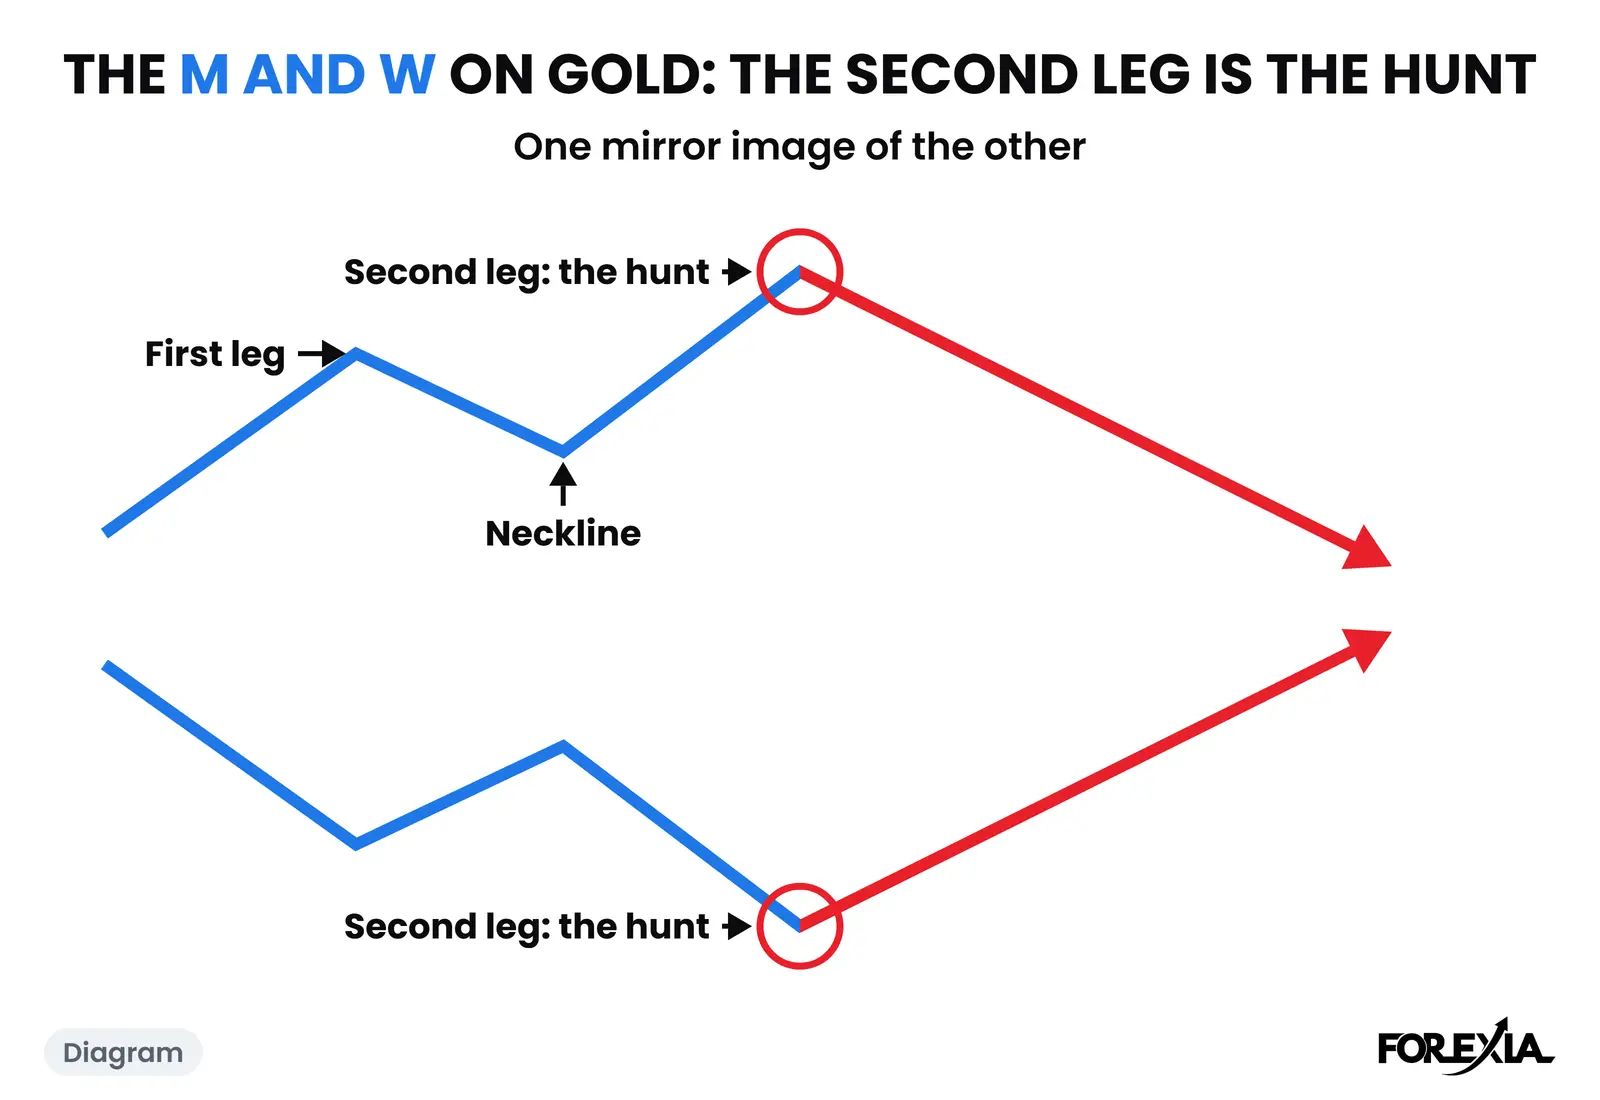
Each item can be checked against a chart, a published report or a calendar, which is what keeps the map honest. Nothing on that list names a direction. A broker's outlook often does, and that is the difference. Ours marks places and leaves the order open, because the order is what a week keeps to itself until it has been played. Liquidity mapping is the habit of marking those places before the session.
What did one real Sunday show?
Take the Sunday before the AUD/USD week of 27 July 2026. The week before had ended with a high of 0.70264 and, leaving out a rollover print of 0.69598 on Thursday's 17:00 candle, a low of 0.69618. The two lines sat 65 pips apart. The new week opened at 0.69975, 19 pips over Friday's close and nearer the high than the low.
The COT report from that Friday told the reader where the crowd stood, as one more line on the map. The calendar had two items for the week: Australian CPI at 21:30 on Tuesday evening, which is in Wednesday's session, and the Fed's decision at 14:00 on Wednesday.
That is the whole map. It has two lines, an opening price, a stance and two dates, and it takes a few minutes to draw. A reader could say that stops probably rested over 0.70264 and under 0.69618, and that two releases were coming in the same session.
What happened to that map?
Both lines went, which is the less usual outcome. The low of the week came at 12:15 New York on Wednesday at 0.69219, which was past last week's low and 40 pips under Tuesday's low. The 14:30 candle after the Fed closed back at 0.69707, and Wednesday still finished at 0.69542. On Thursday a candle closed over last week's high of 0.70264 by 12:15, and Friday reached 0.70442 at 05:00, 122 pips off the low. The week closed at 0.70210.
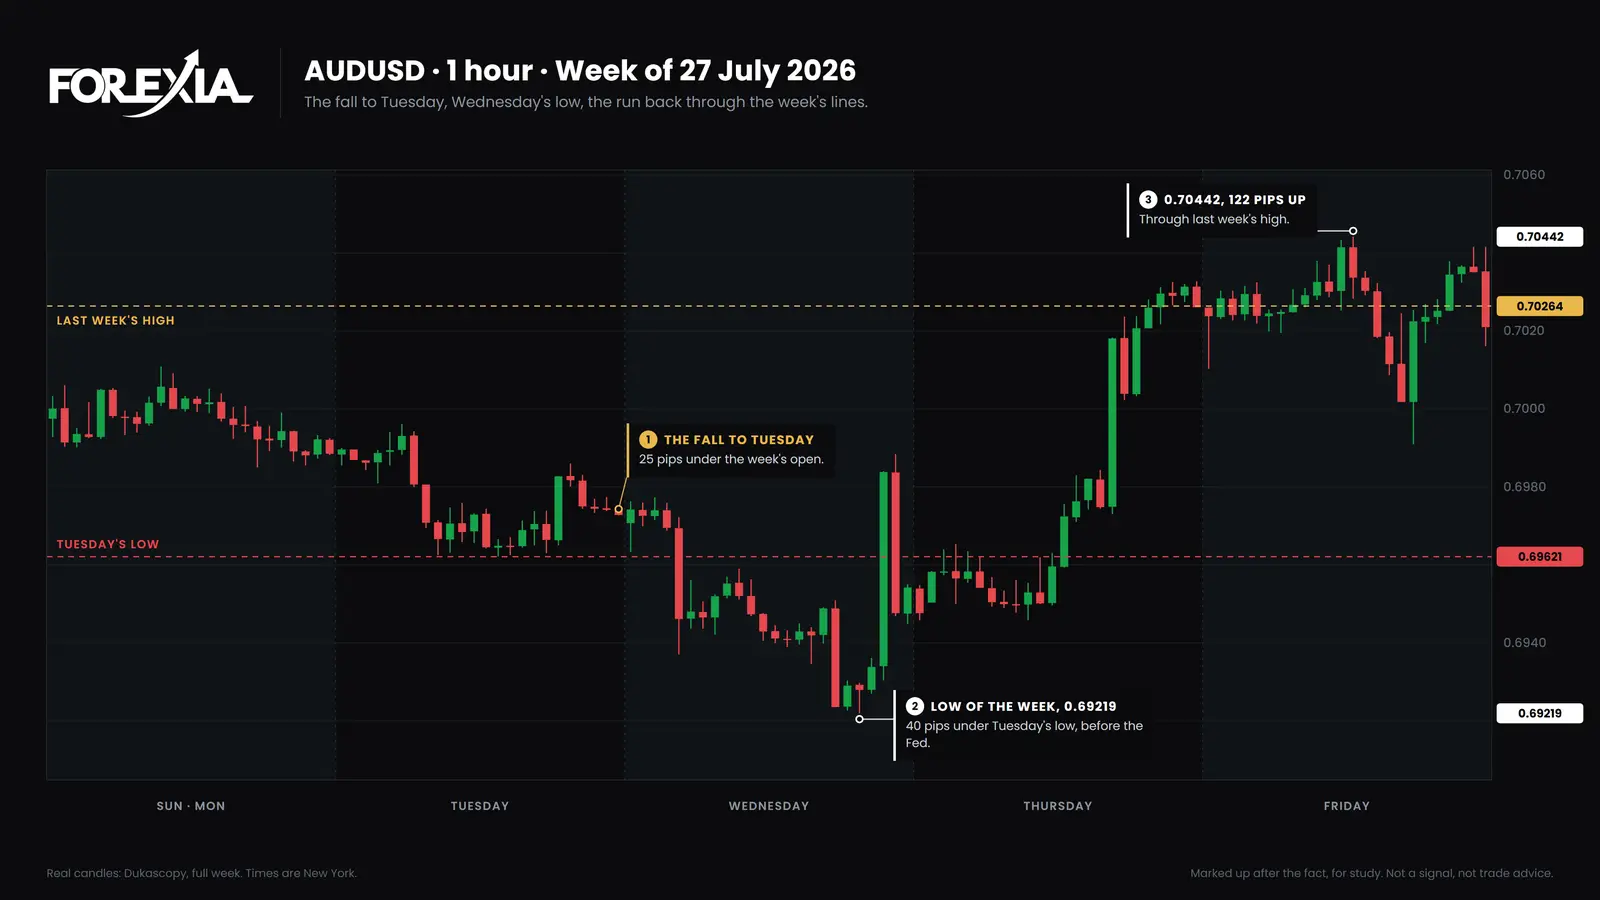
Nothing on Sunday said the low would go first, or that it would go on a candle before the Fed rather than after. The map was right that those two places mattered. It was silent about when, and silence is what a map can offer.
How often does a week trade through last week's lines?
More often than not, and that is why they belong on the map. We counted 24 whole weeks, 13 April to 25 September 2026, on seven majors and gold: 192 market-weeks on 15-minute candles. Last week's lines were traded through by at least 3% of the average day on 177 of them. A week took neither line in 35 cases, one line in 137 and both in 20.
| What the week did to last week's lines | Count |
|---|---|
| Market-weeks in the count | 192 |
| Lines traded through | 177 |
| Weeks that took neither line | 35 |
| Weeks that took one line | 137 |
| Weeks that took both lines | 20 |
| Lines the week still ended past | 100 |
Both lines going, as in the AUD/USD week, happened in 20 of the 192. It is not the usual week. This is a count of candles and not of trades, and the eight markets often move on one dollar, so the 192 are fewer separate events than they look. Weekly high and low liquidity has the full count and its rule.
What does the outlook leave out on purpose?
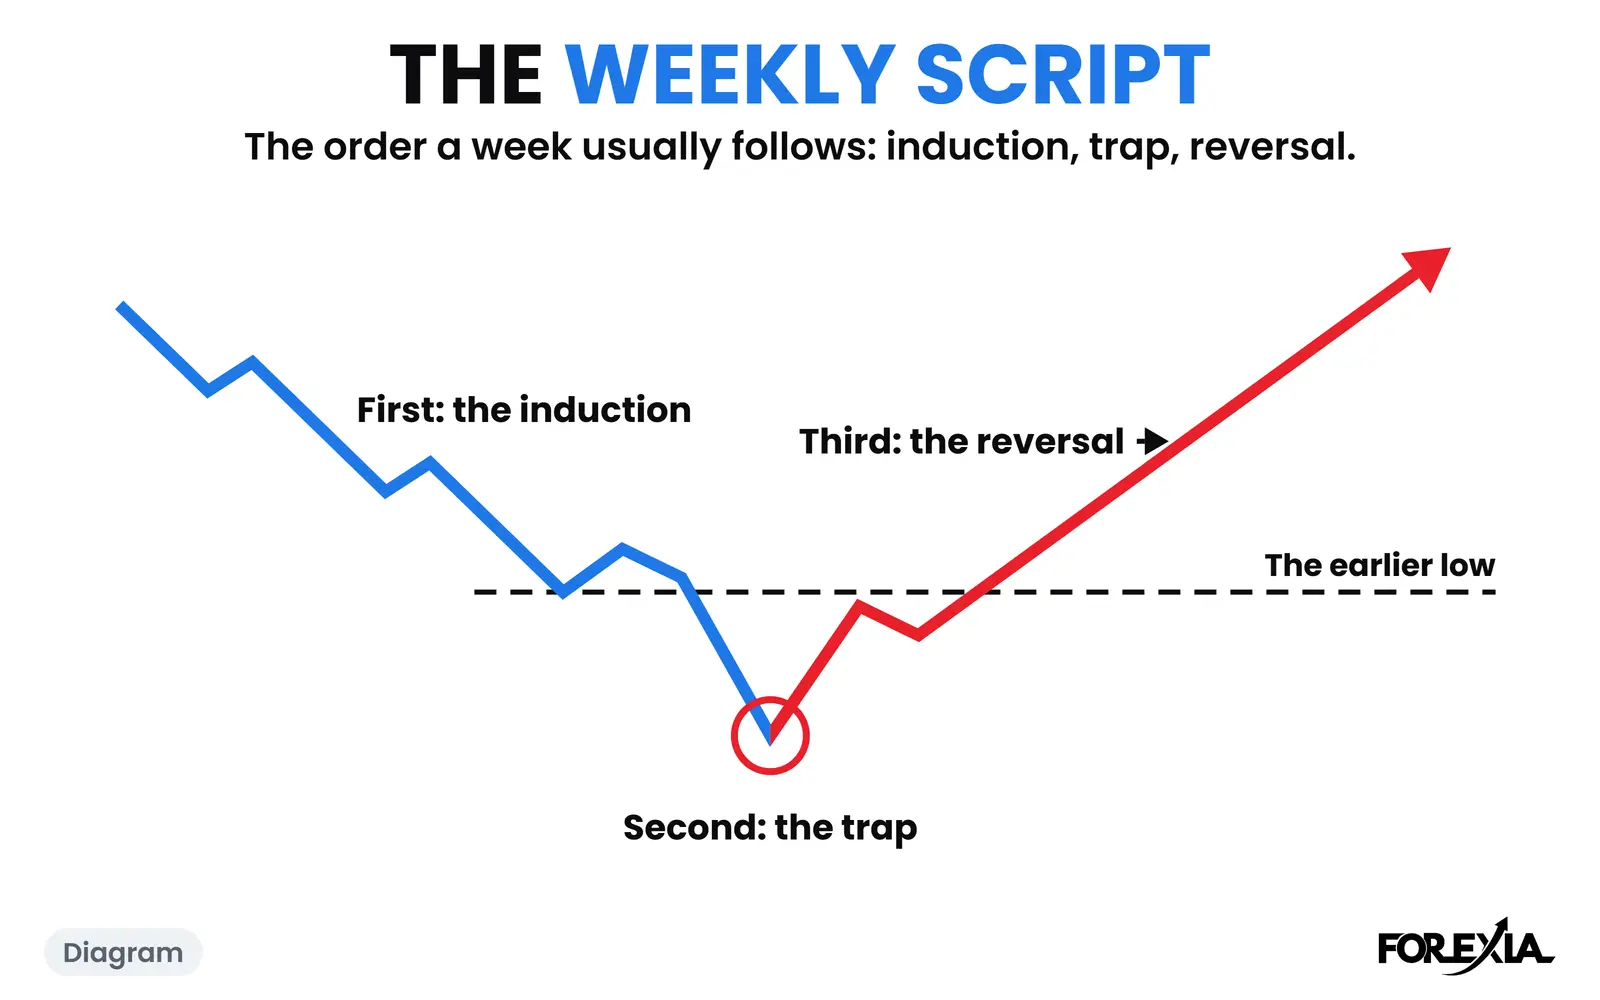
It leaves out a bias. A bias says which way, and on that AUD/USD week a bias to sell was right on Monday, right on Tuesday and wrong from Wednesday afternoon. The map asks which part of the week it is in, which is a different question and one the week can answer as it goes.
It also leaves out any price target, any entry and any stop. Those belong to a method with its own tests, and the course teaches them. The outlook is the part that can be shared freely because it makes no promise: a line, a stance and a date.
The Three Seats apply here too. Retail reads an outlook as a forecast and acts on its direction. The market maker, on our reading, reads the same lines as where orders are. The observer reads them as places to watch, not as places to be.
What can a weekly outlook not tell you?
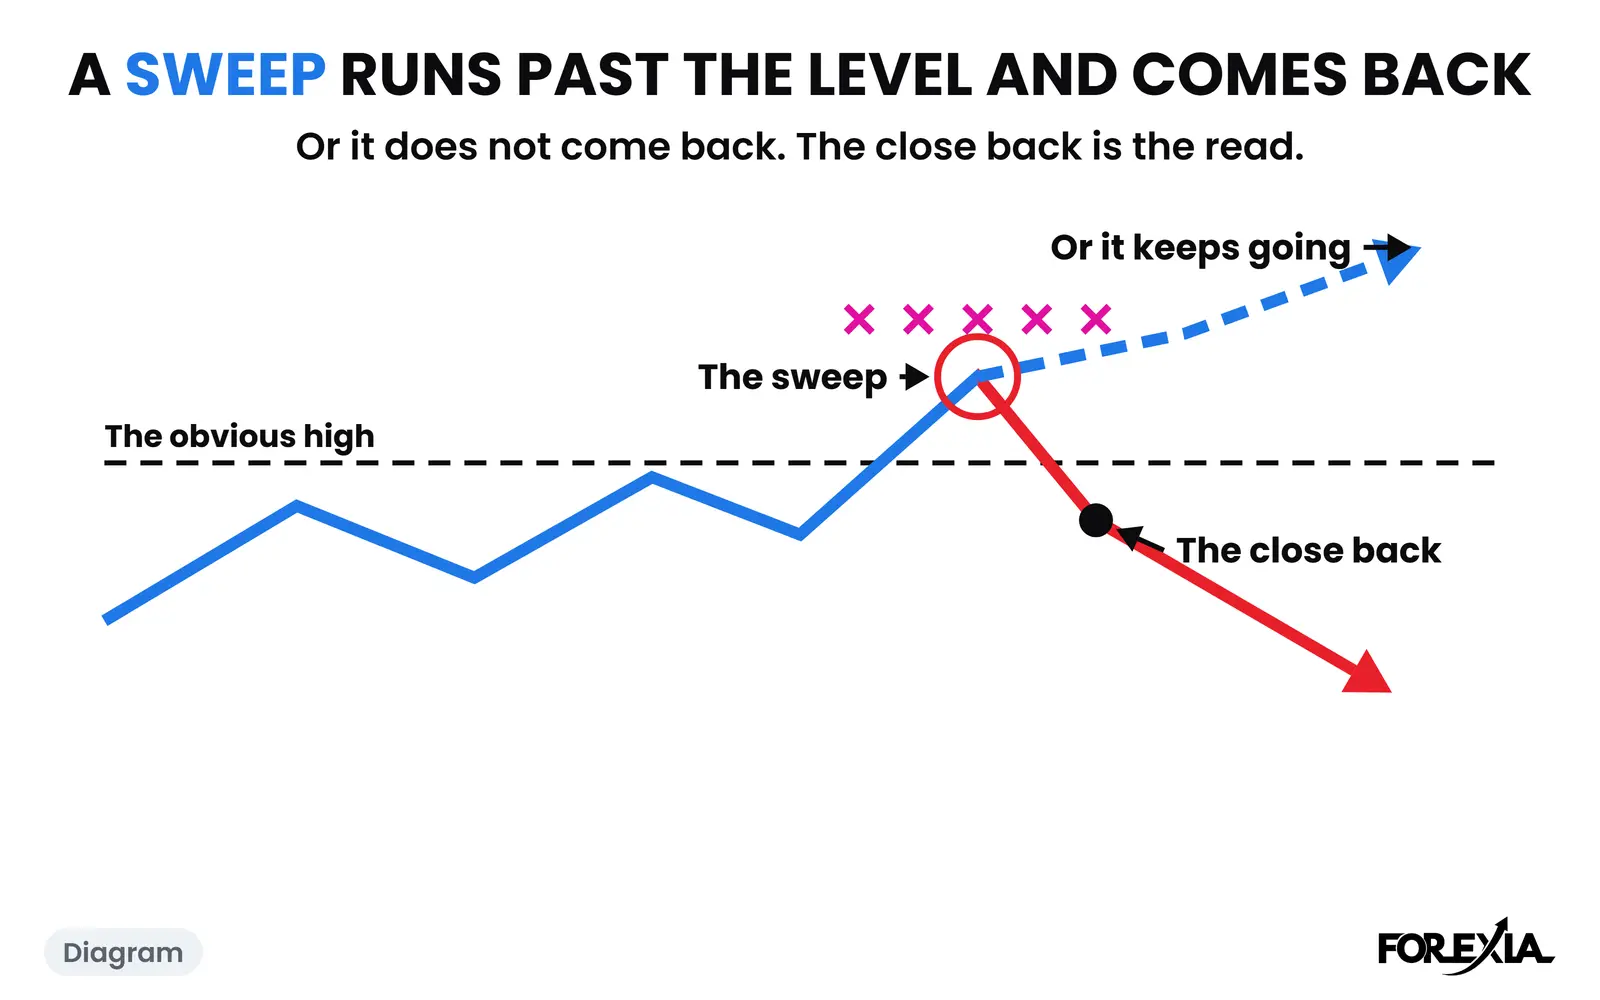
It cannot tell you which line goes first, whether a line goes at all, or whether a hunt of a line turns or runs. In 35 of the 192 market-weeks neither line was touched. The map also cannot see anyone's stops, since spot forex trades over the counter and no public book shows them. "Where stops are likely to rest" is our reading of where a crowd would put them.
Finally, a map is only useful if it is checked afterwards. How to review a forex trading week is the Friday half of the same habit: it sets what the map said against what the week did.
Sources
Our figures come from our own chart write-ups and the count script scripts/seo-counts.mjs, on Dukascopy 15-minute candles in New York time. External sources:
- The CFTC's Commitments of Traders page, for the weekly report.
- The Federal Reserve's meeting calendar, for the 14:00 Wednesday decision.
Course 4 of ForexiaPRO, The Week, in production, teaches the Sunday map in lesson 4.1.2.
For study only. This page is not a signal and not trade advice. Charts are Dukascopy candles, marked up after the fact.
Frequently asked questions
What goes in a forex weekly outlook?
Ours has four things: last week's high and low, where the week opened against them, where the large speculators stand in the COT report, and the calendar for the week. None of them is a price forecast. Together they say where stops are likely to rest.
Can a weekly outlook predict the week?
Not in our experience. On the Sunday of the AUD/USD week of 27 July 2026 the map showed last week's high and low 65 pips apart, and both lines went during the week, in an order nothing on the map gave.
When should you make the weekly outlook?
On Sunday, after the 17:00 New York open, once the week's first candles show where it opened against last week's lines. The COT report it uses is published the Friday before.