Gold M and W Pattern: Sixteen Real XAUUSD Days, Two in Full
Dylan Forexia7 min read
The gold M and W pattern is a two-legged push past the Asian range on XAUUSD, and between 7 May and 30 September 2026 we marked sixteen of them: nine Ms off the high and seven Ws off the low. The second leg ran 5 to 23 pips past the first, and gold then reversed 36 to 163 pips. Six of the sixteen cleared the whole night's range, and ten stopped inside it.
These days were marked up afterwards, for study. None is a signal, and a reversal seen afterwards is not a setup. On gold $1 is 1 pip, and all times are New York. For the wider picture, see how to trade gold, and for the plain one-push version, gold liquidity sweeps.
What is the gold M and W pattern?
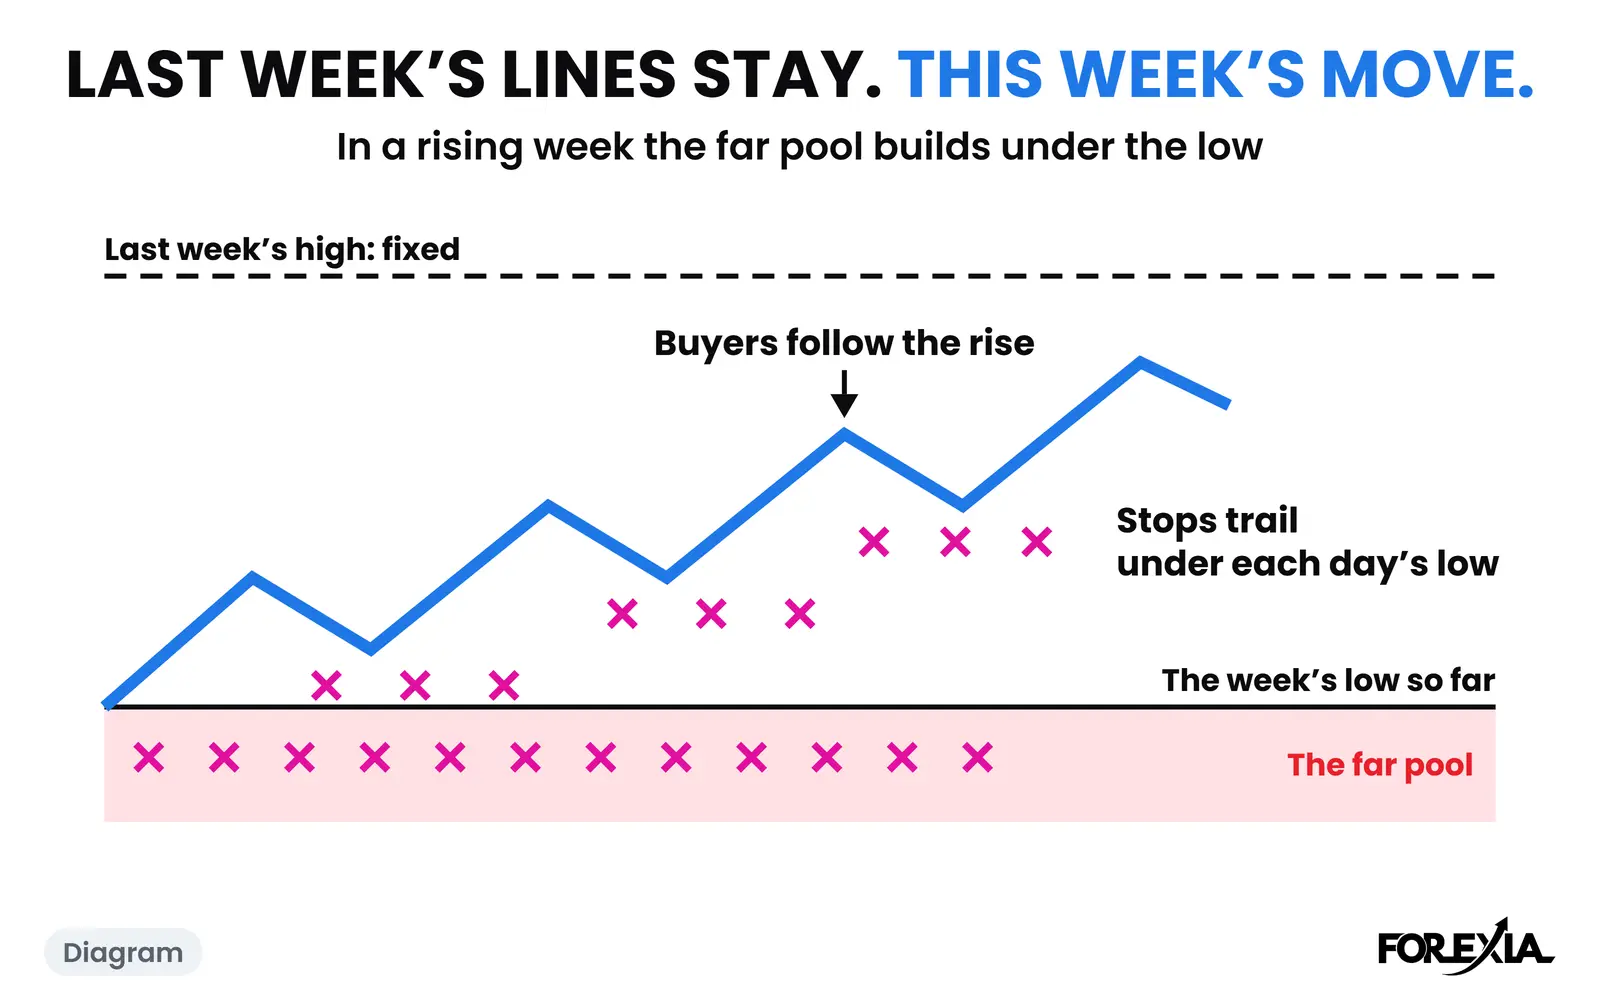
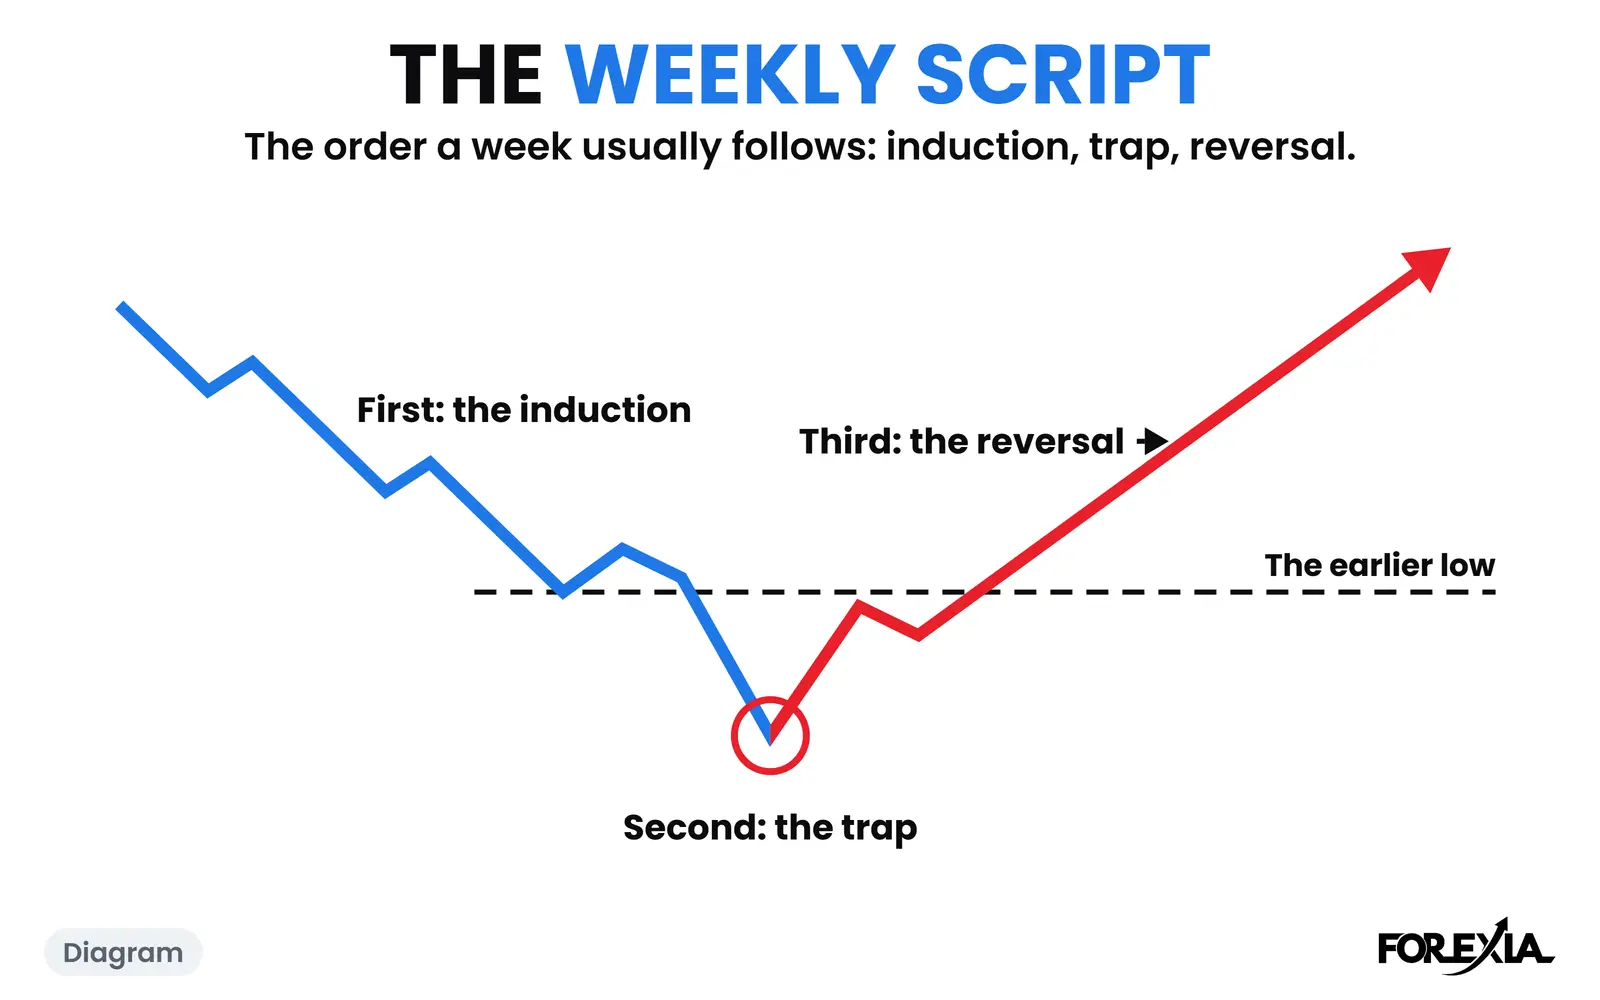
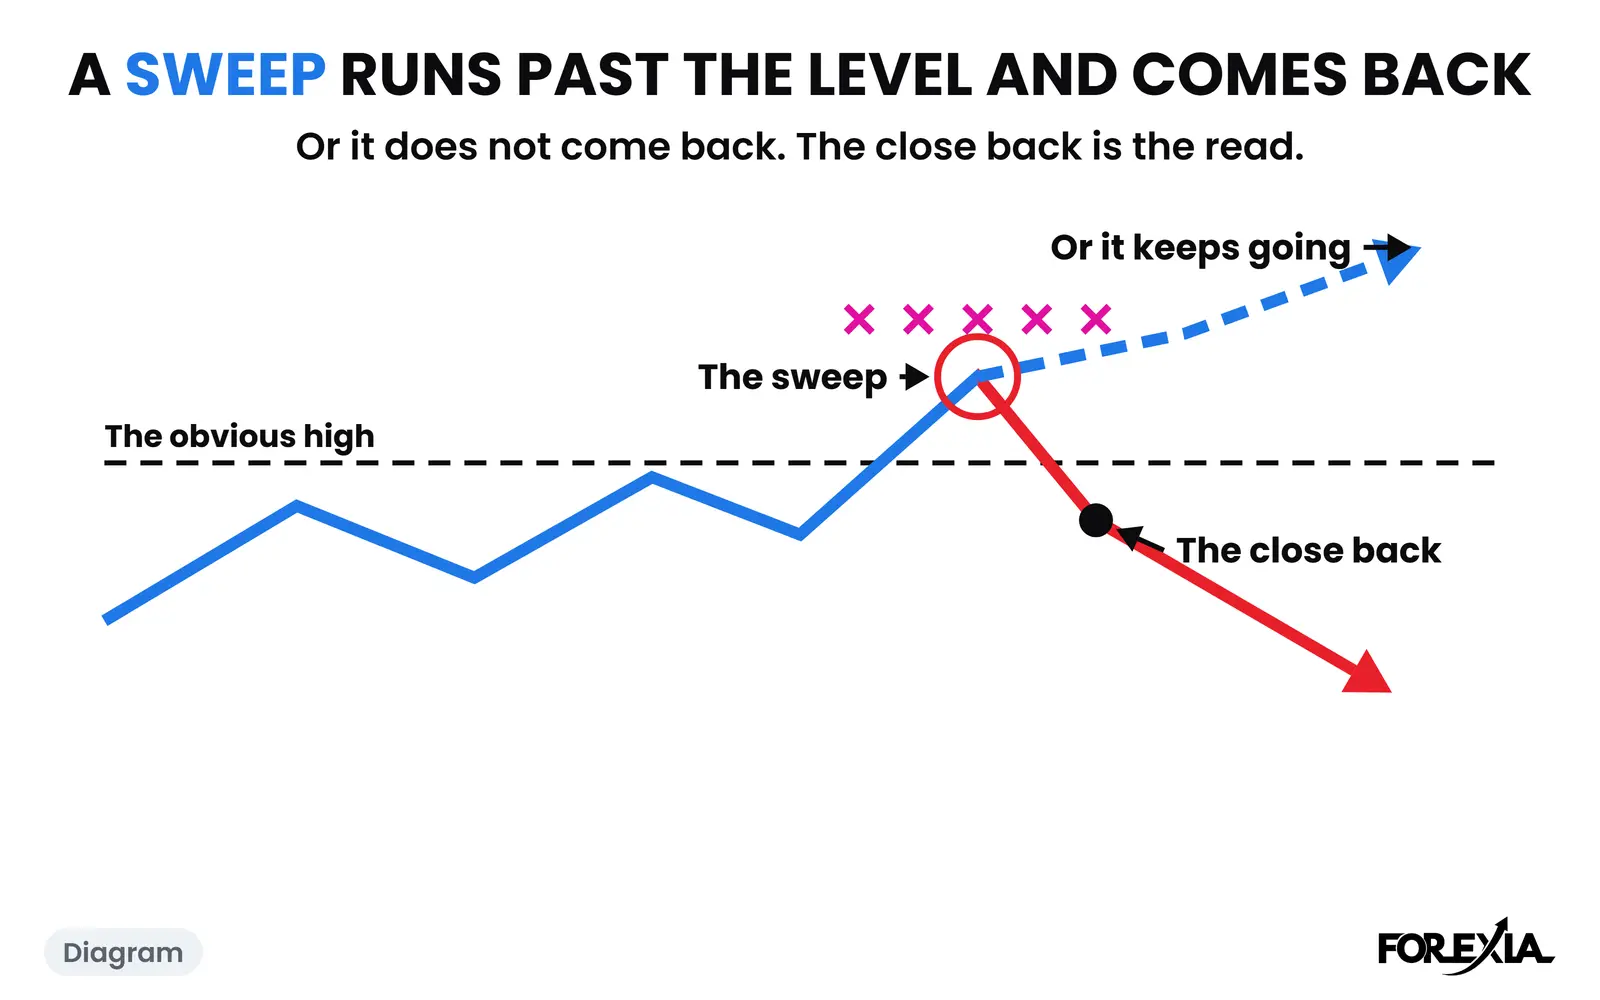
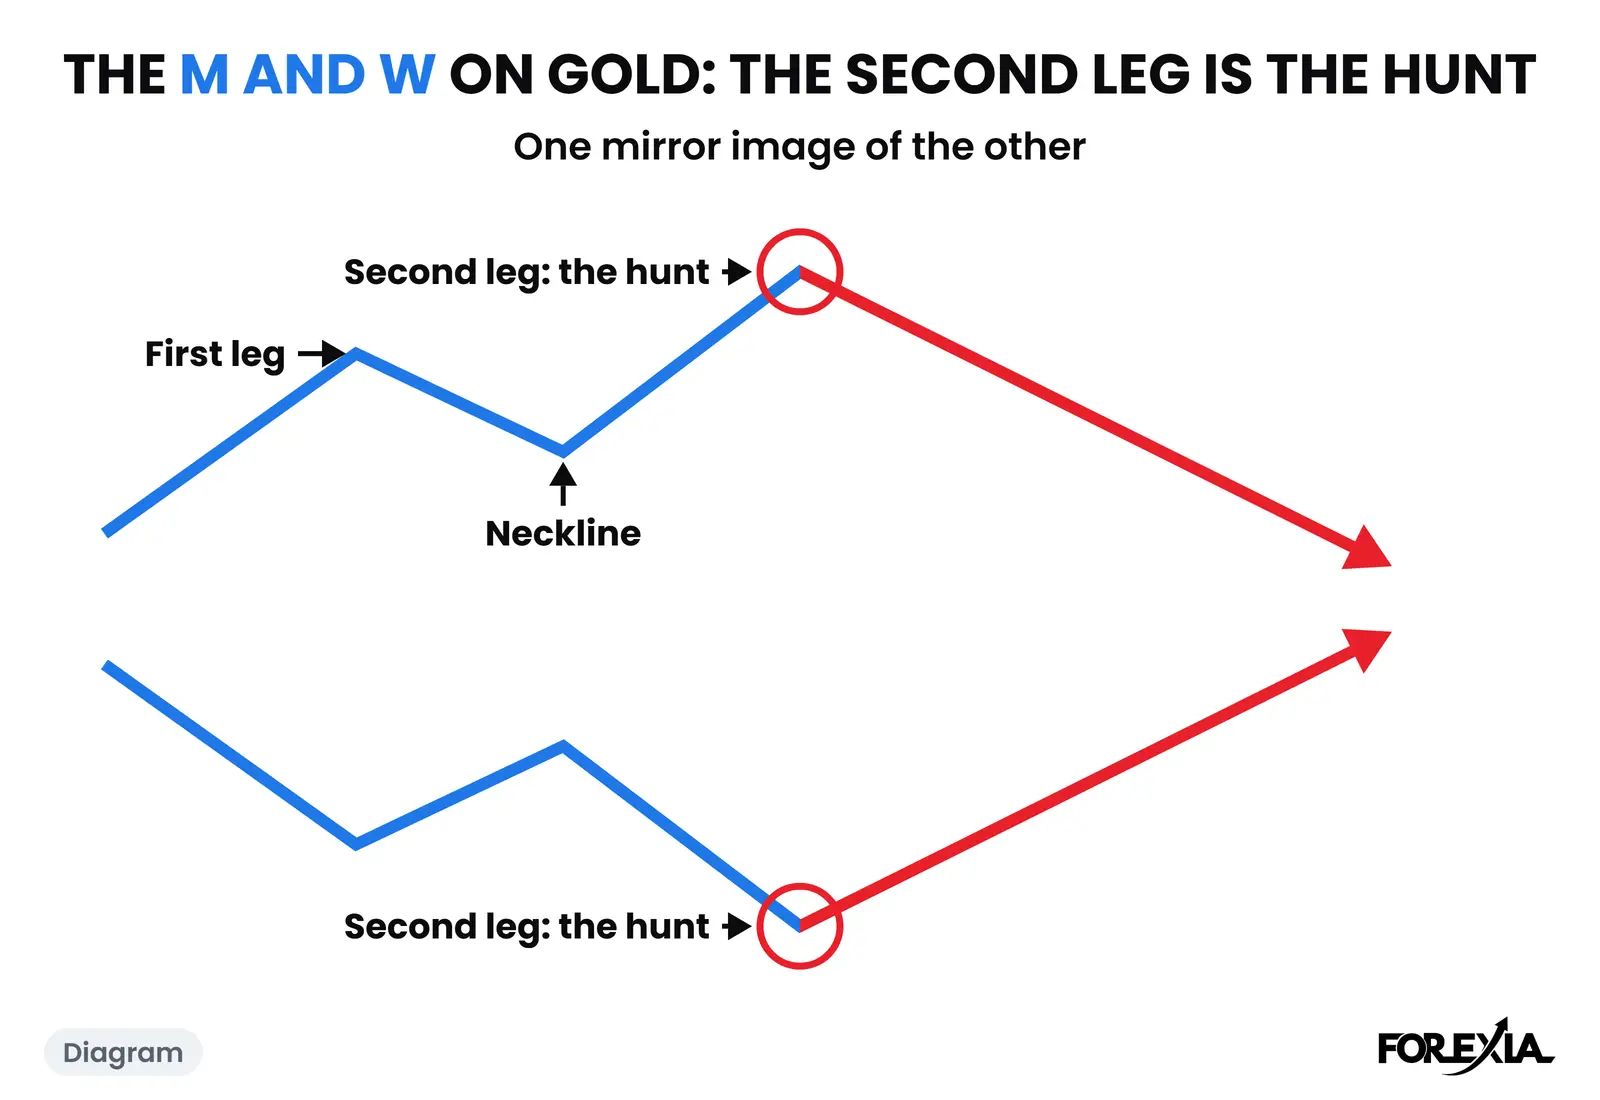
It is the sweep with a rehearsal. The night leaves a range, the Asian Box. London or New York breaks one edge, which is the first leg. Price pulls back to a neckline. Then a second leg goes a little past the first, and that second leg is the stop hunt: it takes the stops that gathered beyond the first leg and traps everyone who bought the new high, or sold the new low. Our glossary has the shape as M and W reversals, and the second push as the second leg.
We see an M when the break is of the high and a W when it is of the low. It is the same read in mirror. And it is a reading of the structure: the stop orders are not in any data we hold.
What did sixteen gold Ms and Ws look like?
Here are the nine Ms, with the Asian range, when the second leg printed, how far past the first leg it went, and how far gold ran after it.
| M, off the high | Asian range, pips | Second leg | Past the first leg, pips | Ran, pips | Grade |
|---|---|---|---|---|---|
| Thu 7 May | 65 | 11:00 | 5 | 80 | Textbook |
| Mon 18 May | 75 | 09:45 | 7 | 52 | Partial |
| Mon 15 June | 76 | 10:00 | 22 | 63 | Partial |
| Wed 17 June | 32 | 13:30 | 18 | 163 | Textbook |
| Tue 7 July | 52 | 09:30 | 5 | 88 | Textbook |
| Mon 24 August | 66 | 09:30 | 11 | 56 | Partial |
| Wed 9 September | 65 | 09:30 | 19 | 59 | Partial |
| Wed 16 September | 66 | 14:00 | 5 | 132 | Textbook |
| Wed 30 September | 30 | 08:30 | 17 | 72 | Textbook |
And the seven Ws.
| W, off the low | Asian range, pips | Second leg | Past the first leg, pips | Ran, pips | Grade |
|---|---|---|---|---|---|
| Thu 21 May | 53 | 09:30 | 13 | 71 | Partial |
| Fri 10 July | 27 | 10:30 | 13 | 48 | Partial |
| Tue 28 July | 47 | 10:15 | 5 | 36 | Partial |
| Mon 3 August | 35 | 09:30 | 23 | 39 | Partial |
| Thu 27 August | 49 | 09:45 | 5 | 54 | Partial |
| Tue 22 September | 61 | 04:30 | 8 | 80 | Textbook |
| Thu 24 September | 30 | 06:30 | 18 | 44 | Partial |
Three things stand out. Gold's Ms outnumbered its Ws, nine to seven. Four of the five Ms graded textbook were New York session days, and the second legs printed at times from 04:30 to 14:00, so there is no single hour. And only one of the seven Ws cleared the range. A W off the low was more often a smaller move than an M off the high on these days. Sixteen days is a small sample, so we draw nothing firmer.
The second leg went past the first by a median of 12 pips. That is the size of the trap: small beside a gold day that averaged about 101 pips in this period, and large to anyone with a stop there.
An M in full: Monday 15 June 2026
Asia left a 76-pip range, 4259.59 to 4335.43. London broke the high by 12 pips, to 4347.35 at 07:30, the breakout the crowd buys, which was the first leg. Price pulled back to a neckline at 4324.52. At 10:00 a second leg ran to 4369.48, 22 pips past the first leg. That is the hunt. Gold then fell 63 pips to 4306.31 by 16:45, back inside the Asian range and under the neckline.
We grade it partial, because the reversal stopped inside the range. No medium or high-impact release lined up with the hunt, the first leg or any outsized candle. We read the first leg as taking the sellers' stops above the Asian high and the second as taking the new stops above the first leg.
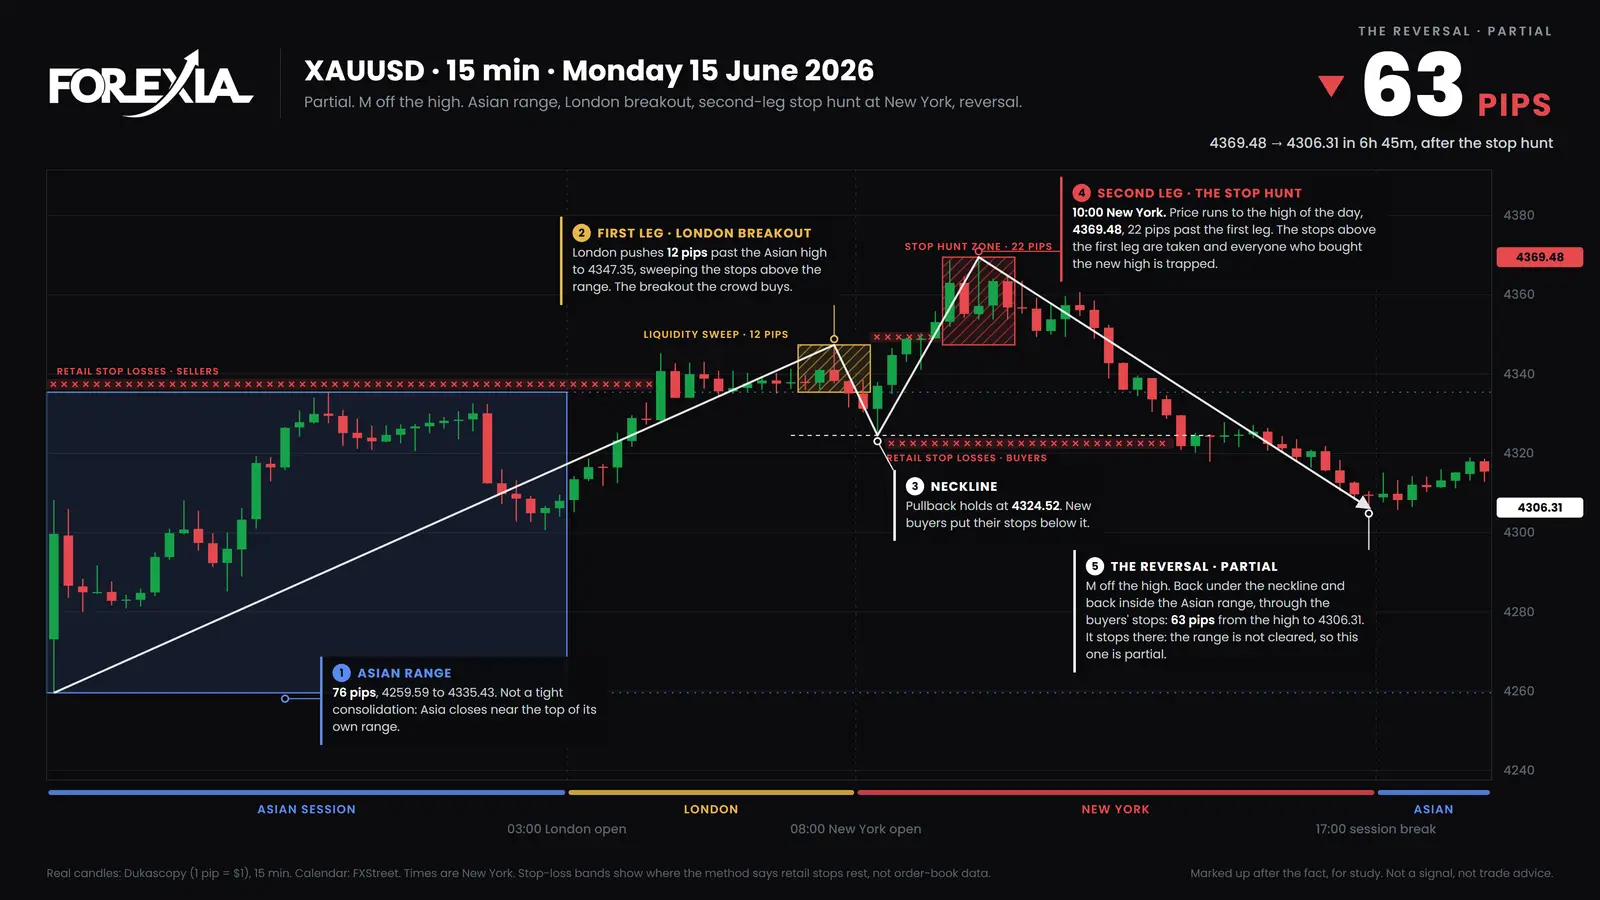
The week matters here. That high was not the high of the week. On Wednesday 17 June gold took it by 13 pips, to 4382.13 at 13:30, for the high of the week, and fell 163 pips to 4218.81. That Wednesday is in the table too, as the M that cleared the range. Gold on FOMC day is that day.
A W in full: Monday 3 August 2026
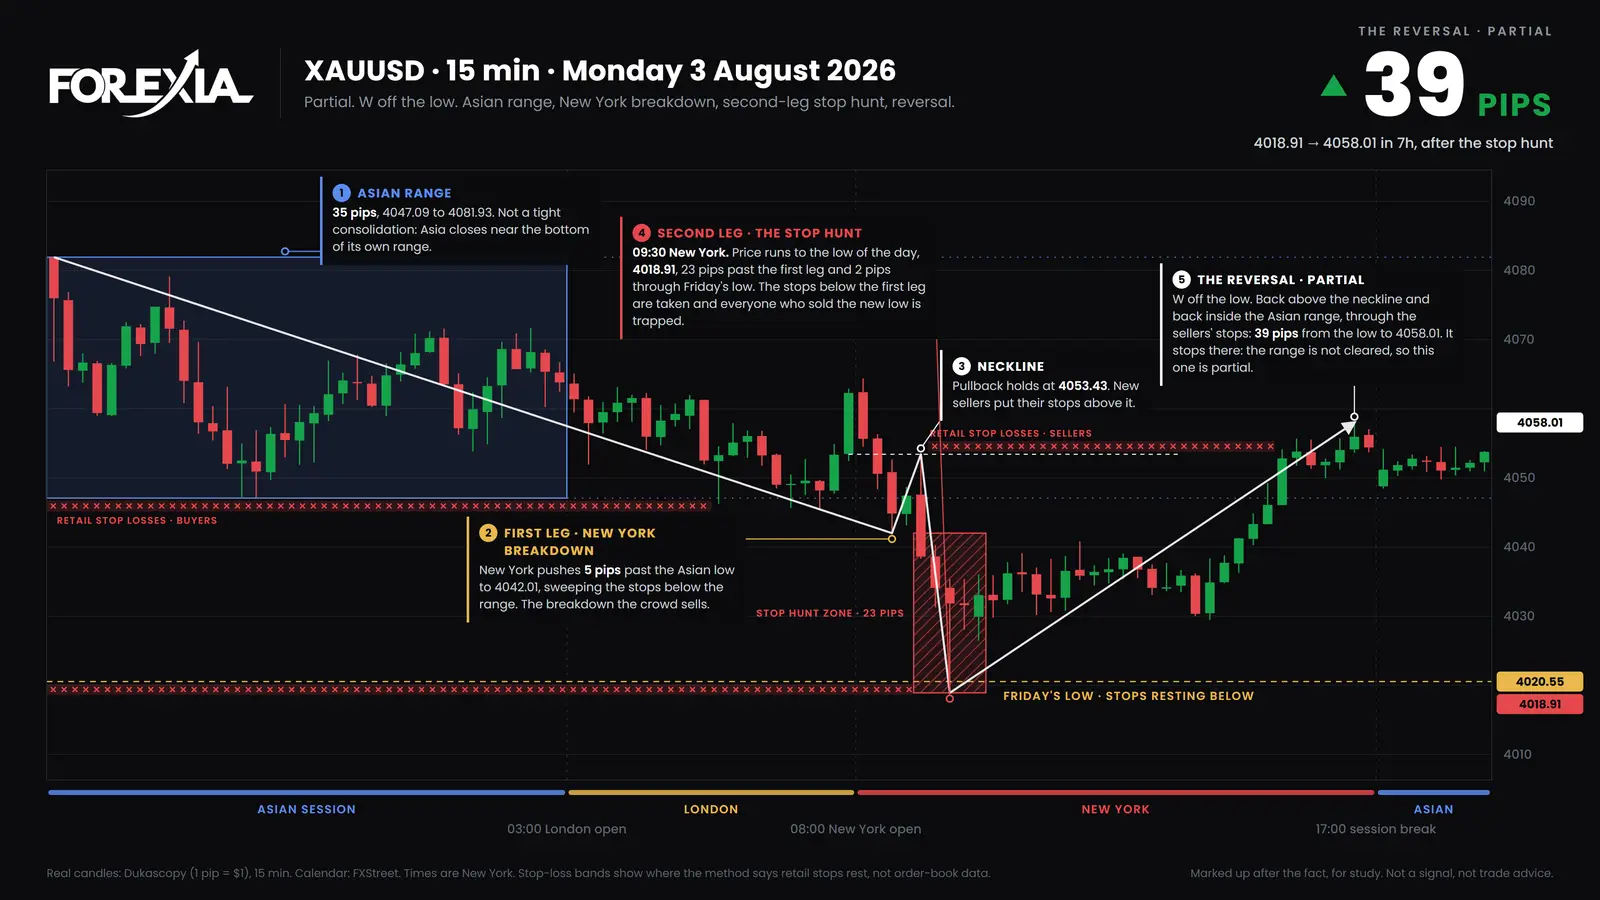
Asia left a 35-pip range, 4047.09 to 4081.93. New York broke the low by 5 pips, to 4042.01 at 08:30, the breakdown the crowd sells. Price pulled back to a neckline at 4053.43. At 09:30 a second leg ran to 4018.91, 23 pips past the first leg and 2 pips through Friday's low of 4020.55. Gold then rose 39 pips to 4058.01, back inside the Asian range. It is the largest overshoot in either table.
It is graded partial too, and no medium or high-impact release lined up with it. The second leg took the stops under Friday's low. What the day does not show is the week. It was the low of the week. From the extreme gold ran 353 pips on the weekly scale, to 4371.69 by Friday, before the level was traded back through. So a partial day can be the start of a large move, and the day itself gave no sign.
What do the sixteen days not show?
A lot, and it is worth being plain.
- They are marked days. They are the M and W days we marked, not every two-legged push gold printed, and not days where the second leg kept going. The hub's count of 184 sweeps, with 151 close backs and 96 of those followed by a candle past the furthest price, is the honest base rate for the one-push version.
- The "ran" figure is not a trade. It is the distance from the second leg's extreme to the far extreme of the move. No one entered at that extreme.
- A second leg can be a third. On 24 September the low was hit at 04:15, again at 06:30, 18 pips past, and only then did gold rally 44 pips. The liquidity sweep backtest has that day.
- It is not a method. We ran our setup on gold as a fixed rule with the real spread and costs, over 3,884 trades from 2012 to 2 October 2026, and it lost between 0.089R and 0.146R a trade in every period. The stop hunt guide has the test and its limits.
From the three seats: retail sees a break and a retest and buys the second push. The market maker, as we read it, sees the stops beyond the first leg. The observer sees the second leg only once the candle has closed back.
The weekly markups of these two days are the M on gold and the W on gold, each with its full write-up. Course 3 of ForexiaPRO, Reverse Price Action, teaches the second leg step by step.
Tools for this
Frequently asked questions
What is the M and W pattern on gold?
A two-legged push past the night's range on XAUUSD. The first leg breaks the Asian high (an M) or low (a W), price pulls back to a neckline, and a second leg runs a little further than the first. We read the second leg as the stop hunt, taking the stops that gathered above or below the first leg, and the reversal follows it.
How far does the second leg usually go past the first on gold?
On the sixteen days below it went 5 to 23 pips past the first leg, with a median of 12 pips. The reversal after it ran 36 to 163 pips, from the second leg's extreme to the far extreme of the move.
How many of these gold days were textbook?
Six of sixteen cleared the whole Asian range. Ten stopped inside it, which we grade partial. Both of the days worked in full below are partial.
Is a gold M or W a double top or a double bottom?
It looks like one, and it differs in where the second leg stops. A double top stops at the first high. Here the second leg goes past it, which is the stop hunt. Our page on whether a double top is a stop hunt works that on other markets.