How to Trade Gold on FOMC Day: A Real Marked-Up Day, 17 June 2026
Dylan Forexia7 min read
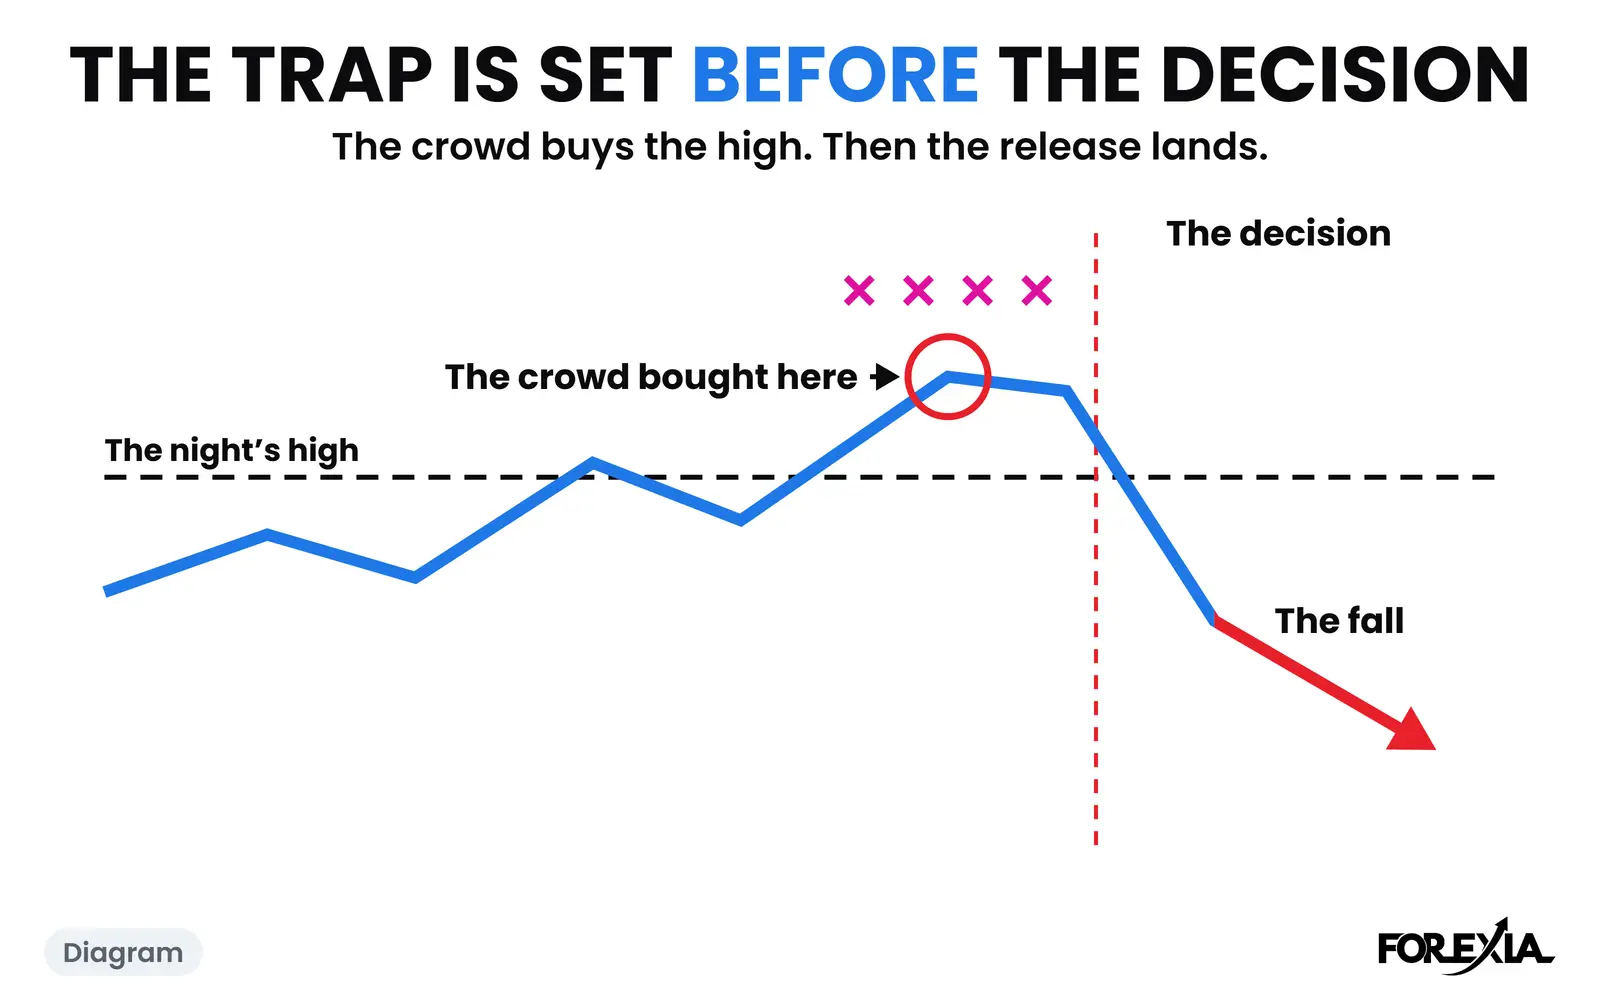
How to trade gold on FOMC day is not something this page can tell you, because what the Fed does has no fixed effect on gold, but what the day looked like can be set out candle by candle. On Wednesday 17 June 2026 gold made the high of its week at 4382.13 at 13:30, thirty minutes before the Fed's decision, and then fell 163 pips to 4218.81 by 15:30. The 14:00 candle alone dropped 95 pips.
This day was marked up afterwards, for study. It is not a signal, and a reversal seen afterwards is not a setup. On gold $1 is 1 pip, and all times are New York. For other releases see how NFP moves gold and how CPI moves gold, and for the whole subject, how to trade gold.
How to trade gold on FOMC day: what happened on 17 June 2026?
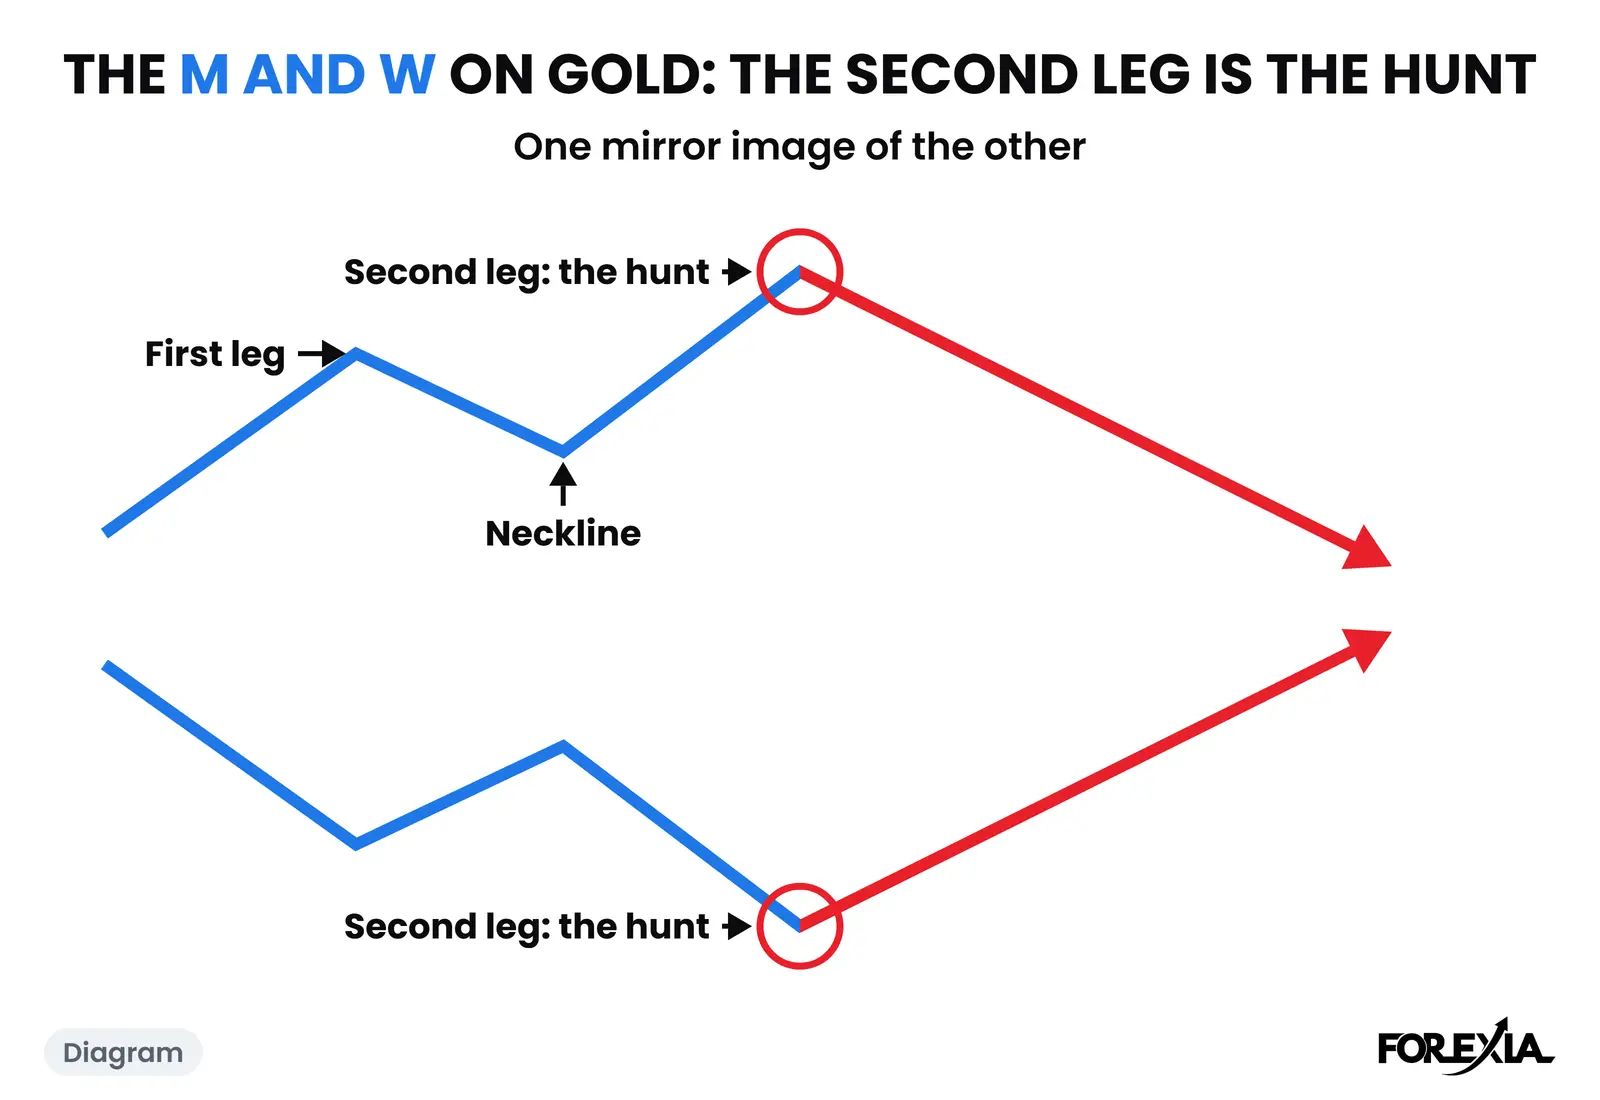
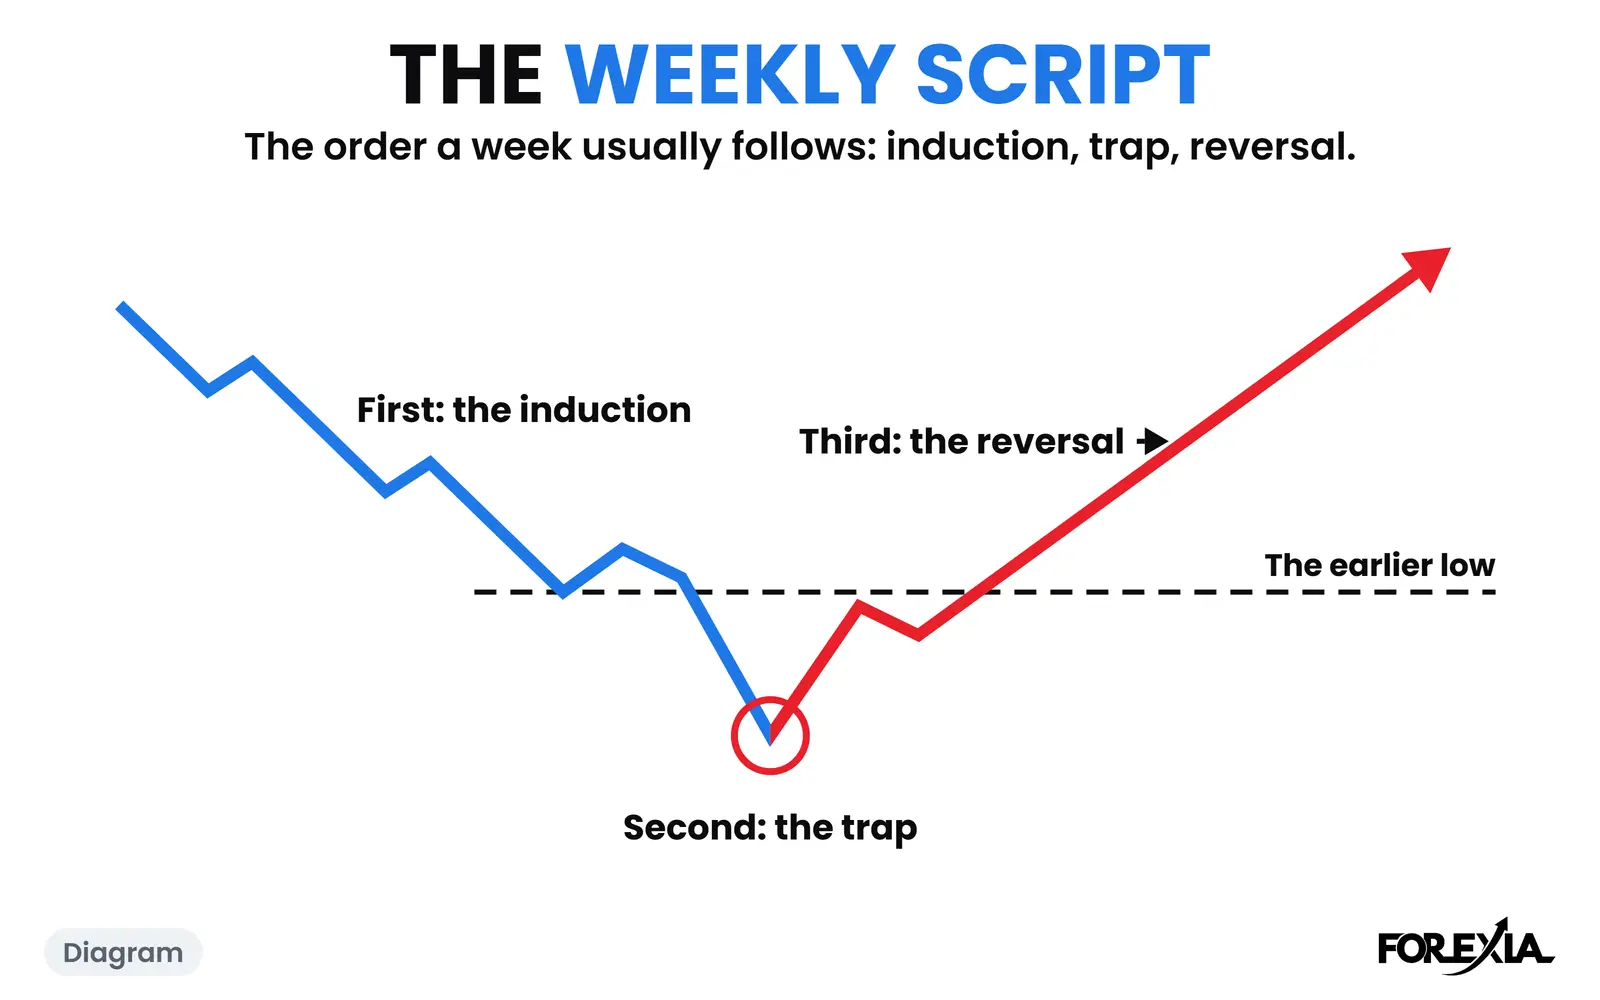
The night left a 32-pip range, 4317.41 to 4349.41. At 10:30 New York broke the high by 14 pips, to 4363.88, taking Tuesday's high of 4354.90 on the way. That was the first leg, the breakout the crowd buys. Price pulled back to a neckline at 4330.61, then ran a second leg to 4382.13 at 13:30, 18 pips past the first. We read the second leg as the stop hunt: it took the stops that gathered above the first leg and trapped everyone who bought the new high.
The Fed decision came at 14:00. The candle opened at 4379.57, 2.56 pips under the high, fell to 4276.90 and closed at 4284.19, a range of 103 pips and a body of 95. Gold reached 4218.81 by 15:30 and closed the New York afternoon at 4256.85. Pending home sales had come at 10:00, with a 21-pip candle.
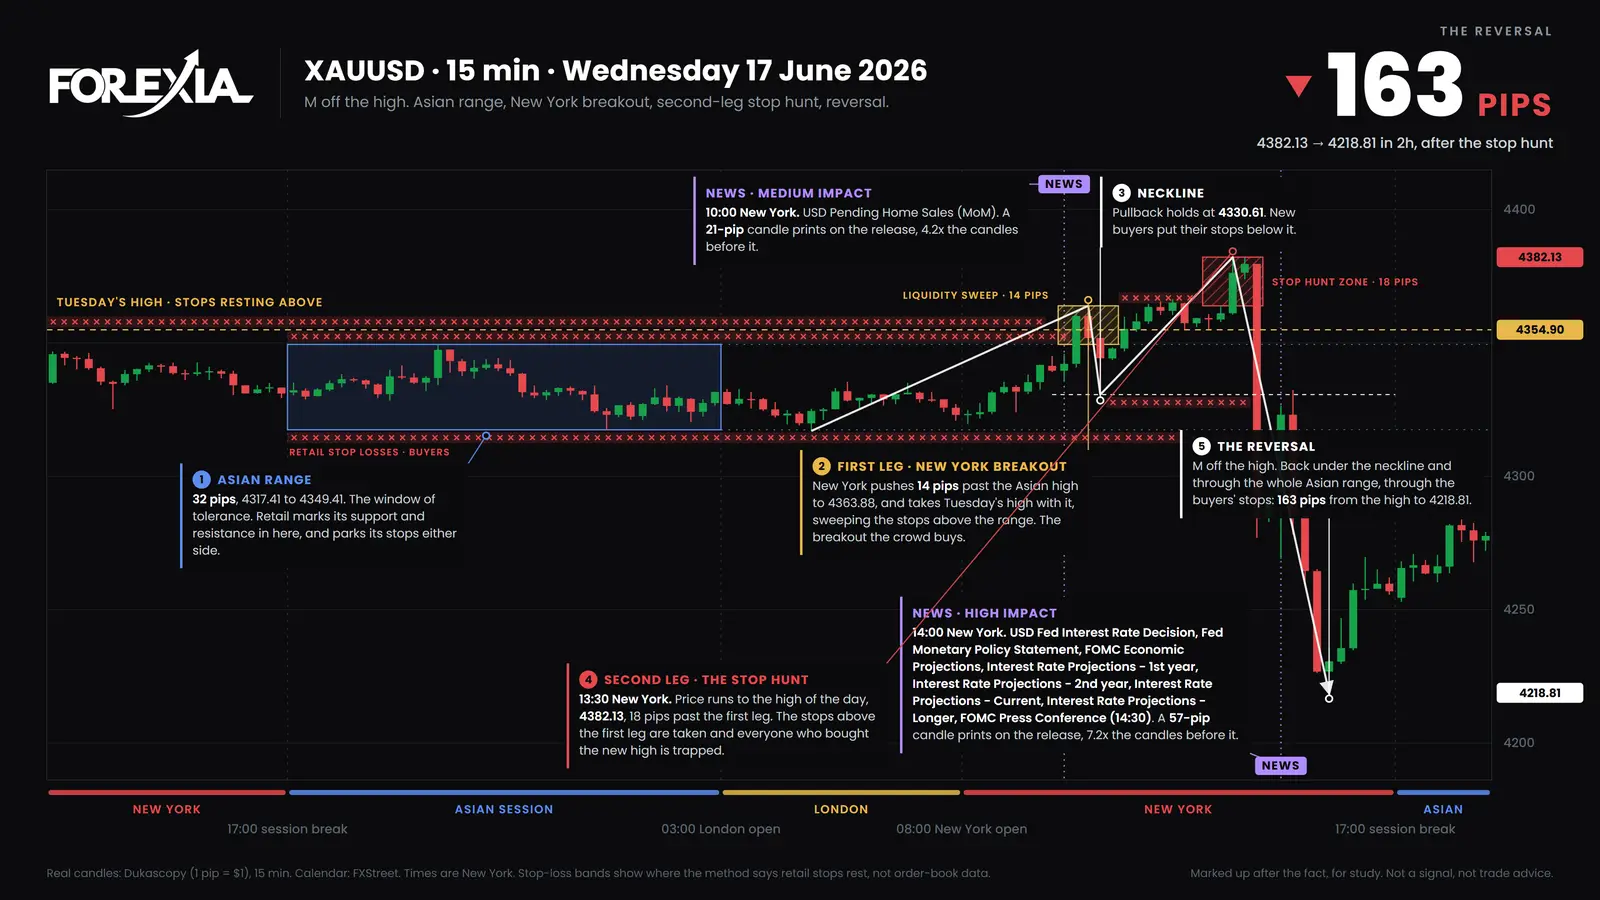
The markup grades the day textbook, with six of eight confirmations. The reversal cleared the whole Asian range, the second leg took the previous day's high and it was the high of the week. One confirmation, the high of the week, is only known when the week is over. And the low of the week came on Friday at 4121.44, 261 pips under the high.
Who was trapped, and where were the stops?
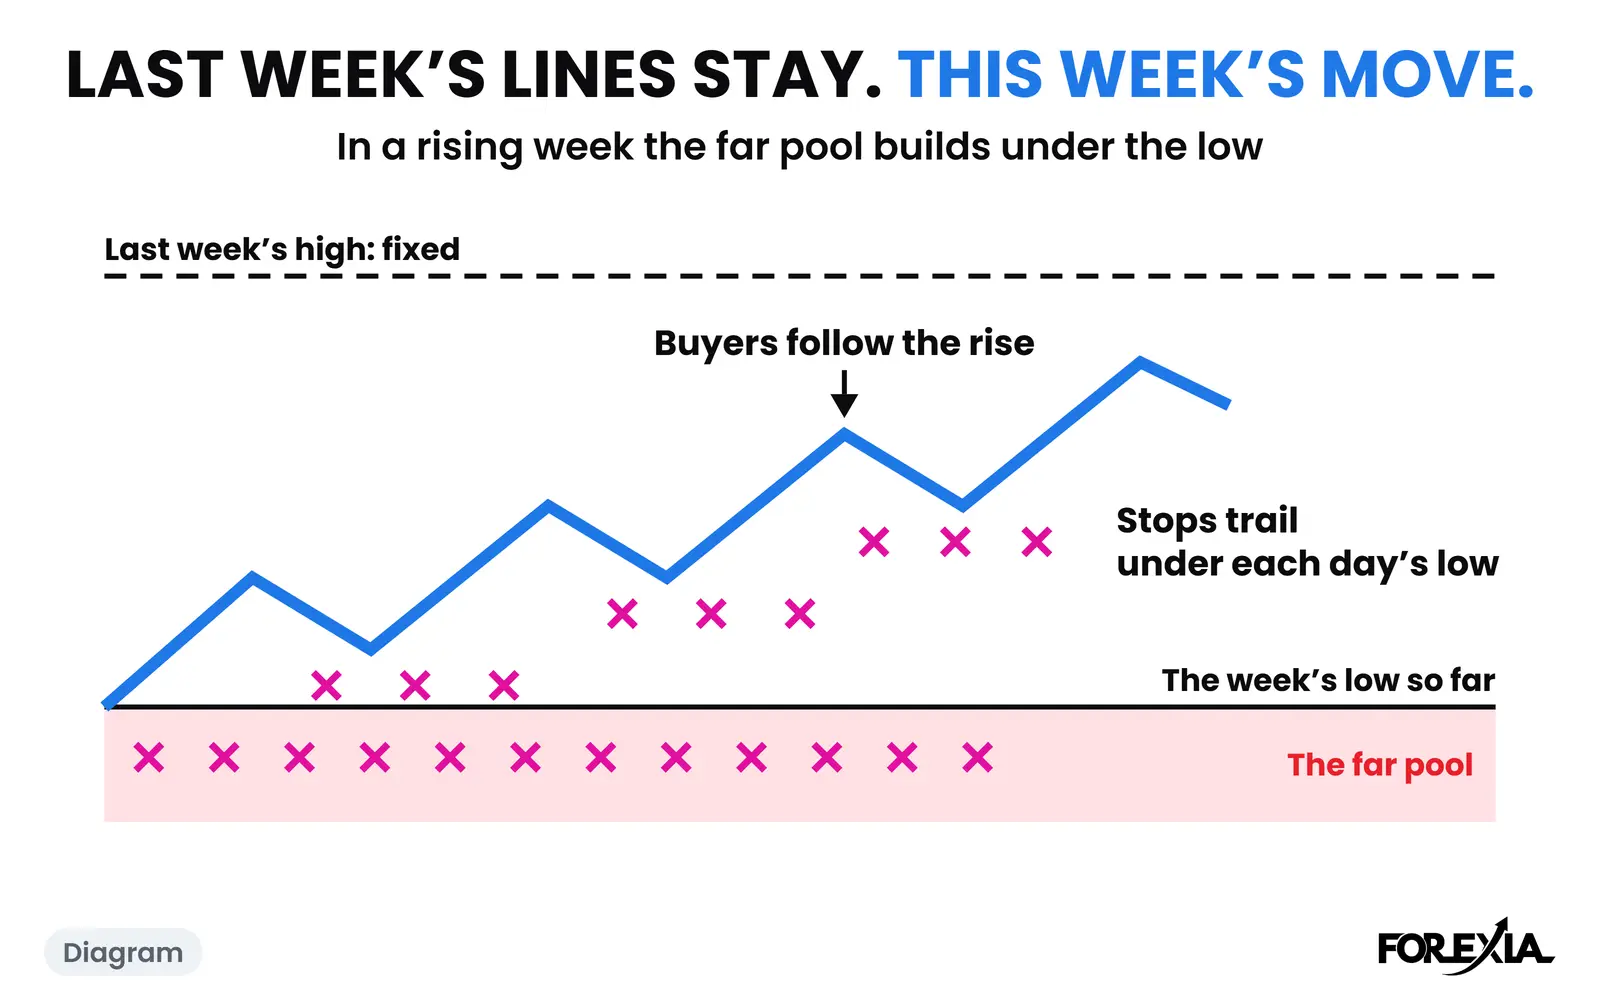
The crowd that bought the new high. Their stops sat in three places, and we read each from the structure, not from any order data:
- Above the Asian high, 4349.41. Sellers' stops, taken by the first leg.
- Above the first leg, 4363.88. The new stops of breakout buyers, taken by the second leg.
- Below the neckline, 4330.61. Buyers' stops, taken as the fall broke it. The Asian low at 4317.41 went too.
That is the shape of the M and the W. The Fed's release was not the cause we can show. It was the minute in which the fall happened, and nobody can say how much of the 95-pip candle was the decision and how much was the stops. Our calendar lists no high-impact release within 15 minutes of the hunt itself.
How did gold look on the other Fed days of 2026?
Our stored calendar and candles hold four decisions from April to September. Here is each release candle.
| Day | 14:00 candle | Range, pips | Candles before it, average range | What came before |
|---|---|---|---|---|
| Wed 29 April | Down, 4546.35 to 4525.43 | 28 | 7 | No marking |
| Wed 17 June | Down, 4379.57 to 4284.19 | 103 | 10 | An M's second leg at 13:30 |
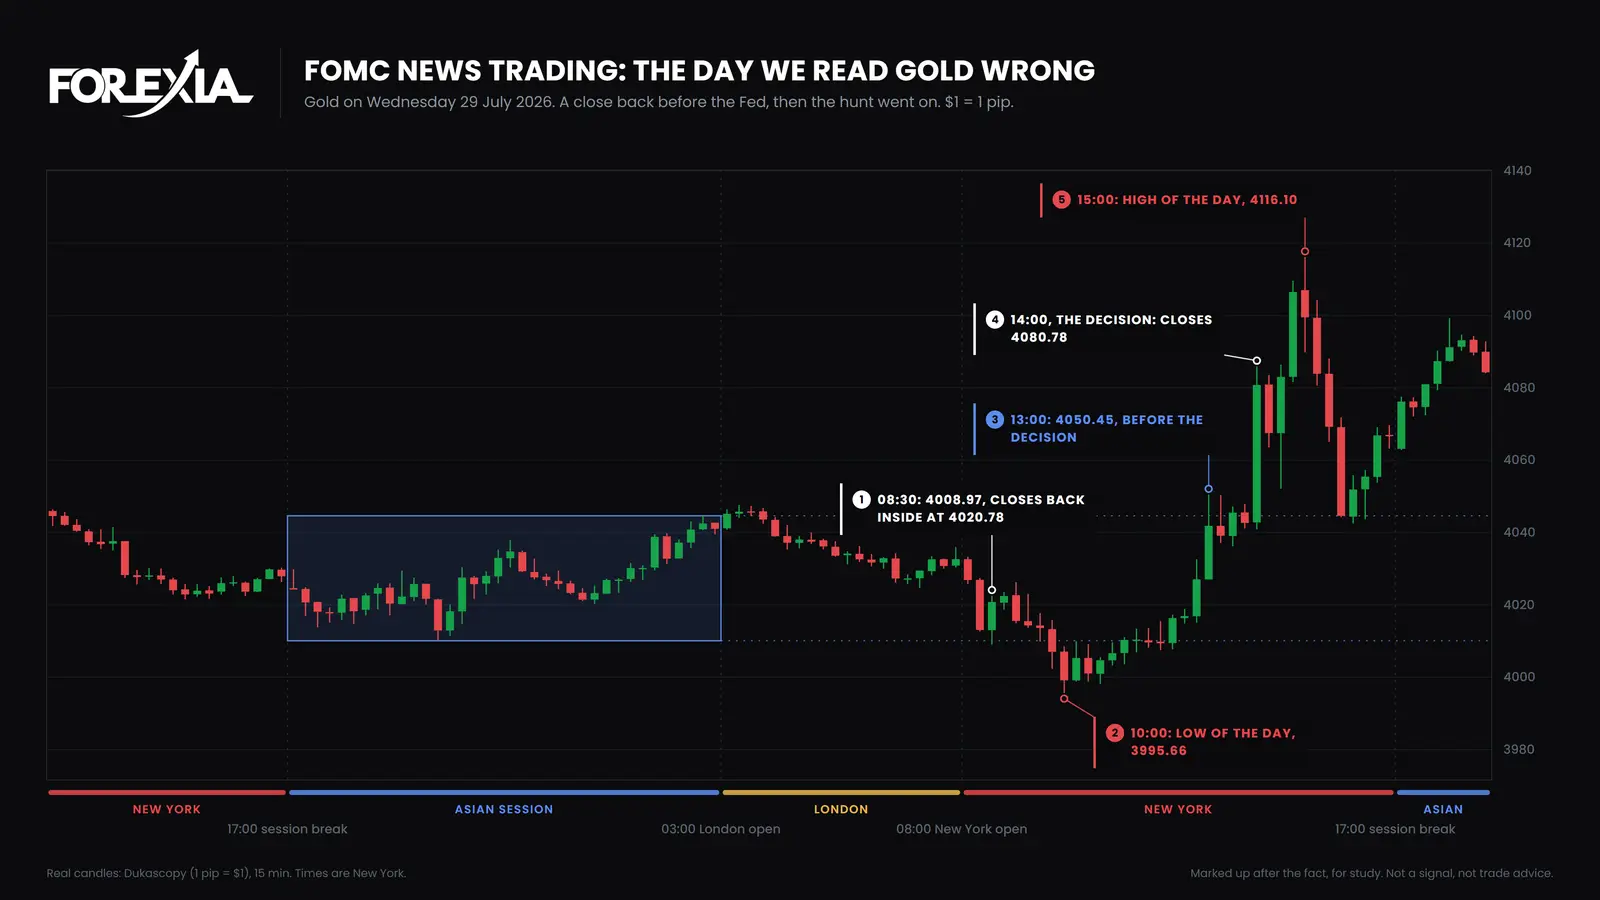
| Wed 29 July | Up, 4042.78 to 4080.78 | 45 | 14 | A low hunted at 10:00 |
| Wed 16 September | Down, 4356.95 to 4309.99 | 59 | 10 | An M's second leg at 14:00 |
Three of the four fell, and the one that rose came after a low. On 29 July the Asian range was 35 pips, 4010.05 to 4044.61. At 10:00 New York pushed 14 pips under it, to 3995.66, the breakdown the crowd sells, and gold then rose 120 pips to 4116.10 by 15:00, with the Fed's candle in the middle of the rise. We call that day Both Sides Hunted. FOMC news trading has it in full.
On 16 September the M's first leg came at 11:45, to 4361.34 over a 66-pip Asian range, and the second leg reached 4366.52 at 14:00, the minute of the decision. It then fell 132 pips to 4234.66. It is the same pattern as 17 June, two Fed days out of four with a second leg at or just before the release.
What does this say about FOMC day on gold?
Three things, none of them a rule. First, the release candle is large: 28 to 103 pips against 7 to 14 pips for its neighbours. Second, the hunt can come before it, in it or well away from it: 13:30, 14:00, or 10:00 on three different days. Third, the direction is not fixed. Gold fell on three of four decisions and rose on one, and a trader who guessed the direction of the decision would have had no way to know the direction of the candle.
That is why our note on what price does before the FOMC decision matters more than any forecast of the decision itself: the structure was visible ahead of time, and the answer to the question was not. Why price spikes both ways on FOMC has the same minute on other markets.
What did the chart show before 14:00 on FOMC day?
More than the release did. By 13:30 on 17 June three things were already on the chart: a night range of only 32 pips, a high that had taken Tuesday's high, and a second push that went past the first. In the hour before the decision gold traded between 4355.02 and 4382.13, so the decision candle opened at the top of that hour's range. None of that says what the Fed would do. It does say where the crowd's orders were, and that the release was going to land on them.
So the read on a Fed day is two questions that do not depend on each other. The first is where the stops are, which the chart answers. The second is what the decision does, which nothing on the chart answers. We look at the first and say nothing about the second, and the four days show why: three different answers to the second question and one repeated shape in the first.
What does this not show?
A few limits matter more than the figures.
- Four days. They are every Fed decision in our stored data from April to September, and four is a small sample. The 29 April day has no marking.
- No rate figures. Our calendar holds no forecast or actual, so no decision is called hawkish or dovish here.
- A candle hides the minute. The real release moves faster than a 15-minute candle shows, and spreads widen.
- It is not a method. We ran our setup on gold as a fixed rule with real spreads and costs, and it lost between 0.089R and 0.146R a trade in every period. The stop hunt guide has the test and its limits.
From the three seats: retail trades the decision and the headline. The market maker, as we read it, sees a known minute and a pile of stops. The observer sees the structure before the release, and the candle after it.
Lesson 5.4.2 of the Signature Trade course works this day on the chart. Course 2 of ForexiaPRO, The Chaos Pattern, teaches the news minute.
Tools for this
Frequently asked questions
What time is the FOMC decision for gold?
14:00 New York, with the press conference at 14:30. On the four 2026 decisions in our stored calendar (29 April, 17 June, 29 July and 16 September) the 14:00 candle on XAUUSD ran 28 to 103 pips, against 7 to 14 pips for the candles in the hour before it.
Which way does gold go on FOMC day?
No rule shows up. The 14:00 candle fell on three of the four days and rose on one. On 17 June gold fell 95 pips in the candle, having made the high of the week 30 minutes earlier. On 29 July it rose 38 pips after a morning low.
Does gold hunt stops before the Fed decision?
On two of the four days an M's second leg printed just before or at the decision: 4382.13 at 13:30 on 17 June and 4366.52 at 14:00 on 16 September. On 29 July the low of the day was hunted at 10:00, and the high came at 15:00. A hunt can come before the release, in the release candle or after it.
Is there a gold strategy for FOMC day on this page?
No. We describe what the day looked like. Run as a fixed rule over 3,884 trades from 2012 to 2 October 2026, our setup on gold lost between 0.089R and 0.146R a trade in every period. The days were marked afterwards and are not signals.