How CPI Moves Gold: Seven Real XAUUSD Inflation Mornings, Candle by Candle
Dylan Forexia7 min read
How CPI moves gold: hard, in both directions inside a single candle, and with no reliable direction for the day. On seven US inflation releases in 2026 the 08:30 candle on XAUUSD ran 19 to 72 pips, against 8 to 15 pips for the candles before it. Six of the seven closed up, one down, and on two days the candle wicked about 45 pips the other way first.
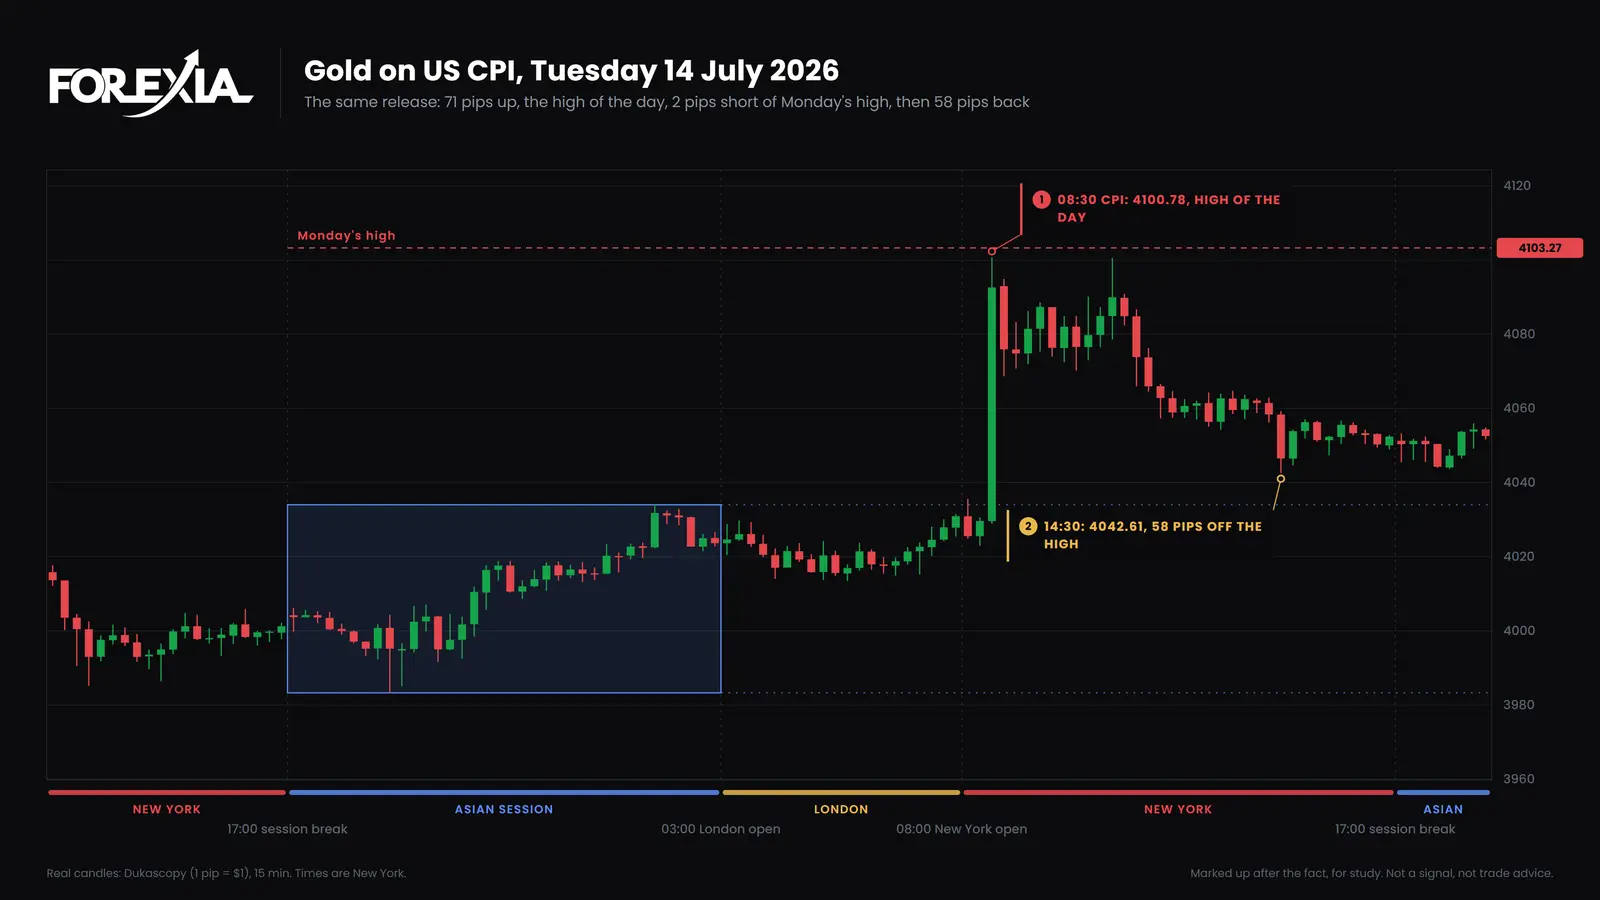
These days were marked up afterwards, for study. None is a signal. On gold $1 is 1 pip and all times are New York. For gold's other releases, see how NFP moves gold and gold on FOMC day, and for all markets, how to trade CPI.
How CPI moves gold: what does the release candle look like?
Like a spike. US CPI, the monthly consumer price index, is released at 08:30. The 15-minute candle that opens then holds the release. Here are the seven in our stored candles.
| Day | Release candle | Range, pips | Candles before it, average range | Wick under the open, pips | Wick over the open, pips |
|---|---|---|---|---|---|
| Fri 10 April | Up, 4762.47 to 4772.44 | 21 | 8 | 1 | 20 |
| Tue 12 May | Up, 4697.15 to 4702.51 | 19 | 10 | 8 | 11 |
| Wed 10 June | Up, 4141.10 to 4160.01 | 36 | 15 | 4 | 33 |
| Tue 14 July | Up, 4029.61 to 4092.61 | 72 | 8 | 1 | 71 |
| Wed 12 August | Up, 4426.80 to 4428.43 | 57 | 9 | 46 | 11 |
| Fri 11 September | Up, 4340.86 to 4353.61 | 70 | 10 | 49 | 21 |
| Wed 14 October | Down, 4152.45 to 4092.98 | 69 | 7 | 1 | 68 |
The range is the candle's high less its low, and the average is of the four candles before it. The candle was 2 to 10 times the size of its neighbours. The two most interesting rows are 12 August and 11 September, where the candle went about 45 pips under its open before it closed near or above it. A trader who read the first second of those candles saw a fall, and a trader who read the close saw nothing. On 14 October the candle went the other way and the move held.
Our stored calendar holds no forecast or actual figures, so we do not say which release was hotter than expected.
Did the candle's direction hold through the day?
On four of seven days it did, and not by much on some. This table follows each day from the open of the release candle to the 17:00 close.
| Day | Release close to the 17:00 close | Open of the release candle to 17:00 | Same side as the candle? |
|---|---|---|---|
| 10 April | −26 | −16 | No |
| 12 May | +12 | +17 | Yes |
| 10 June | −88 | −69 | No |
| 14 July | −40 | +23 | Yes |
| 12 August | −21 | −19 | No, the candle was flat |
| 11 September | −6 | +7 | Yes |
| 14 October | +12 | −47 | Yes |
On 10 April and 10 June gold rose in the release candle and ended the day lower, on 10 June by 69 pips. On 14 July it kept most of a 63-pip body. In six of seven the move after the release candle went against it a little or a lot, by up to 88 pips. That is the point of a known minute: the spike is not the day, and the day can sit on either side of it. For NFP the same test gave a steadier answer on five days, which is why we do not carry a rule from one release to the other.
Is the CPI candle a stop hunt on gold?
Sometimes, and sometimes it is a break. On Friday 11 September the Asian range was 60 pips, 4300.49 to 4360.85. The 08:30 CPI candle ran 9 pips under the low, to 4291.95, and closed back inside the box at 4353.61. Gold reached 4402.27 by 09:45, 110 pips off the low. We read that as the stop hunt, which most traders call a liquidity sweep. On 14 July the candle ran 66 pips over the Asian high of 4034.01 and no candle closed back inside, a break and not a hunt.
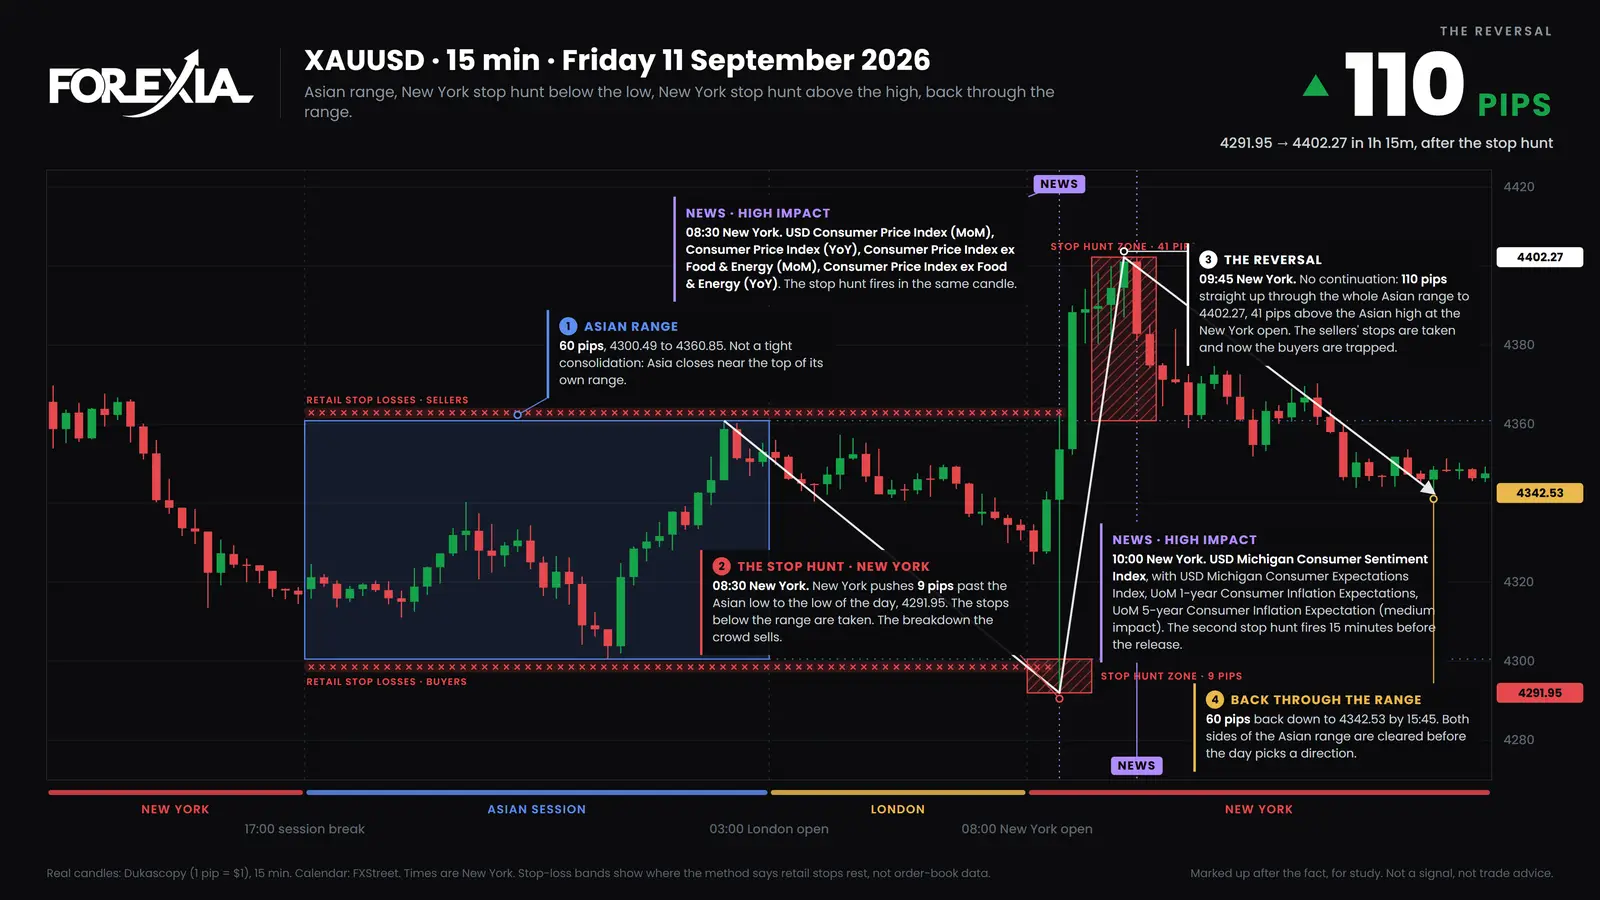
We call this News-Induced Liquidity: the minute is known, so orders gather around it. In our count from 2021 to 2026, 16% of gold's hunts printed within 15 minutes of a high-impact release, against 4% of the breaks that stayed. A release is a common place for a hunt. It is not the only place, and a hunt needs no release.
What about the day gold fell on CPI? Wednesday 14 October 2026
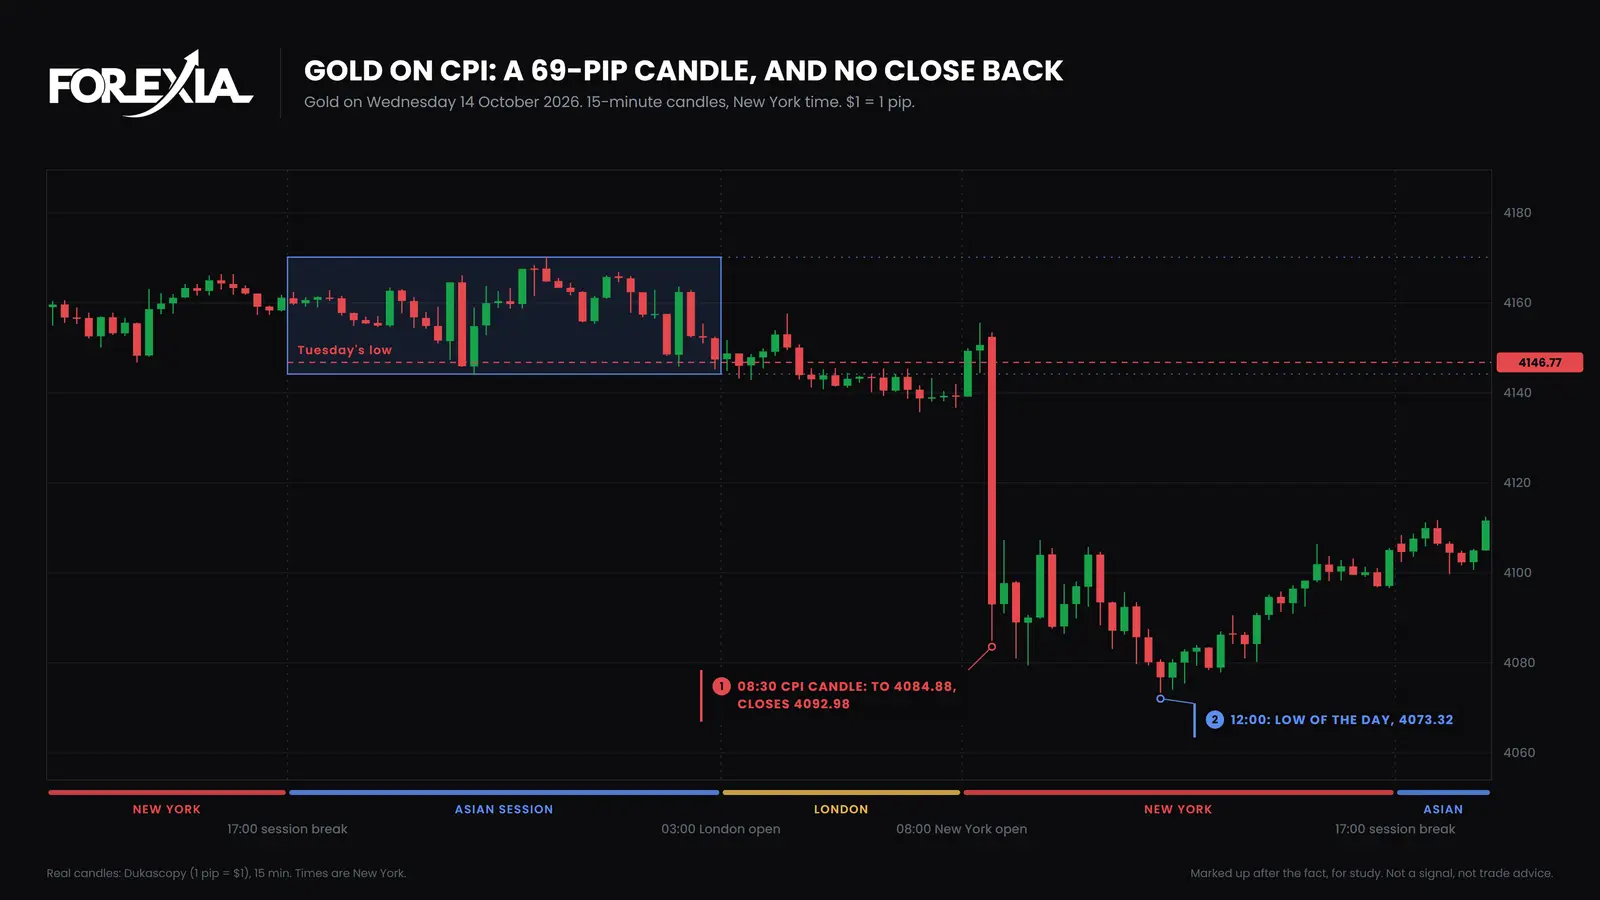
The release candle fell from 4152.45 to a low of 4084.88, closed at 4092.98, and the low of the day came at 12:00 at 4073.32. The day ended at 4105.08, its highest close after the release and still 42 pips under Tuesday's low. That is the cleanest of the seven: a candle of 69 pips against an Asian range of only 26, and the fall held. How to trade CPI has that day in full.
Why does gold react to inflation at all?
Gold pays no interest and is priced in dollars, so most of what moves it comes back to what else a holder could own. An inflation figure can change what the market expects from interest rates, and rates change the real yield, the Treasury yield after expected inflation. That is the usual story, and our page on why gold falls checks it against real yields and the dollar on three days and finds it fits some and not others. On a CPI morning the story is only a story until the candle has printed.
So the reason offered in print is the part to hold loosely. What we can do is describe the candle, and what it did to the night's range, which is what the tables above do.
How do you read a CPI morning on gold, afterwards?
In four looks, none of them a trade.
- The range. Mark the Asian range, from the 17:00 session break to 03:00. It was 26 pips on 14 October and 85 on 10 June, so the same candle means different things.
- The candle against its neighbours. Compare the release candle's range with the four before it. Here it was 2 to 10 times as large.
- The wicks. A wick of 45 pips under the open, as on 12 August and 11 September, is a move that did not hold, however it reads on the close.
- The close back. Check whether any later candle closes back inside the range. It did on 11 September and it did not on 14 July.
What does this not show?
A few limits matter more than the figures.
- Seven days. They are every CPI release in our stored calendar and candles from April to October 2026, not a chosen set. Seven is a small sample.
- No figures. The calendar holds no forecast or actual, so we cannot say what a hot or cool print does to gold.
- A candle hides the minute. A 15-minute candle shows where it opened and closed, and the real minute moves faster, with wider spreads.
- It is not a method. We ran our setup on gold as a fixed rule, and it lost money in every period. The stop hunt guide has the test and its limits.
From the three seats: retail trades the headline and the number. The market maker, as we read it, sees the known minute and the orders gathered around it. The observer sees the candle's size, its wicks and the range, and waits for the close.
The candles are Dukascopy's bid on 15 minutes, in New York time, and a different broker's feed can differ by a pip or two. The Asian range is the high and low from the 17:00 session break to 03:00. Course 2 of ForexiaPRO, The Chaos Pattern, teaches the news minute.
Tools for this
Frequently asked questions
How does CPI move gold?
In the first minutes, hard and in both directions at once. On seven US inflation releases in 2026 the 08:30 candle on XAUUSD ran 19 to 72 pips, against 8 to 15 pips for the candles before it. Six of the seven closed up and one closed down, and two had wicks of about 45 pips on the other side of the open.
Does the direction of the CPI candle show the direction of the day?
Not reliably. On four of the seven days gold ended the New York afternoon, at 17:00, on the same side of the release candle's open as the candle. On three it did not: 10 April and 10 June, when a rise was followed by a day that closed lower, and 12 August, when the candle was almost flat.
What time is CPI for gold?
08:30 New York, usually the second week of the month. The calendar lists it as high impact. In 2026 the releases we hold were 10 April, 12 May, 10 June, 14 July, 12 August, 11 September and 14 October.
Is the CPI spike a stop hunt?
Sometimes. On 11 September 2026 the 08:30 candle ran 9 pips under the Asian low and closed back inside, and gold then rose 110 pips. We read that as a stop hunt. On 14 July the candle ran over the Asian high and nothing closed back, which was a break.