Risk Reward Ratio Calculator: R, Break-Even and Why We Report R
Forexia Academy6 min read
Risk : reward
1:2
R multiple
2R
Break-even win rate
33.3%
What it assumes: you win the full target or lose the full stop. The break-even win rate is the share of trades that must win for wins and losses to cancel, 1 divided by (1 plus R). It leaves out spread, commission and slippage, which move it up, and says nothing about how often any setup wins. A sum, not advice.
The risk reward ratio calculator on this page gives the R a target offers, and the share of trades that must be won for the trade to break even. A 20-pip stop and a 40-pip target is 1:2, or 2R, and one trade in three has to be won, before costs, for the sum to cancel out. Enter a stop and a target in the same unit, and it does the division. That is arithmetic about a ratio, not a result and not advice.
How do you use the risk reward ratio calculator?
Enter two figures and read three.
- Stop distance: from your entry to your stop, in pips or in points.
- Target distance: from your entry to your target, in the same unit.
The answers are Risk : reward, the R multiple and the break-even share of trades that must be won. Both distances must be above zero. Nothing you type is kept, and the unit does not matter as long as it is the same for both. On gold, our charts count $1 of movement as a pip.
How are R and break-even worked out?
There are two sums.
R = target distance ÷ stop distance
Share of trades that must be won = 1 ÷ (1 + R)
If the stop is 20 pips and the target 40, R is 2. One trade in three has to be won: 1 ÷ 3 is 33.3%. Lose two and win one at 1:2, and the three trades cancel out. The calculator assumes you win the whole target or lose the whole stop, with no spread, commission or slippage. Those costs move the break-even point up.
Here is the break-even point for six ratios:
| Risk : reward | R | Share of trades that must be won to break even |
|---|---|---|
| 1:0.5 | 0.5R | 66.7% |
| 1:1 | 1R | 50.0% |
| 1:1.5 | 1.5R | 40.0% |
| 1:2 | 2R | 33.3% |
| 1:3 | 3R | 25.0% |
| 1:4 | 4R | 20.0% |
The table is a property of the ratio. It says nothing about how often any setup is reached, and a wider ratio usually means a target that is hit less often. That is why a good ratio is no reason to take a trade.
What does a real day show about the ratio?
A ratio is only as good as the stop under it. Here is gold on Friday 11 September 2026, from the site's own candles, New York time.
The 08:30 candle, US CPI, opened at 4340.86. It ran down to 4291.95, up to 4362.23 and closed at 4353.61. Take a buyer at the open. 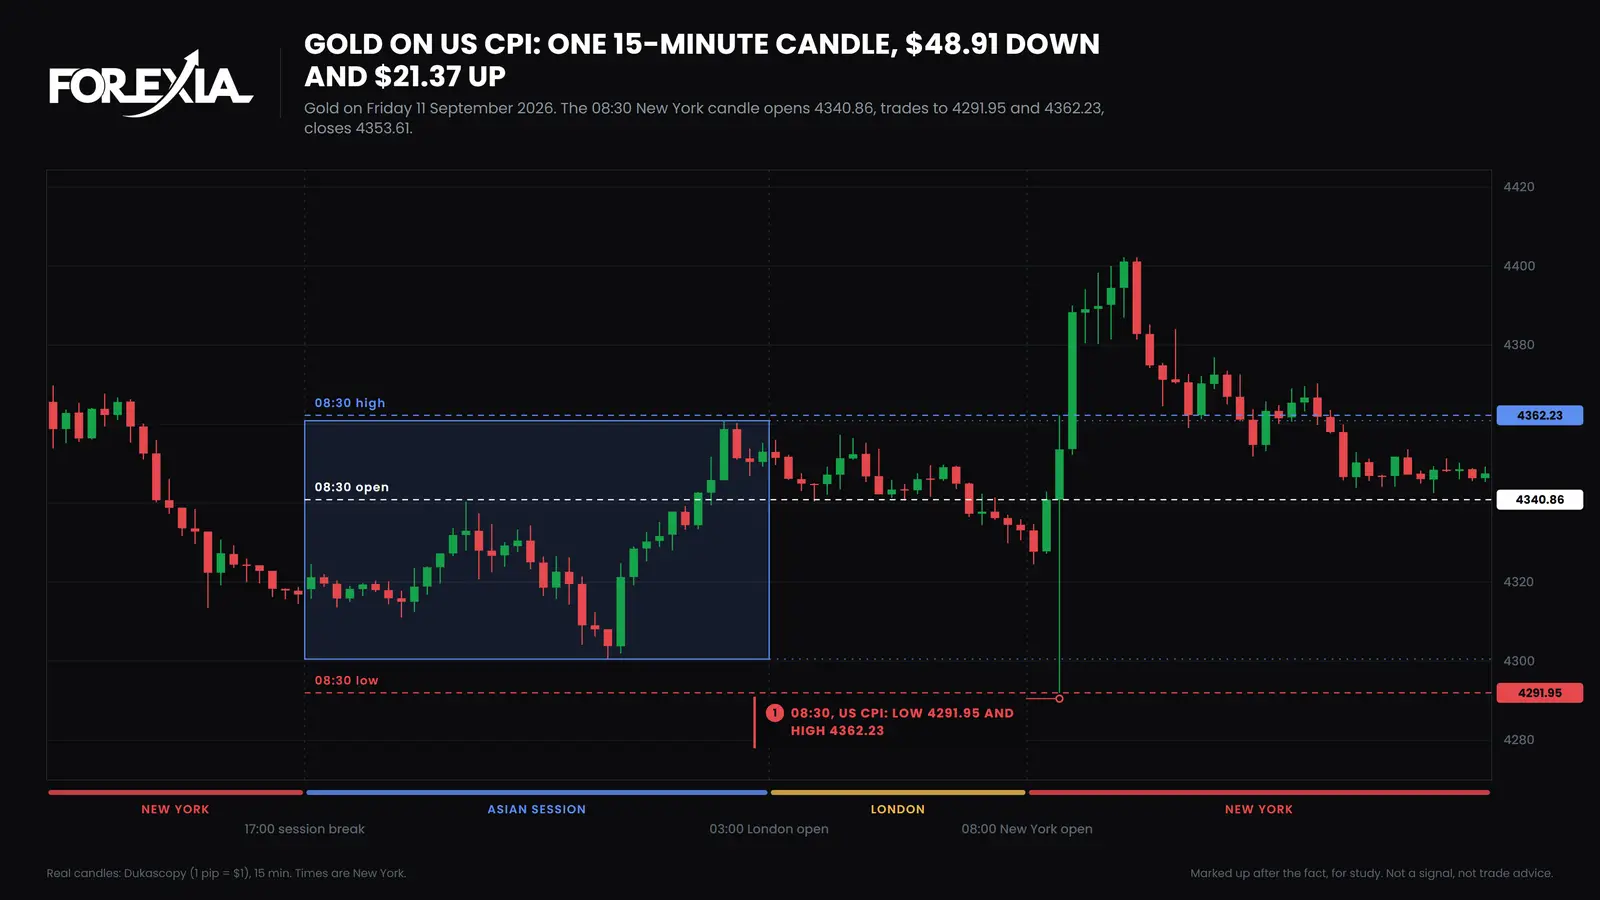
The sums below are chosen for the example and are not a setup, and a move seen afterwards is not one either.
- The stop. Below the candle's low of 4291.95, say at 4291.00. That is 4340.86 − 4291.00 = 49.86 pips away, at $1 to the pip.
- The targets. A 1R target is 49.86 above entry, at 4390.72. A 2R target is 99.72 above, at 4440.58.
- The day. The best price after the open was 4402.27, at 09:45. That is 61.41 above entry, which is 1.23R on this stop. The day never reached 4440.58.
Now a tighter stop. A $10 stop at 4330.86 makes a 2R target only $20 away, which is a pretty ratio on paper. The 08:30 candle's low was $48.91 under the open, so that stop was passed in the first candle, and the trade was over before the ratio could matter. A ratio says nothing about whether the stop survives, and the stop's place is where the lot size calculator starts: it sizes a position from the stop you chose.
How do you read the ratio and the stop together?
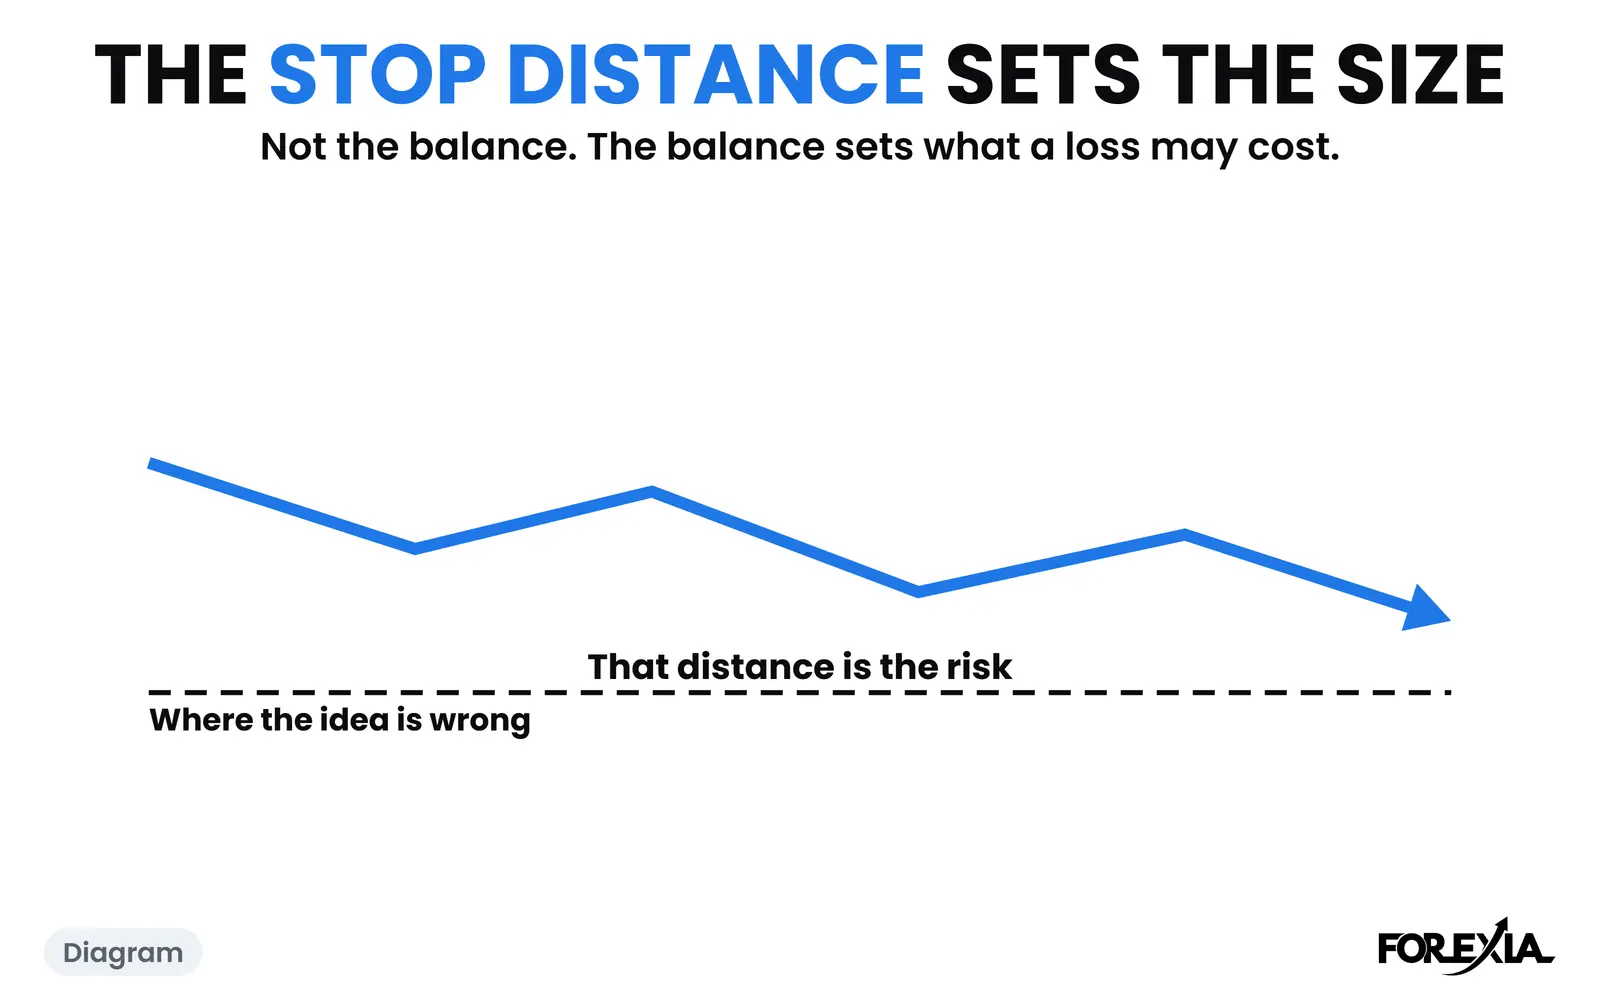
Three habits keep the ratio honest. First, set the stop where the trade is wrong, and then read the ratio off it, never the other way round. A target is a distance you pick, but a stop that is too tight for the market's own noise is a loss however wide the ratio looks.
Second, use the same unit for both distances and compare them on the same chart. On gold, 49.86 and 99.72 are dollars of movement, and on EUR/USD 20 and 40 are pips. Mixing a pip count from one source with a stop from another is how a 1:2 turns into a 1:20 by mistake.
Third, add the costs. A spread of 2 pips on a 20-pip stop makes the real stop 22 and the real target 38, so 1:2 becomes 1:1.73, and the break-even share moves from 33.3% to 36.7% of trades that must be won. The calculator will show it if you enter 22 and 38.
Why do we report R and not a percentage of trades won?
Because a share of trades won says too little. A setup that is right two times in three can lose money if its losses are larger than its wins, and one that is right one time in four can make it if its wins are four times its losses. The ratio is exactly the size that the percentage leaves out.
So when our research reports on a rule, it reports in R, the average size of its trades in units of the risk, and it gives the count of trades beside it. Where the sample is thin, we say so. Nothing on this page is such a result: the table above is arithmetic, true of any strategy, and the calculator knows nothing about yours.
What should you check before you trust a ratio?
Ask where the target sits against the market's own range. A target 99.72 away on gold is a bigger day than gold's recent days have often given, and the average daily range calculator shows how many pips a market has covered lately. A target beyond that range is not impossible, but it is rare enough that the ratio flatters the trade.
Ask next what fills the stop. A stop placed just beyond an obvious high or low sits where many other stops sit, and a spike on a release can pass it and come back. The ratio was computed from the price you chose, and the fill may not match it.
Last, ask what the ratio is for. It is a way to see the cost of being wrong beside the reward for being right, before the trade, in one number.
What does the calculator assume?
It assumes the plain case, and each of these can differ on your account.
- Either the whole target or the whole stop. Real trades are often closed early, or by hand, or in parts.
- No costs. Spread, commission and slippage widen the stop and shrink the target, which moves the break-even point up.
- The same unit for both. Pips for one and points for the other gives a wrong answer with no warning, because ten points make a pip.
- A fixed ratio. It does not say how often a target of that distance is reached.
Trading leveraged products carries a high risk of losing more than you can afford. Nothing here is advice, and a favourable ratio does not make a trade safe.
To turn a stop in pips into a position, use the lot size calculator; the pip calculator shows what each pip of that stop is worth, and the leverage and margin calculator shows the margin it holds back.
Frequently asked questions
How do I calculate the risk reward ratio?
Divide the target's distance by the stop's distance, both in the same unit. A 20-pip stop and a 40-pip target give 40 divided by 20, which is 2, written 1:2 or 2R. The calculator on this page does the same sum, and it also gives the share of trades that must be won for the sum to break even.
What is an R multiple?
It is a result counted in units of the risk. If the stop is 1R, a target twice as far away is 2R, and a trade stopped out is a loss of 1R. R lets trades of different sizes and markets sit in one column. It leaves out spread and commission unless you add them.
What share of trades must be won to break even at 1:2?
One third, 33.3%, before costs. The formula is 1 divided by 1 plus R, so 1:1 needs half, 1:3 needs a quarter and 1:0.5 needs two thirds. It is arithmetic about the ratio, not a statement about how often any setup works.
Is a higher risk reward ratio always better?
No. A distant target is reached less often than a near one, and the ratio says nothing about how often. It also says nothing about whether the stop sits where price can reach it first. A wide ratio on a stop that is hit by a spike is a loss on any ratio.
Why does Forexia report R and not a percentage of trades won?
A share of trades won, with no size of win and loss beside it, can look good while losing money. R carries the size. Alongside R we report counts of trades and say when a sample is thin. This page's tool states the break-even arithmetic and no result of ours.