How to Trade CPI: Real Reactions of EUR/USD and Gold on Seven Mornings
Dylan Forexia10 min read
How to trade CPI starts with what the release has done, because nothing we have tested supports an entry, stop or target, and this page gives none. US CPI lands at 08:30 New York around mid-month. On seven real mornings EUR/USD and gold mostly moved together in the first minutes, and what followed agreed on only four of them.
All times are New York, a candle is named by the time it opens, and on gold we count $1 as 1 pip. Every price is Dukascopy's bid, from our own charts.
What is CPI, and when does it come?
CPI is the Consumer Price Index, the change in prices of a basket of US consumer goods and services, with a headline figure and a core figure that leaves out food and energy. It comes at 08:30 around the middle of the month, on any weekday, so take the date from the official schedule. What the figure means is on what CPI means in forex.
The textbook runs through rates. A number hotter than forecast means rates stay higher, so the dollar rises and EUR/USD falls. A cooler one does the reverse. On gold the guides disagree: some say hot inflation lifts it as a hedge, and others that higher rates push it down. We have not tested either as a rule.
Our read of this release is On CPI, the News-Induced Liquidity read applied to the inflation number. Below, each morning's candle is set against Tuesday's high and low, which were already on the chart. The guide to news trading sets it beside the other releases.
How did gold and EUR/USD react on 14 October 2026?
The same way all morning. In the afternoon both came off their lows, and only one got back to its level. CPI came in at 3.7% over the year against a 3.6% consensus, as USAGOLD reported it, so this is the textbook's hot morning.
Gold's Asian Box was 26 pips, 4144.18 to 4170.16. London fell through it and through Tuesday's low of 4146.77, reaching 4135.66 at 07:00. The 08:00 candle closed back over both at 4149.35, and the 08:15 candle at 4150.66.
The CPI candle opened at 4152.45. Its first minute reached 4116.19 and closed at 4127.98. The first five minutes ended at 4114.23, 38 pips under the open. It kept going, and the candle's low came at 08:43, at 4084.88. It closed at 4092.98, a 69-pip candle.
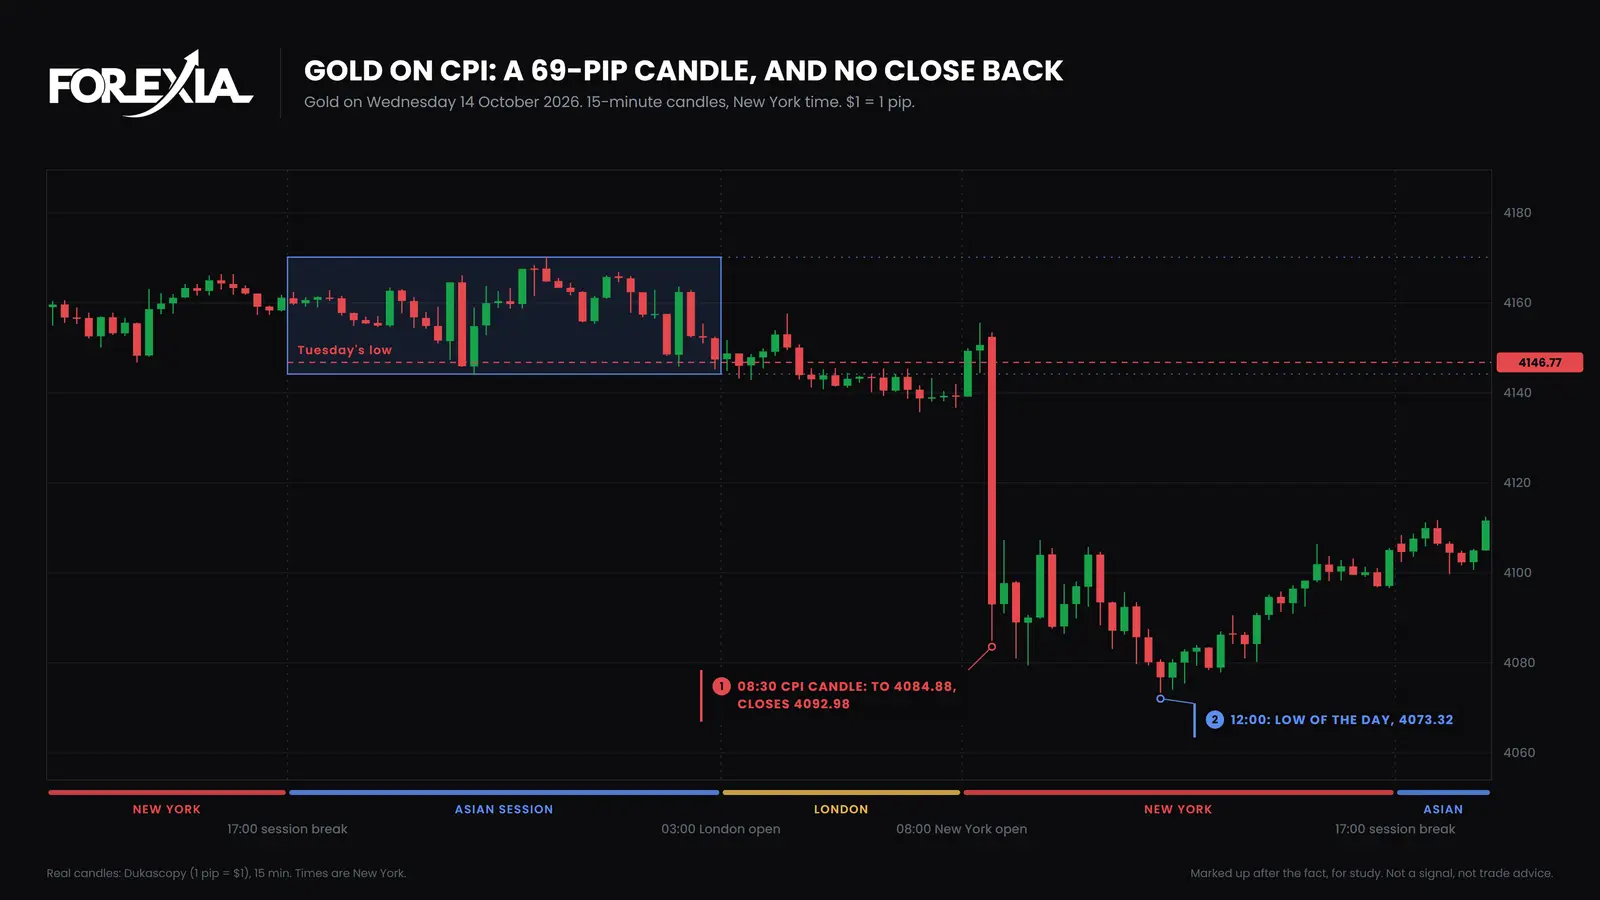
No candle closed back above Tuesday's low that day. The low came at 12:00 at 4073.32, and gold ended at 4105.08.
EUR/USD began the same way. Its first minute fell 40 pips, from 1.11973 to 1.11575, and closed on its low. The first five minutes ended at 1.11510, 46 under the open. The candle reached 1.11324 and closed at 1.11389, 65 pips top to bottom, and the low of the day came at 11:00 at 1.11128.
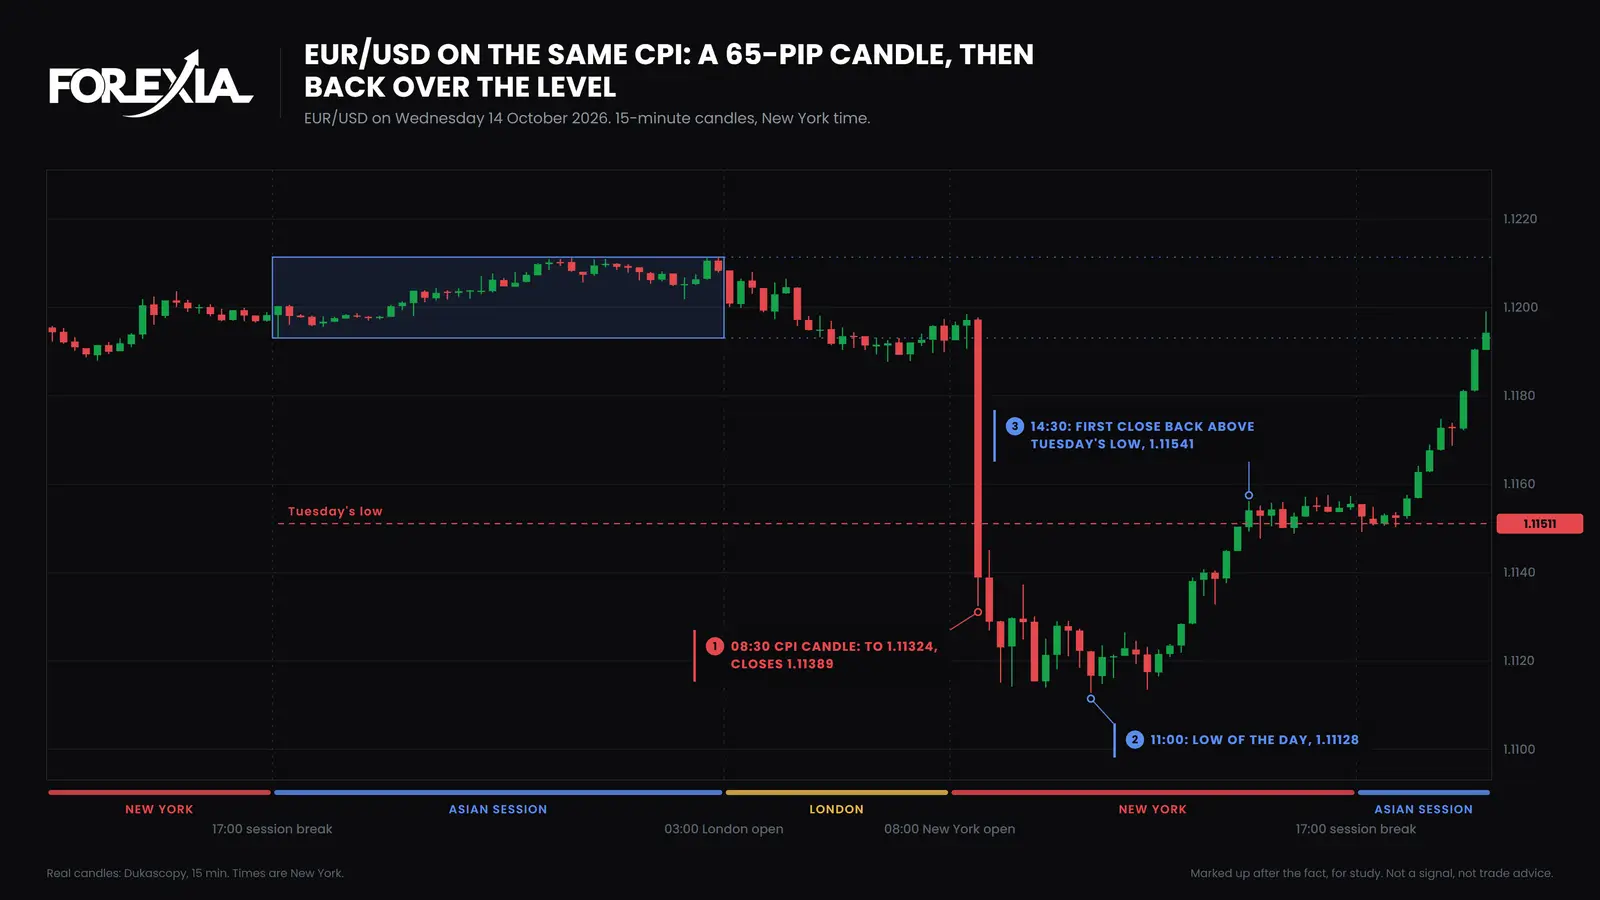
Then only one got back. EUR/USD climbed through the afternoon, closed back above Tuesday's low of 1.11511 on the 14:30 candle at 1.11541, and ended the day at 1.11556, 43 pips off its low. Our calendar has the Fed's Beige Book at 14:00, so not all of that is the number. Gold climbed too, ending 32 pips off its low, but at 14:30 it was still more than 50 pips under its level, because its low had gone 73 pips past that level against 38 on EUR/USD. One number and one first candle left one market back over its level and the other well under it.
What does a first minute that goes both ways look like?
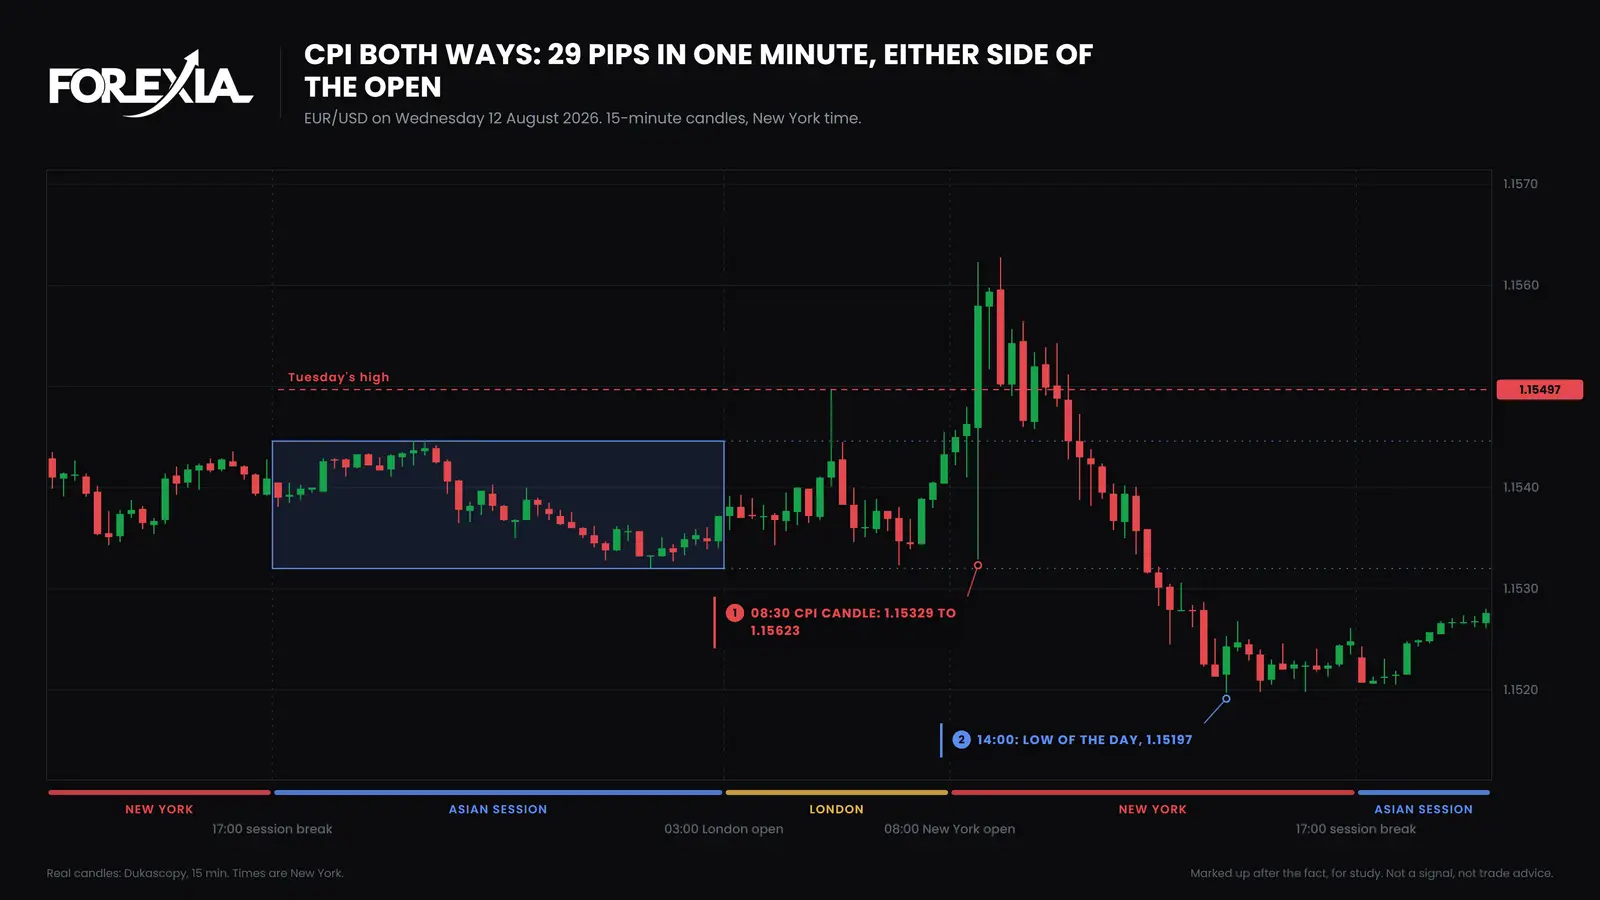
It looks like 12 August 2026. EUR/USD's first minute opened at 1.15459, traded 16 pips over that open at 1.15623 and 13 under it at 1.15329, and closed at 1.15355. That single minute traded 13 pips over Tuesday's high of 1.15497 and came within 2 pips of Tuesday's low of 1.15312. The first five minutes ended at 1.15486, 3 pips from where they began.
Gold's minutes that morning, on the same clock:
| Minute | Open | High | Low | Close |
|---|---|---|---|---|
| 08:30 | 4426.80 | 4431.47 | 4381.30 | 4393.66 |
| 08:31 | 4393.88 | 4409.85 | 4387.35 | 4408.40 |
| 08:32 | 4408.34 | 4418.45 | 4407.27 | 4417.15 |
| 08:33 | 4417.11 | 4423.19 | 4416.52 | 4421.63 |
| 08:34 | 4421.72 | 4431.60 | 4421.14 | 4424.90 |
Gold fell 46 pips under its open in the first minute and was back within 2 of that open by the fifth. The first minute's close looks like the answer, and four minutes later it was gone. The 15-minute candle closed at 4428.43, 2 pips over its open, after covering 57 pips. Gold's high of the day came on the 09:00 candle at 4441.24, 6 pips over Tuesday's high of 4434.97, and that candle closed back under it at 4421.80. The day ended at 4407.88.
EUR/USD's candle closed over Tuesday's high at 1.15580, and it stayed over until the 09:30 candle. By 14:00 it had traded 1.15197, 11 pips under Tuesday's low, and it ended at 1.15248. Both sides of Tuesday's range went on that one day.
Seven mornings, two markets: what do the first five minutes say?
Those two days were picked. Here is every CPI morning on our calendar from April, with nothing left out. "Range" and "Net" are the first five minutes, 08:30 to the close of 08:34. "After" is from that close to the day's last candle. All figures are pips.
| Release | EUR/USD range | Net | After | Gold range | Net | After |
|---|---|---|---|---|---|---|
| Fri 10 Apr | 10 | +8 | +1 | 21 | +18 | -33 |
| Tue 12 May | 9 | +3 | -7 | 11 | -4 | +21 |
| Wed 10 June | 15 | +3 | -15 | 36 | +21 | -90 |
| Tue 14 July | 55 | +36 | -31 | 72 | +66 | -43 |
| Wed 12 Aug | 29 | +3 | -24 | 50 | -2 | -17 |
| Fri 11 Sep | 28 | -15 | +16 | 56 | -11 | +18 |
| Wed 14 Oct | 48 | -46 | +5 | 40 | -38 | -9 |
Two things stand out, and neither is a rule.
The two markets mostly move together at first. They differed only on 12 May and 12 August, each by under 5 pips on each market. That fits a move in the dollar, and it does not say which way the number will send it.
The rest of the day often went against the first five minutes: on six of the seven on EUR/USD and five on gold, by as little as 5 pips. That looks like a reason to fade the first move, and it is not one. It is seven mornings, a day's close is not a trade, and the path matters: on 14 October the fall went a further 38 pips on EUR/USD and 41 on gold to the day's lows. Gold's largest "after" came on 10 June, when the fall arrived hours later, and why is gold falling takes up what moves gold on days like that.
The longer count is smaller than the candles suggest. On the six reports from 10 April to 11 September 2026, on seven majors and gold, the 08:30 candle held the day's high or low on 12 of 48 market-days, session break to session break, leaving out the spread spike on the day's first candle. Two of those mornings held on no market at all. It counts candles, not trades, and 14 October is outside it. On CPI has it report by report.
What were market makers doing on those mornings?
Nobody outside can see the orders, so this is our read. On 12 August stops rested over Tuesday's high and under Tuesday's low, close together, and EUR/USD's first minute went through one and within 2 pips of the other. We read that as orders on both sides being filled at the one minute everyone knew. On 14 October gold's morning had already been under Tuesday's low, and the candle ran on through the stops under London's low. Gold never closed back, which reads as a run with no hunt in it, while EUR/USD closed back hours later. At 08:45 the two charts looked alike, and only the afternoon told them apart. The CPI stop hunt goes minute by minute through a morning that turned on the release candle. The Three Seats split 12 August like this.
- Retail sold the first minute's close. Gold at 4393.66 had just dropped 33 pips and looked decided. It traded 38 pips over that close inside four minutes.
- The market maker, as we read it, had a thin market and a known minute. A triggered stop is a market order, so a candle can reach both sides in sixty seconds. A thin market could print that candle with no one aiming at it.
- The observer can say what was on the chart first. Tuesday's high and low were there before 08:30. Which one mattered could not be read until later candles closed.
How to trade CPI: what do the plans say, and what did they meet?
Guides offer three plans, and we did not test the first two. Here is what the textbook's plans met on these days, as what price did and not as how any plan scored. NFP breakout, pullback or stay out compares the same ideas on the jobs report.
- Trade the number against the forecast. On 14 October EUR/USD went the textbook's way until 11:00 and was back over its level by the afternoon, while gold stayed under its own. A small surprise, 3.7% against 3.6%, came with a 69-pip candle on gold, so on that morning the size of the surprise did not give the size of the candle.
- Wait for the knee-jerk, then trade the aftermath. On 12 August the knee-jerk reversed inside five minutes, and the day then went through both sides of Tuesday's range. We have no test of what comes after the wait.
- Fade the first move. On 12 August gold's first minute was undone inside five minutes. On 14 October the fall went a further 41 pips on gold, with no close back. The closest thing we tested is below, and it lost.
Spreads are at their widest in that minute, and our candles are bid only, so they cannot show what a fill would have been. A stop fires as a market order, so normal size is not normal risk. The Fed's day has its own shape, in what price does before the FOMC decision. More of one week around a release is in the markups of 7 September 2026.
What do our numbers support, and what do they not?
They support three plain things. The first minutes are uneven in size, from 9 pips to 55 on EUR/USD on these mornings. EUR/USD and gold usually start the same way. The candle holds an end of the day on a minority of market-days.
They do not support a direction or a size from the print: we quote one print, on one morning, and have not tested the textbook rule about the number. They do not support a rule that the first move fades, since 14 October ran on, and they give no target. The two worked mornings were chosen afterwards, and a reversal seen afterwards is not a setup.
The one test we ran close to any of these plans lost. A program flagged each hunt as it happened on seven dollar majors and gold, on 5-minute candles with real bid and ask, from February 2021 to December 2024, with costs of the real spread plus 0.7 to 0.8 pips a round trip ($0.15 on gold). Fading a hunt printed on a high-impact release, not only CPI, made -0.12R a trade on 1,037 trades, R being the amount risked, so about an eighth of the risk was lost on the average trade. It is one rule on one data source, and it says nothing either way about a person reading the chart. The stop hunt guide has the wider test.
Course 2 of ForexiaPRO, The Chaos Pattern, teaches this read step by step in lesson 2.3.5, CPI Day, Minute by Minute.
Frequently asked questions
What is the best way to trade CPI?
We cannot name one, and this page gives no entry, stop or target. Guides offer trading the number against the forecast, waiting for the first reaction to pass, or trading the aftermath. The one close to these that we tested, fading a hunt on a high-impact release, lost 0.12R a trade after costs from 2021 to 2024.
How do EUR/USD and gold react to CPI?
Usually the same way at first, as a move in the dollar would suggest. On seven releases from 10 April to 14 October 2026 the first five minutes went the same way on both markets on five, and the other two moved under 5 pips on each. The rest of the day agreed on only four of the seven. On 14 October 2026 both came off their lows that afternoon, and EUR/USD recovered its level while gold did not.
Does gold go up or down when CPI is hot?
The guides disagree: inflation can lift gold as a hedge, and higher rates can push it down. On 14 October 2026 US CPI came in at 3.7% against 3.6% expected, and gold's first candle covered 69 pips downward. That is one morning. On 12 August 2026 gold went 46 pips under its open in one minute and was back within five.
Does the first CPI move reverse?
On our seven mornings the rest of the day went against the first five minutes on six on EUR/USD and five on gold. That is the move after those minutes, and it is not a reason to fade them. Seven mornings is no sample, a day's close is not a trade, and on 14 October 2026 the first move went a further 38 pips on EUR/USD and 41 on gold to the day's lows.