COT Index Calculator for Forex: The Formula, Worked on Real Weeks
Dylan Forexia6 min read
Enter the three figures for one group of traders in one market.
The index is (net minus low) divided by (high minus low), times 100. Use the same measure for all three, and the same look-back for the high and the low: our report uses three years. A sum, not a signal.
This COT index calculator scores where a group of traders stands in its own range, from 0 at the low to 100 at the high. Enter this week's net position, the range's high and the range's low, and it gives the index and says whether the crowd is crowded. It works only on what you type, keeps nothing, and reads no report. It is a sum, not a signal.
The figures come from the CFTC's weekly Commitments of Traders report, which our guide explains from the start. What the number means, and what 20 and 80 do and do not tell you, is on our page on the COT index's meaning. This page is for doing the sum.
What is the COT index formula?
The formula places one figure inside a range:
COT index = (net − low) ÷ (high − low) × 100
The calculator rounds the answer to a whole number and calls the crowd by the same lines as our weekly report: crowded short at 20 or under, crowded long at 80 or over, not crowded between. Those lines are our choice, and other readers use 10 and 90.
Our report runs that formula with three choices of its own. You can make the same ones, or different ones, as long as you keep to them:
- The measure is the net position as a share of open interest: long minus short, divided by open interest, times 100.
- The window is the last 156 reports, which is three years, and it includes this week.
- The group is the large speculators, the non-commercials in the CFTC's legacy report, in the pair's terms. So the yen, franc and Canadian dollar futures are turned round.
How do you use the COT index calculator?
Take one group in one market, then find three numbers. The source is the CFTC's Commitments of Traders page, and its public data feed holds every week of it.
- Subtract short from long for this week, and divide by open interest if you use the share.
- Do the same for every report in your window, this week included.
- Enter this week's figure, the highest of the window and the lowest of the window.
The box answers with the index and the crowd. If the high is not above the low, or this week falls outside them, it says so and gives no number. It takes a percent sign, a pasted minus and a decimal comma. A figure such as 173,362 could be read two ways, so it asks you to type it without the comma.
A worked example: USD/JPY in October 2026
In the report counted on Tuesday 13 October 2026, large speculators in the yen future held 191,256 contracts long and 141,049 short. Yen futures run opposite to the pair, so on USD/JPY that is a net short of 50,207. Open interest was 373,502, so the share is −13.4%. Over the 156 reports to that date the share ran from −50.7% to +53.5%.
Enter -13.4, 53.5 and -50.7. The sum is 37.3 ÷ 104.2 × 100, which rounds to 36, and the crowd reads Not crowded.
Now USD/CAD in the report counted on 11 August 2026. Canadian dollar futures run opposite too: 12,854 long and 186,216 short in the future is a net long of 173,362 on the pair. Open interest was 364,104, so the share is 47.6%. The window ran from −12.5% to 55.8%. Enter 47.6, 55.8 and -12.5, and the answer is 88, Crowded long.
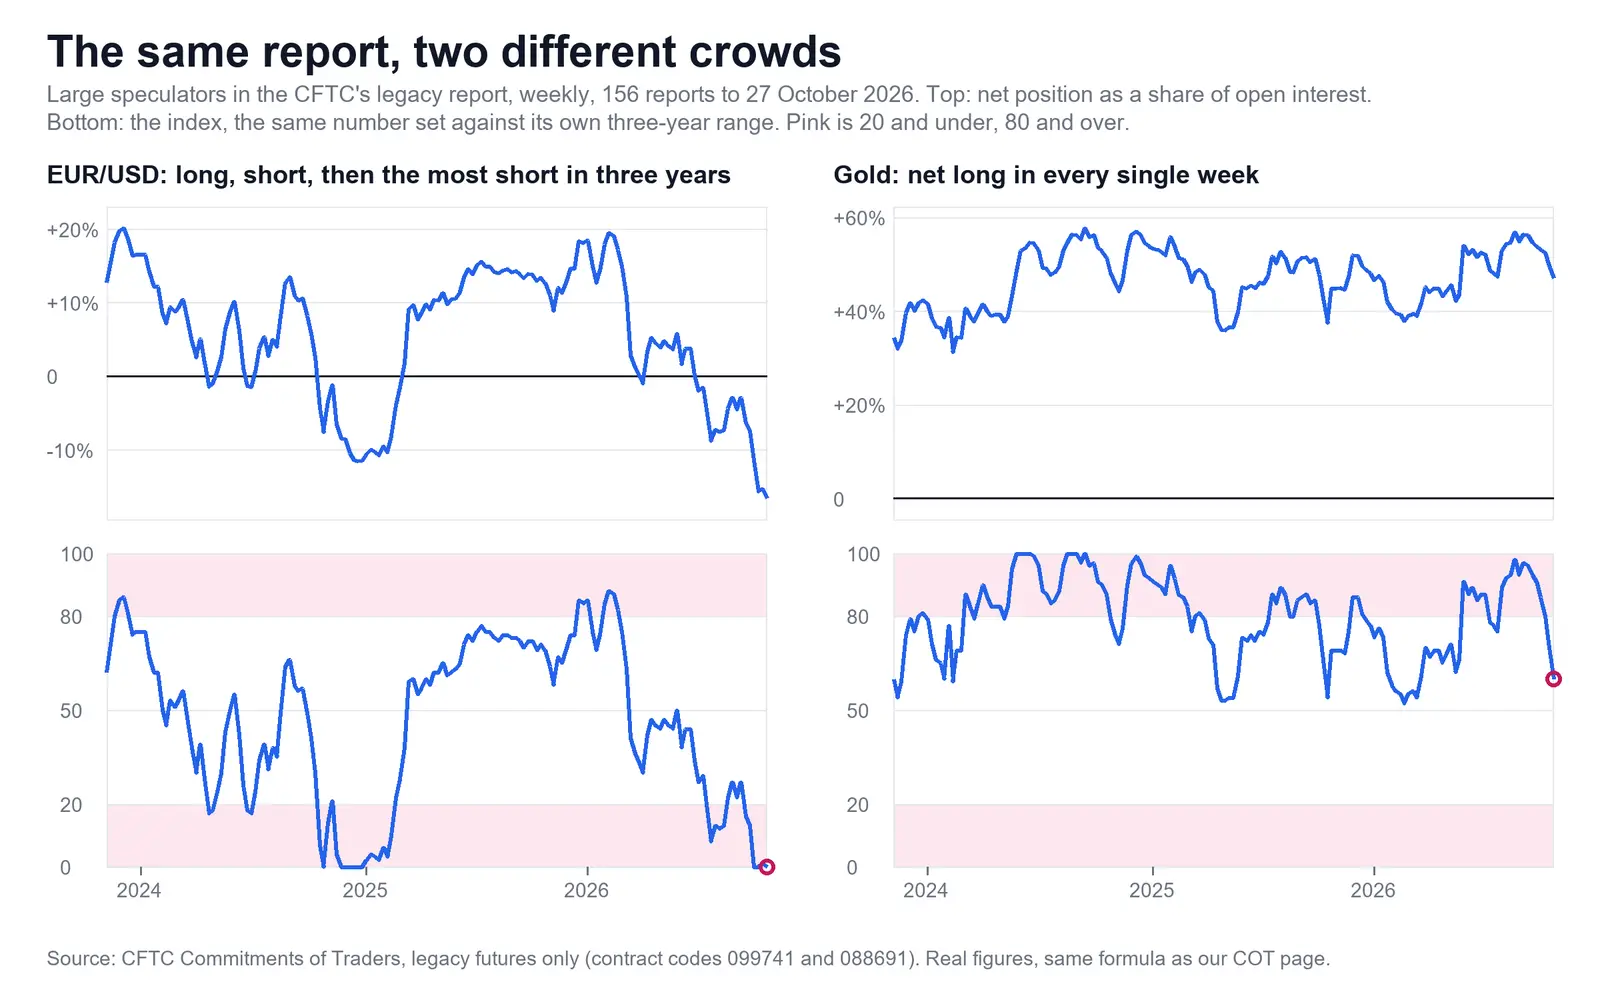
The picture below shows the same number over three years on two very different markets. The euro's crowd crossed from long to short and back, and gold's stayed long in every report, so a high reading is a different thing on each.
What does the calculator assume?
It assumes you have kept your three figures consistent, and it cannot check that for you.
- All three figures are the same measure, in the same market, for the same group. It accepts contracts, or a share of open interest, or anything else, and it cannot tell which you meant.
- Your window is your own. It takes the high and low you give. On 13 October 2026 USD/JPY read 36 over 156 weeks and 16 over 52, from one report.
- Whole numbers decide the line. It rounds first and then calls the crowd, so 20.4 becomes 20 and reads crowded short, and 79.6 becomes 80 and reads crowded long.
- "The crowd" means the group you entered. The words fit the large speculators, which is who our report calls the crowd. Enter dealers or commercials and it will use the same words.
- The window is long enough. Our report gives no index under 40 weeks of history. The calculator will work on any range you give it, even a thin one.
What are the common COT index errors?
Five cost the most, and the calculator can catch only the last two.
- Entering the futures' side on a turned-round market. USD/JPY's future on that October Tuesday was net long, so its share was +13.4%, in a range of −53.5% to +50.7%. Enter those and the answer is 64, not 36. The two add up to 100, give or take rounding.
- Comparing with a site that uses contracts. On 13 October 2026 gold read 80 on the share of open interest and 42 on raw contracts, because the market had shrunk. Our COT index meaning page sets that report out on eight markets. Neither answer is an error, but they cannot be compared.
- Reading the number as long or short. The index compares a group with itself. The euro's dealers on 13 October 2026 were net short 164,763 contracts at an index of 100, the least short they had been in three years as a share of open interest. This calculator would say Crowded long about a net short.
- Leaving this week out of the window. A new low must count as its own low. On 13 October 2026 the pound's share, −39.8%, was the lowest of its window, so the index was 0. Take that week out of the range and the calculator gives no number, because the week is outside it.
- Mixing units. Net in contracts against a range in percent falls outside the range and gets the same message. Read it as a sign that the figures are not the same measure.
What can the COT index not tell you?
It cannot tell you when, and it is always late. Positions are counted on Tuesday and normally published on Friday at 15:30 New York, so the report published on a jobs Friday shows a position from before that morning's figures. What price does in the minutes after a release like NFP is not in it.
We read a crowded end as the side not to join, an idea we call Fade the Crowd. That is a reading, and the index does not prove it. Large speculators are funds and not Dumb Money, though at the ends of their range we read them as trading much the same way. In our own tests, joining a crowded side lost, and fading it on a level hunt is promising and not proven.
Our COT Report page runs this sum each week for the seven majors and gold. The forex market hours clock shows your own time beside New York's, for placing Friday's 15:30, and the forex lot size calculator is the same kind of plain sum for a position's size. Both are with our other forex tools.
Course 1 of ForexiaPRO, Reading the Map, teaches this read step by step in lesson 1.3.2, Crowded: 20 and Under, 80 and Over.
Frequently asked questions
How do you calculate the COT index?
Subtract the range's low from this week's net position, divide by the range's high minus its low, and multiply by 100. A position at the low scores 0 and one at the high scores 100. The calculator rounds to a whole number, as our report does.
What numbers do I enter in the COT index calculator?
Three figures for one group of traders in one market: this week's net position, the highest it reached in your window and the lowest. They must be the same measure. Our report uses net position as a share of open interest, over the 156 reports up to and including this week.
Why does my COT index differ from another site's?
Nobody owns the formula, and the CFTC does not publish an index. Sites choose contracts or share of open interest, a window from 26 weeks to three years, and different groups of traders. Gold on 13 October 2026 read 80 on our share of open interest and 42 on raw contracts, from the same report.
Does a COT index of 80 mean price will fall?
No. It says where a position sits against its own past, and it has no clock. The calculator's line reads crowded long at 80 or over, and a market can stay there for months. Our tests of trading these readings, with their caveats, are on our research page.
Do I have to turn the yen, franc and Canadian dollar round?
Only if you want the index in the pair's terms, as our report does. Those futures are quoted the opposite way to USD/JPY, USD/CHF and USD/CAD. If you enter the futures' own figures, the index you get is 100 minus the one on the pair's terms.