Average Daily Range on Tuesday: What ADR Met Tuesday Means
Dylan Forexia6 min read
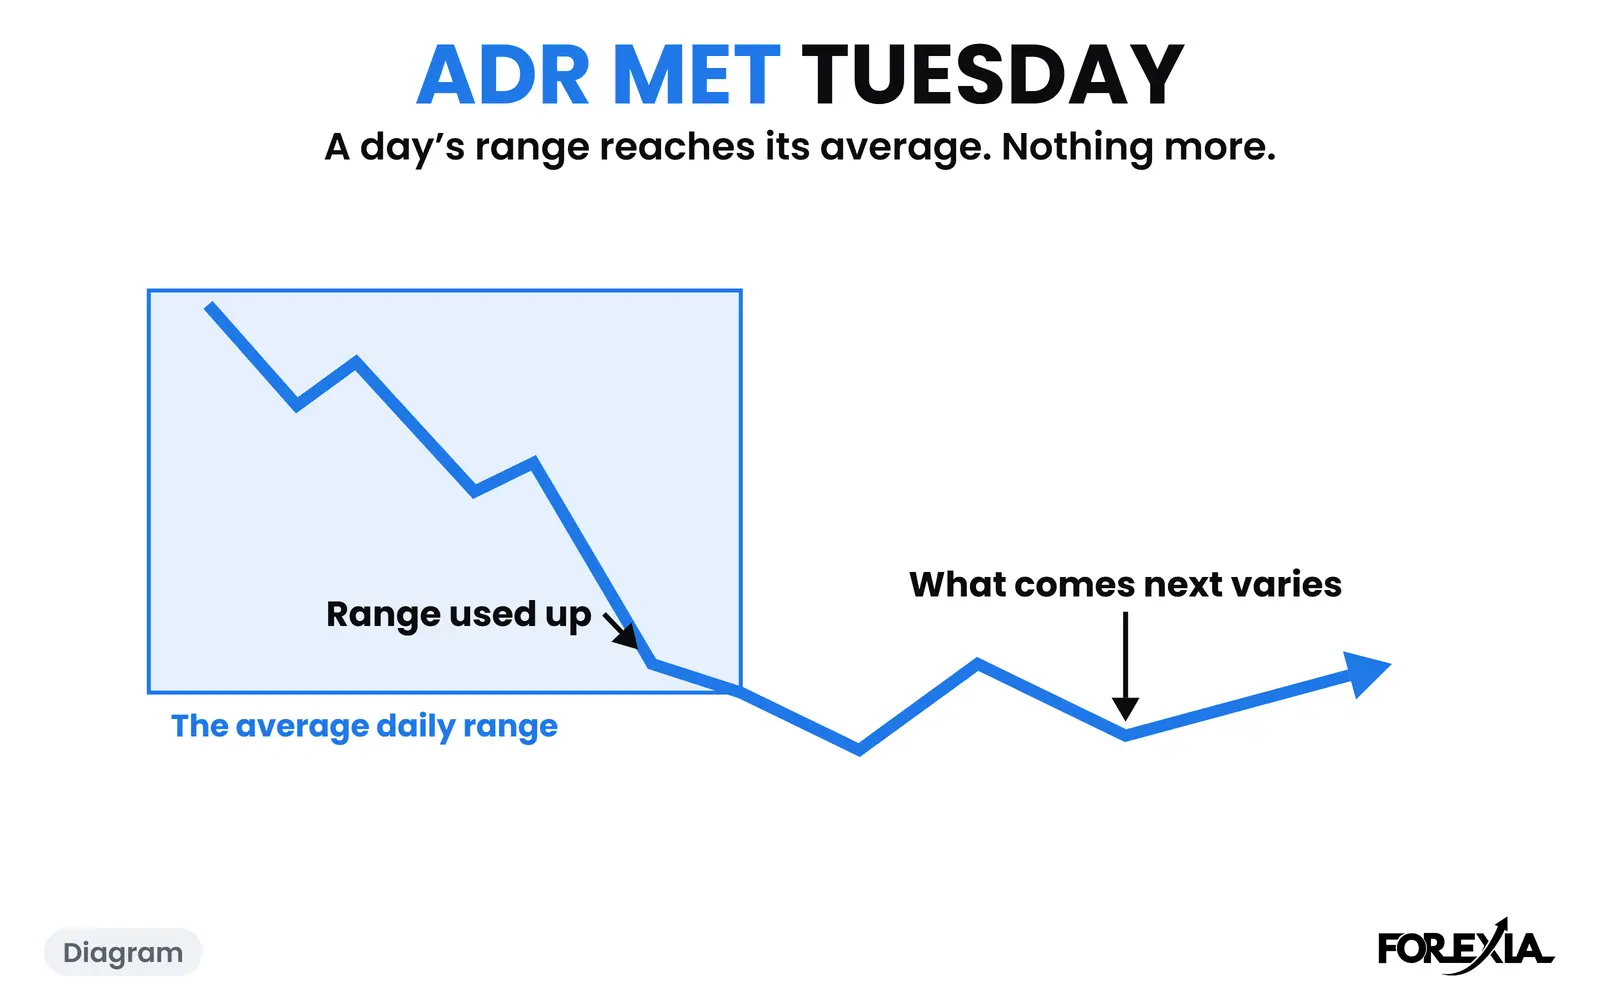
The average daily range on Tuesday is the usual size of a day, held against how much of it Tuesday has already used. When Tuesday's own range, from its high to its low, reaches the average of the 20 trading days before it, we say the average is met. We call that ADR Met Tuesday. It tells you the range is spent, and it is one reading in a week and not a signal.
This page explains the measurement, counts how often a Tuesday reaches it, and shows two real Tuesdays where it did and price went on. It sits in the weekly cycle as one confirmation among several.
What is the average daily range on a Tuesday?
It is a measurement, and our version is plain. Add up the high-to-low range of the 20 trading days before Tuesday and divide by 20. A day runs from the 17:00 New York session break to the next, so Tuesday starts on Monday evening. Then watch Tuesday's own high minus low as the day goes on. When it reaches the average, the average is met.
Other tools use 14 days or 20, and they call a market "exhausted" at a threshold of their own: 90% of the average in one script, the full average in another. Those thresholds are conventions and not findings. Ours differs in two ways. It asks only about Tuesday, because Sunday to Tuesday is where the Weekly Script puts the trend that pulls the crowd in, and it is only ever one piece of a read.
Use the same market only. An average of 59 pips means something on AUD/USD and nothing on gold, where we count $1 as 1 pip.
What does it look like when the range is met?
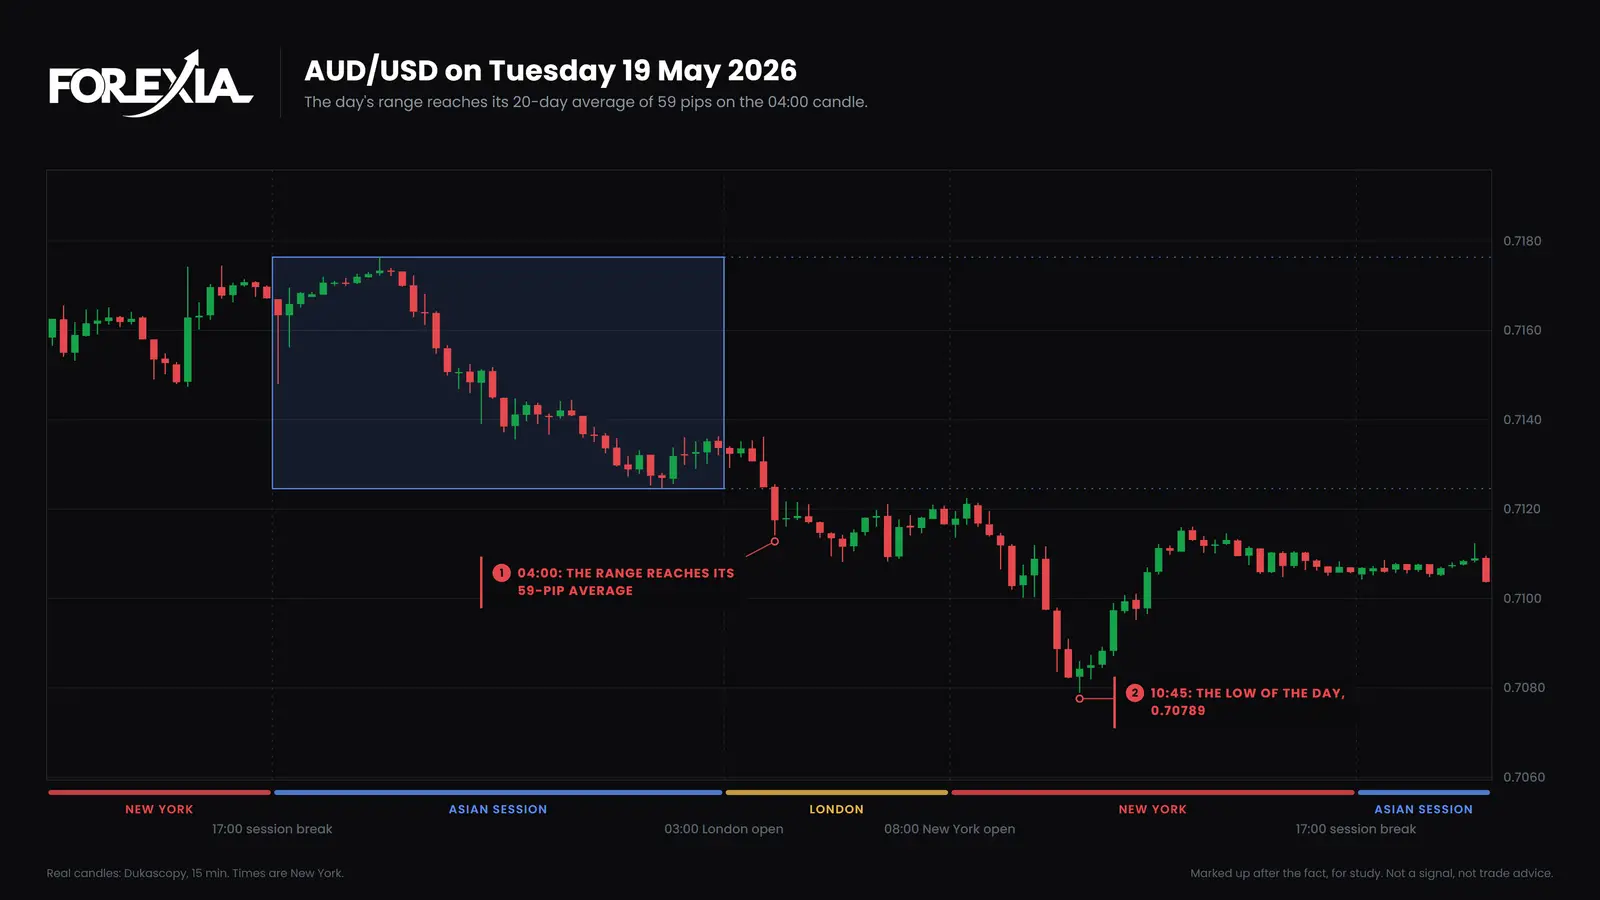
It looks like a Tuesday that has done a full day's work with hours to go. On AUD/USD on Tuesday 19 May 2026 the 20-day average was 59 pips. That session opened at 17:00 New York on Monday and had covered 62 pips by the 04:00 candle, when price was at 0.71141.
Price kept going. The low came at 10:45 at 0.70789, 35 pips under that candle's low. Tuesday's range finished at 98 pips, on a day that also carried the RBA's minutes. By 11:15 on Wednesday price was at 0.71739, 95 pips off that low.
The second day went the other way. On USD/CAD on Tuesday 23 June 2026 the average was 60 pips, and Tuesday's range reached it on the 13:00 candle. It finished at 67 pips, with the high at 1.42169. A reader who took that as the end was early: at 09:00 on Wednesday price reached 1.42477, 31 pips higher. It touched the same price again on Thursday, and by 09:15 on Friday it was at 1.41687, 79 pips off the high.
So on one day price kept falling after the average was spent, and on the other it kept rising before it fell. In neither case did the range being used tell you which.
How often does Tuesday reach its average daily range?
Less often than the days after it. We counted seven majors and gold on 15-minute candles. Met means the day's range reached the average of the 20 market-days before it. The first day tested on each market is in May 2026 and the last is Thursday 1 October, so Friday has a week fewer than the other days. A day's first candle has its low cut to its body, because that wick is often only the spread.
| Day | Days counted | Reached the average | Share |
|---|---|---|---|
| Monday | 176 | 56 | 32% |
| Tuesday | 176 | 49 | 28% |
| Wednesday | 176 | 78 | 44% |
| Thursday | 176 | 77 | 44% |
| Friday | 166 | 70 | 42% |
Read it with care. That is 22 Tuesdays on each of eight markets that often move on the same dollar, so the 176 are fewer separate events than they look. And 8 of the 49 Tuesdays came on one day, US CPI on 14 July 2026. The count is of ranges and says nothing about what price did next. The size of each weekday's day, as a share of a market's own average, is on the forex average range by weekday page.
How do you work out the average daily range yourself?
You need 20 finished days of one market, and one rule for where a day starts and ends. Write each day's high minus its low in pips, add the 20 figures and divide by 20. Keep the same break every time: ours is the 17:00 New York session break, so a rollover spike at the first candle does not move a day into the wrong date.
Then take Tuesday's range so far and divide it by that average. A reading of 1.0 or more is the average met. Two cautions apply. A day with a release in it can reach the average in one candle, as US CPI did on 14 July 2026, the one Tuesday that supplied 8 of the 49. And a Tuesday is the quietest of the five days by median: across the 208 Tuesdays in our sample the median range was 83% of the market's own average day, against 97% for Wednesday and Thursday. So a Tuesday that reaches the average is a bigger day than a Tuesday usually is, which is why it gets noticed and why it is not rare either.
Is the average daily range a signal?
No. It is a confirmation of one fact: the range is used. Confirmation Stacking is our word for counting several such facts on one day, and each one is kept apart from the others so a count does not flatter itself. We make no claim that a Tuesday that met its average turned more often, or less often, than one that did not. We have no count that says either.
The Three Seats read it differently. Retail reads a spent range as a reason to expect a stop, because the market has "done its day". The market maker, on our reading, is indifferent to the average and watches where orders sit. The observer notes the fact and keeps asking which part of the week it is in.
What do traders get wrong about the average daily range?
Three readings cost the most.
- Reading met as finished. AUD/USD fell another 35 pips after its average was used.
- Reading it as a turn on the day. USD/CAD made its high the next day, 31 pips over Tuesday's.
- Treating it as a rare event. More than one Tuesday in four reached it, and 8 of the 49 came on one release. It is a common measure, not a signal. A reversal seen afterwards is not a setup, and our own test of the daily setup as a mechanical rule did not make money.
A Tuesday that is spent early can still be the day the week is set, as how to spot the Tuesday Anchor shows. They are separate questions: one asks how much range is left, the other asks what the day did to Monday's extreme.
Sources
The counts come from scripts/seo-counts.mjs (the adrMet count) on Dukascopy 15-minute candles. The two Tuesdays are read from our chart write-ups, with their times in New York. The calendar for each day is the one our chart markups use.
Course 4 of ForexiaPRO, The Week, in production, teaches this read in lesson 4.2.2.
For study only. This page is not a signal and not trade advice. Charts are Dukascopy candles, marked up after the fact.
Frequently asked questions
What is the average daily range on Tuesday?
It is the average high-to-low range of the 20 trading days before Tuesday, held against Tuesday's own range so far. When Tuesday's range reaches that average, we say the average is met. It tells you the range is spent, and we make no claim that it helps or hurts.
How often does Tuesday reach its average daily range?
In our count of seven majors and gold from May to 1 October 2026, Tuesday reached its 20-day average on 49 of 176 market-days. That is 28%, and 8 of the 49 came on one day, US CPI on 14 July 2026.
Does price reverse after the average daily range is met?
Not as a rule. AUD/USD fell another 35 pips after its average was used on 19 May 2026, and USD/CAD made its high the next day, 31 pips over Tuesday's. We make no claim that a Tuesday that met it turned more or less often.