How to Spot the Tuesday Anchor on a Forex Chart
Dylan Forexia6 min read
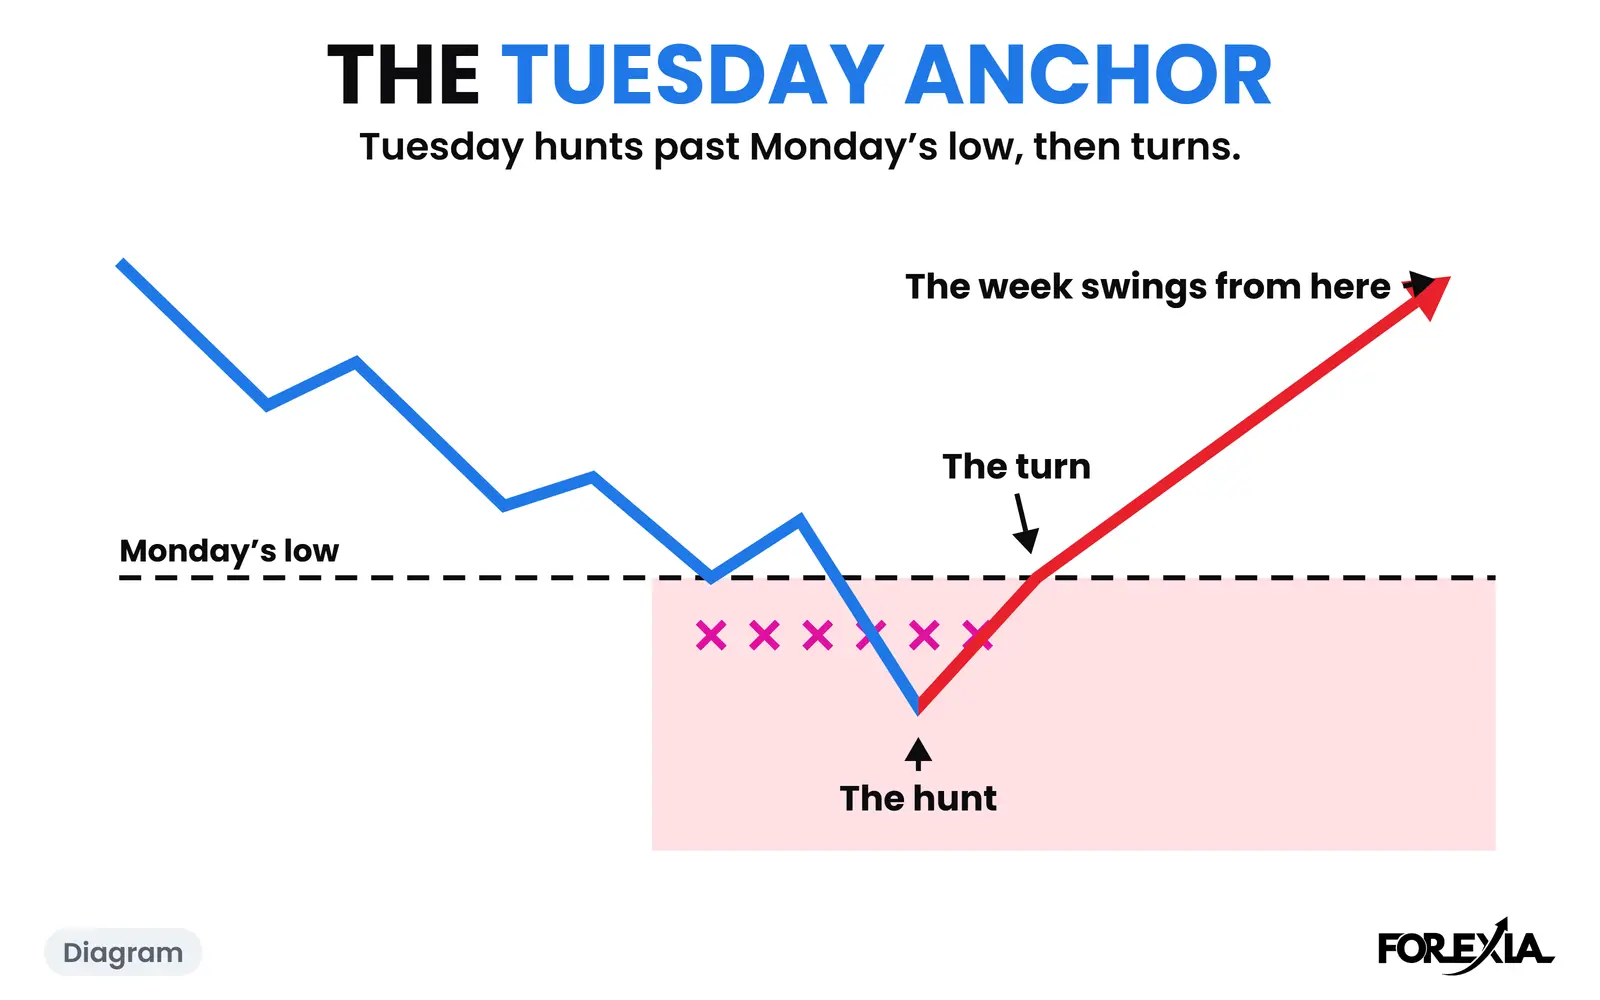
How to spot the Tuesday Anchor on a finished chart: look for three things in order, Tuesday runs past Monday's high or low, price closes back inside Monday's range, and the rest of the week swings away from that turn. It is a word for what a Tuesday did, the Tuesday Anchor, and many Tuesdays never do it.
This page reads one real Tuesday candle by candle, then one where nothing turned. It is about spotting the day on the chart, and Tuesday reversal forex sets three Tuesdays side by side. Both sit in the wider weekly cycle.
What does the Tuesday Anchor look like on a chart?
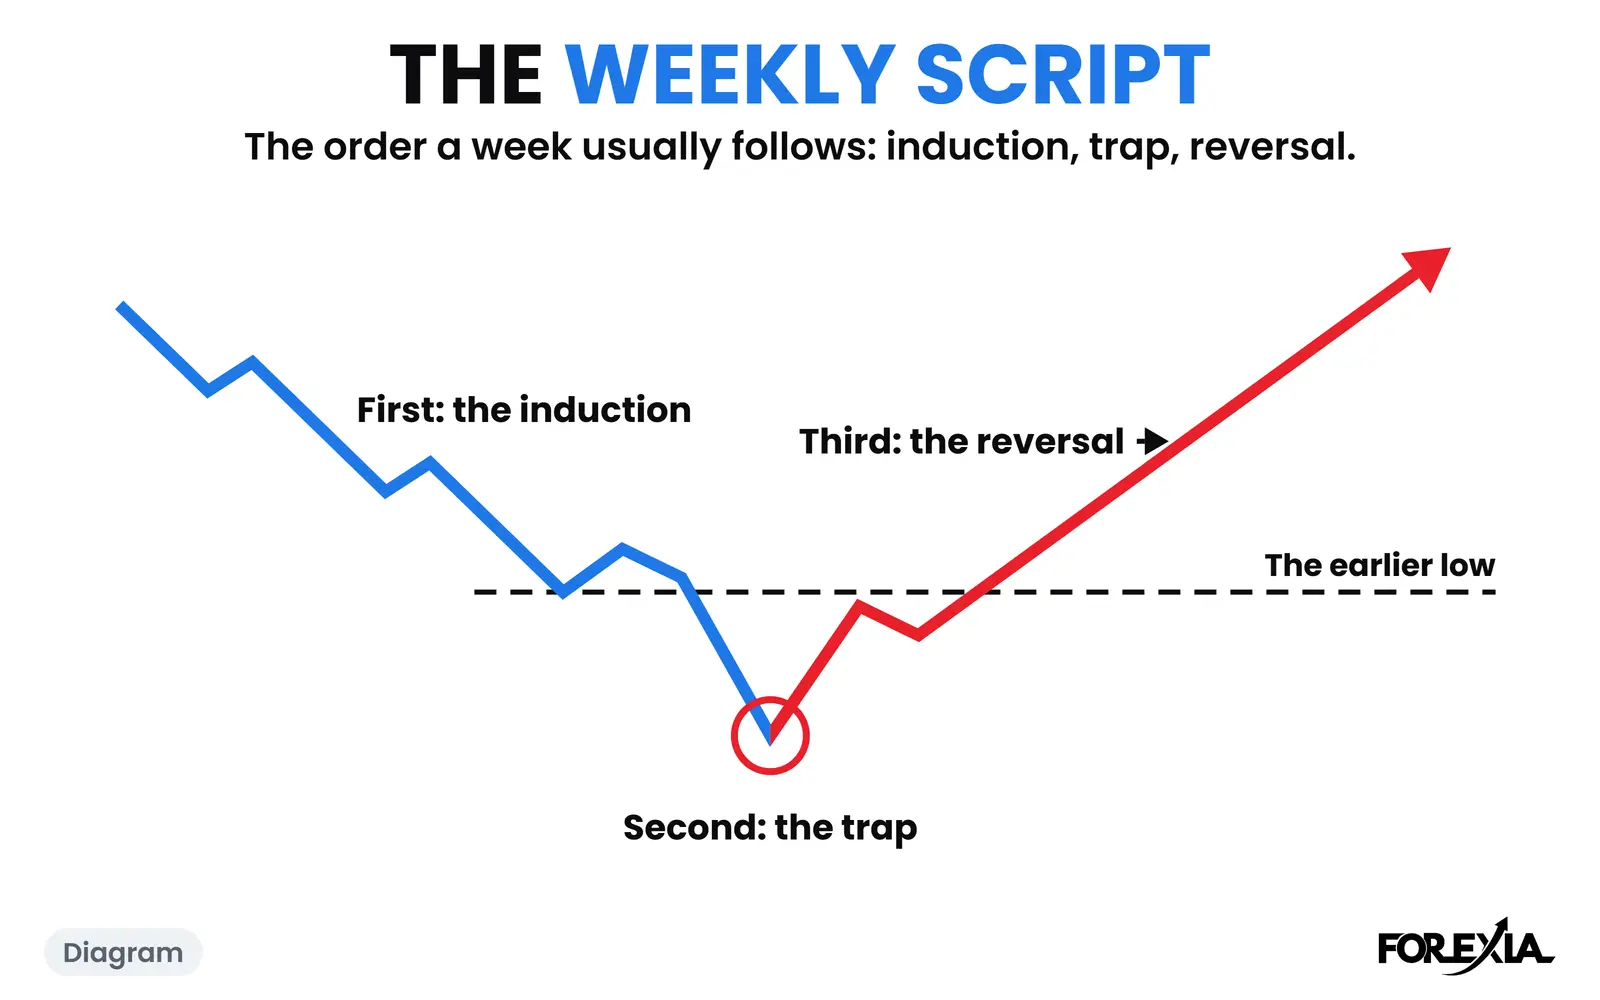
It looks like the day the week's trend ends. On GBP/USD the week of 27 July 2026 opened at 1.33198 and fell to Monday's low of 1.32842, 36 pips under the open. That is the Induction Trend: a drift the crowd follows.
On Tuesday 28 July the pound went under Monday's low in London. The low came at 06:15 New York, at 1.32733, 11 pips through the level. We read that as a stop hunt: the sell stops of everyone who had joined the fall filled the buyers' orders. By the 08:15 candle price had closed at 1.32854, back above Monday's low. It rose 38 pips to 1.33110 by 11:45.
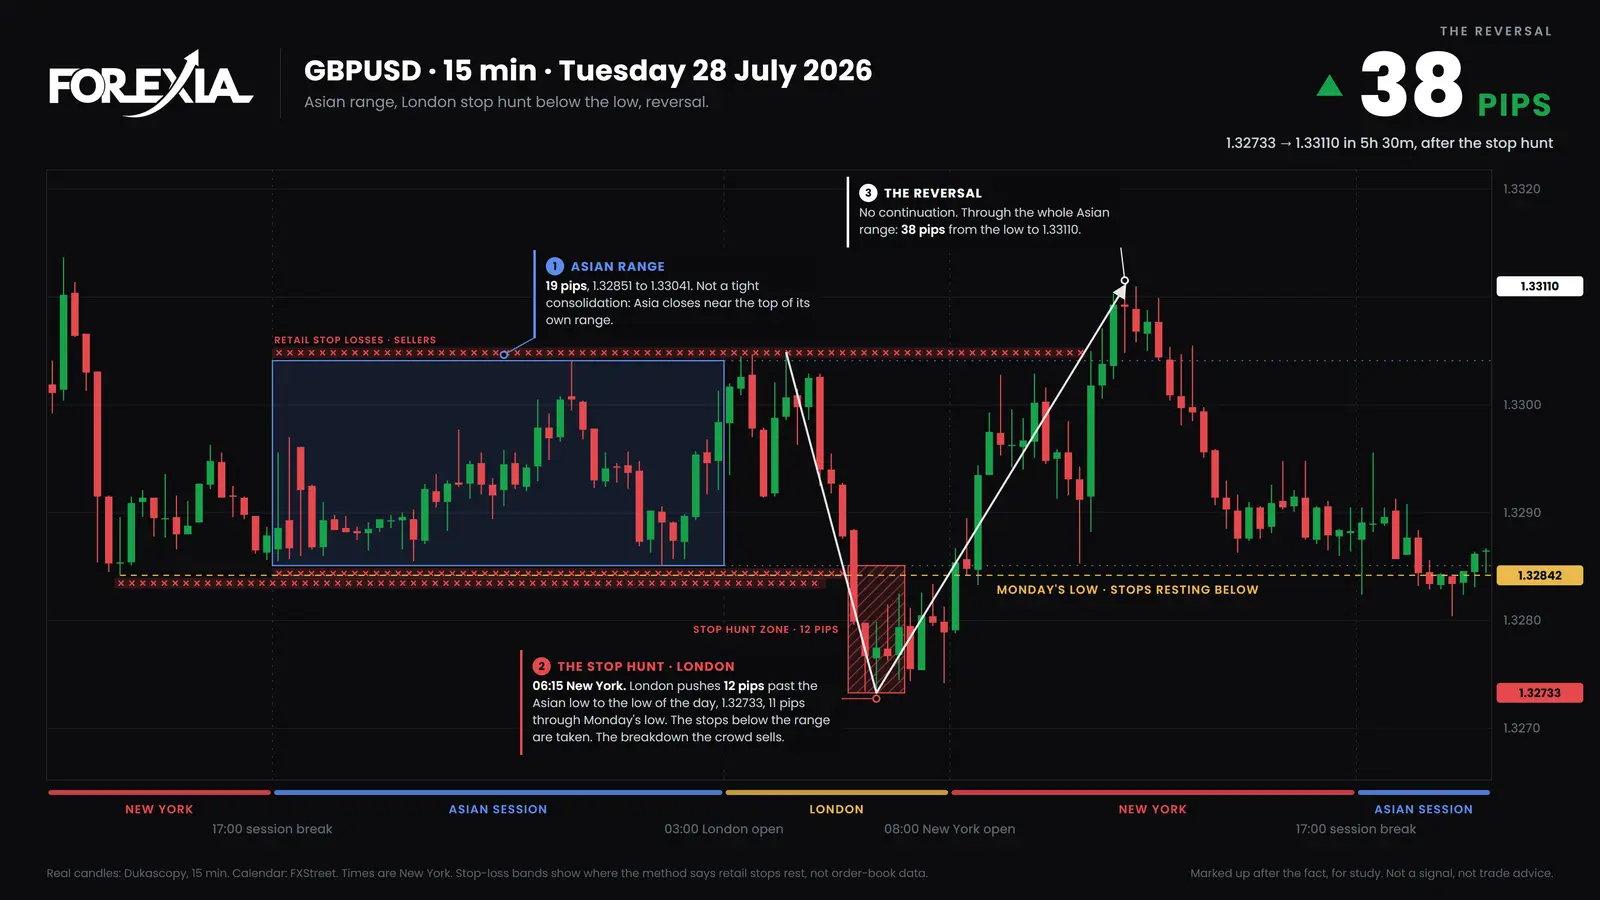
That 1.32733 stayed the low of the week. The week's high, 1.34947, came on Friday at 16:45, 221 pips above it. The week swung from Tuesday, which is why we call it the anchor. We only know it was the week's low because the week is over.
Which signs do you check, in order?
You check the same four things on any finished Tuesday. None of them is a trade rule, and all of them can be read from a chart and a calendar.
- Monday's extreme exists and is clear. Here it was Monday's low at 1.32842, made on a day that drifted down. A Monday with no clear extreme gives Tuesday nothing to hunt.
- Tuesday goes past it. The pound went 11 pips through, in the London session. It is a small distance, which is typical of a hunt and not a breakdown.
- Price closes back. The 08:15 candle closed at 1.32854, over the level. Until that candle the same picture was a plain break lower.
- What the rest of the week does. Within 38 pips the day reversed, and the week never went back under 1.32733.
Check the calendar before reading anything into the timing. Nothing in it lined up with the 06:15 low. The medium-impact US releases that morning were ADP's four-week average at 08:15, house prices at 09:00 and Consumer Confidence at 10:00, so the close back at 08:15 shared its candle with the first of them.
What does a Tuesday that is not the anchor look like?
It looks the same until the close. On gold the week of 7 September 2026, Monday was Labor Day in America, a short day, with a low of 4380.94. Tuesday 8 September traded around that low for hours, and the 14:45 candle was the first to close under it, at 4375.44. Every candle after it closed under too. The day ended at 4355.51, $25 under Monday's low, with the low at 4345.02 at 16:45. No US release was on the calendar that day.
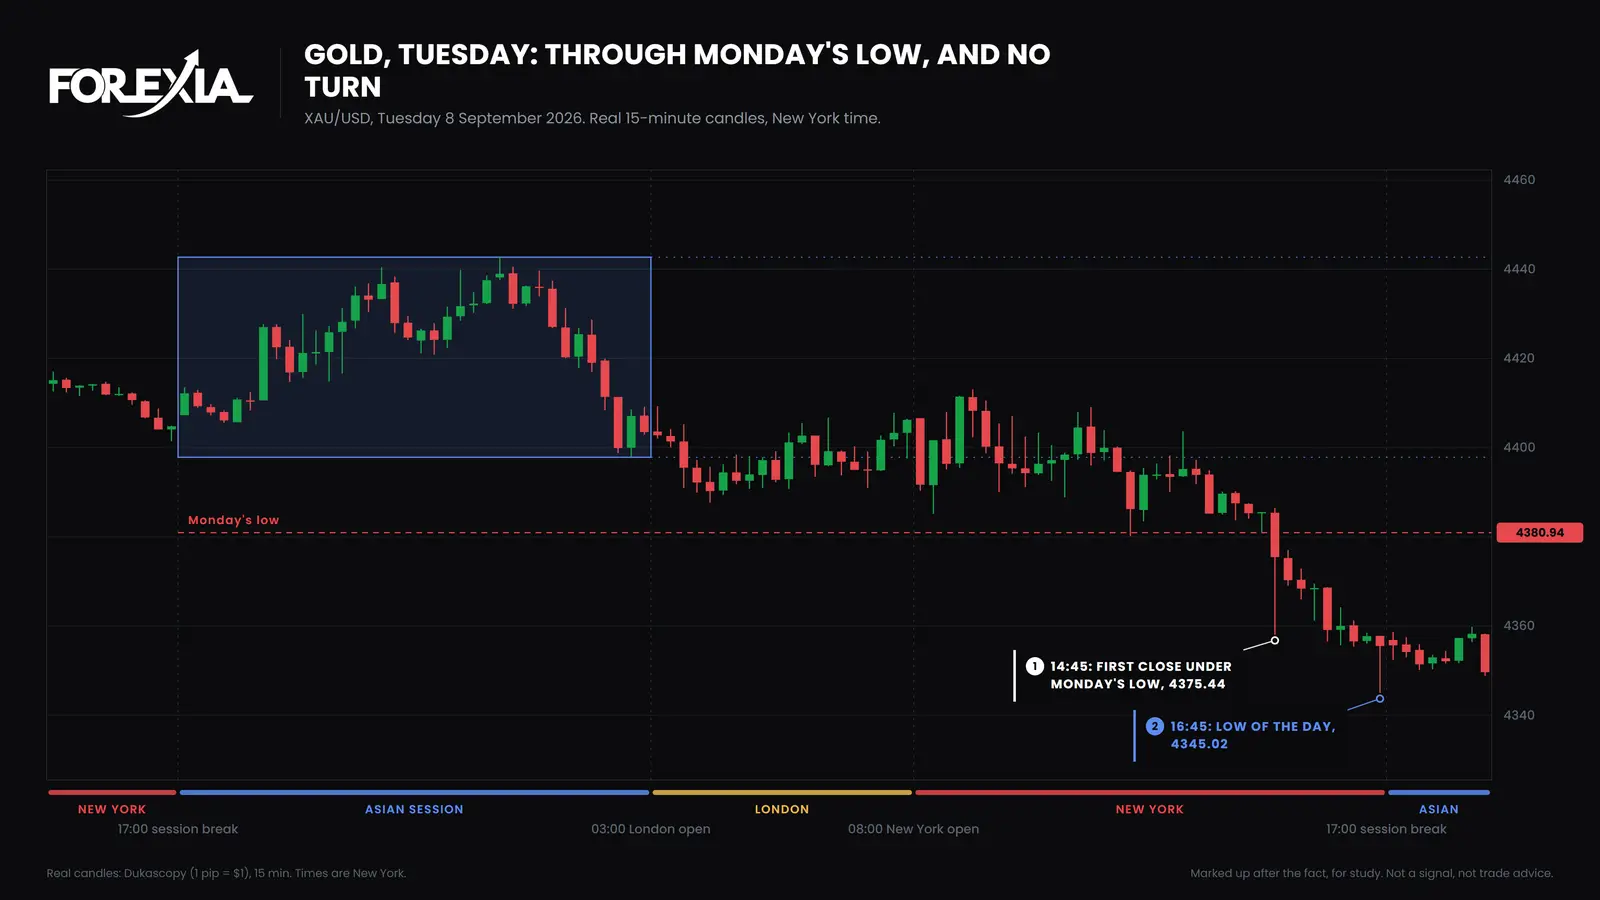
Gold bounced on Wednesday, about $93 from 4340.97 to 4433.78 by 09:30, and did not hold. The low of the week, 4291.95, came on Friday 11 September at 08:30, on US CPI. So the Tuesday went through the level and kept going, and a reader who had called it an anchor on the first dip would have been wrong. The only difference between the pound's Tuesday and gold's was the close back, and that came after the hunt, not before.
What if the turn comes a day late?
Then the Tuesday slipped, and the anchor moves to Wednesday. On USD/CAD the week of 3 August 2026, Monday's high was 1.40532. Tuesday 4 August ran through it, to a high of 1.40799 at 12:30, 27 pips over. From 07:45 every 15-minute candle closed over Monday's high, and the day's last candle ended at 1.40618. There was no close back on Tuesday, so there was nothing to spot yet.
On Wednesday the high came at 02:15, at 1.40798, one tenth of a pip under Tuesday's. Price then fell 75 pips to the low at 14:15. Wednesday carried a high-impact ADP report at 08:15 and ISM Services at 10:00, so that fall is not only the week's structure. In our words the turn moved to Wednesday, which is what the mid-week reversal names. The sign that mattered was the same one as on the pound's Tuesday: a run past an earlier high, then a candle that did not follow it.
How do the three seats read Monday's high and low?
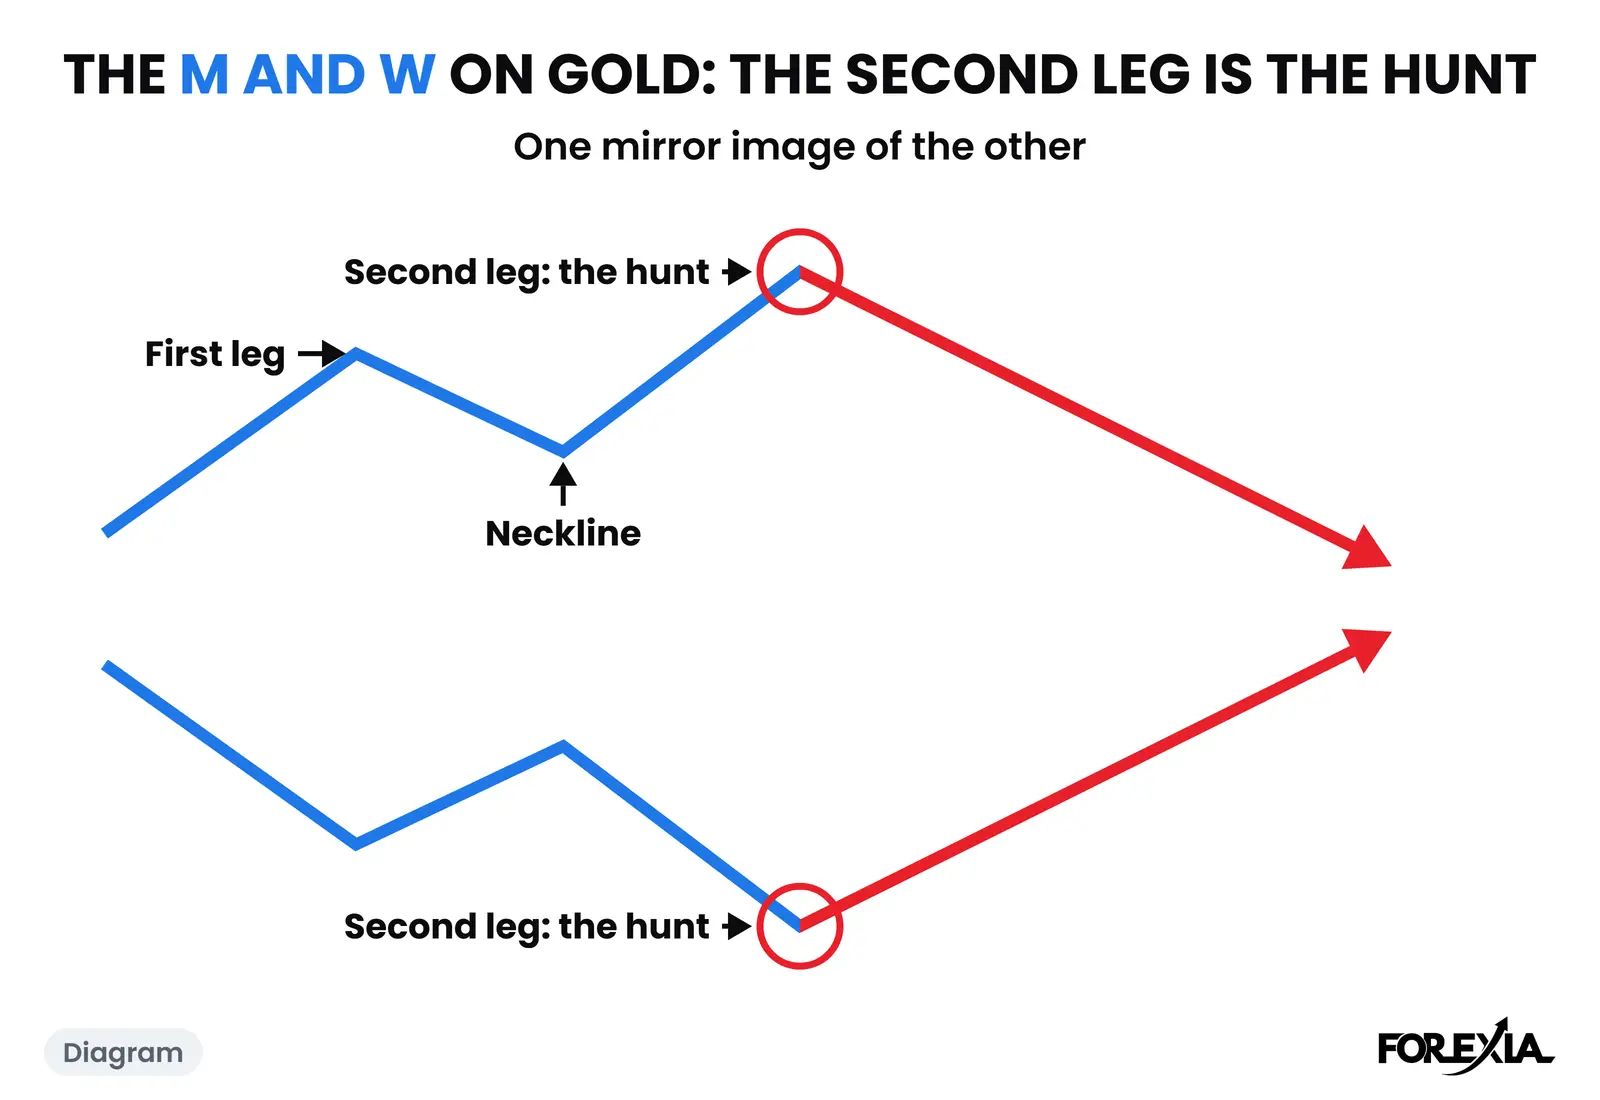
The Three Seats read the same level three ways. Retail sees a break past Monday's extreme as more of the trend, one more day to join. The market maker, on our reading, sees Monday's extreme as where the stops rest, and the break as the way to fill the other side. The observer sees neither until the hunt is over, and asks whether price has closed back.
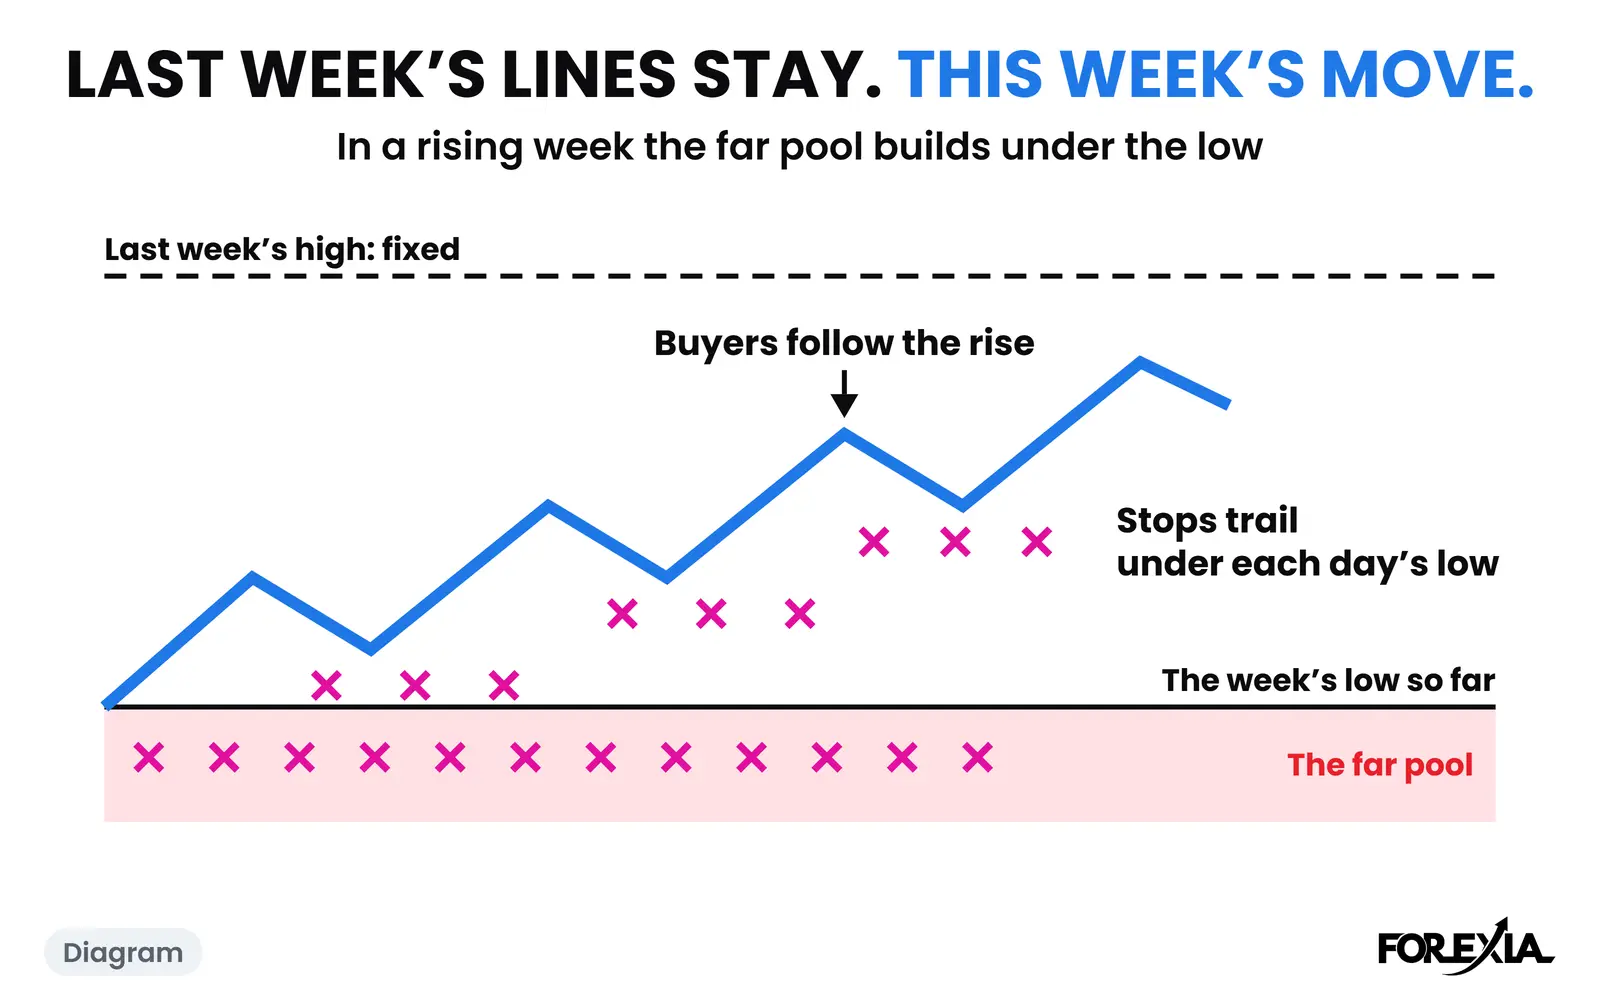
That is also why the previous day's high and low matter on Tuesday: Monday's extreme is the first level of the week that everyone can see. Stops from anyone who traded Monday's move rest just past it, on our reading, and no public book shows them.
Where does the anchor sit in the week?
It sits between the trend and the run. The Induction Trend comes first, from Sunday to Tuesday, and the WTF Reversal is the longer run through the crowd's stops that can follow, on Wednesday, Thursday and Friday. On the GBP/USD week the anchor was the Tuesday low, 1.32733, and the run took the pound 221 pips up by Friday's high. Not every week gives it a Tuesday. Some give it a Wednesday, and some never give it at all.
What do traders get wrong about spotting the Tuesday Anchor?
Three readings cost the most.
- Calling a Tuesday an anchor because the week turned. The pound anchored. A USD/CAD Tuesday on 4 August 2026 stayed over Monday's high and the turn came a day later.
- Counting two pairs on one morning as two Tuesdays. On 28 July the euro made the same dollar move as the pound. It is one day.
- Treating the picture as a setup. A Tuesday you can see turned is a Tuesday after it turned. Our own test of the setup as a mechanical rule did not make money, which is why gold's Tuesday is on this page as well as the pound's.
How much of the normal day Tuesday has used is a separate question, covered under average daily range on Tuesday.
Sources
The days are read from our chart write-ups, GBP/USD on 28 July 2026 and gold on 8 September 2026, on Dukascopy 15-minute candles in New York time. The calendar is the one the chart markups use, checked for each day. The course's case files use another feed and differ by about a pip, so every figure here is read from our own charts.
Course 4 of ForexiaPRO, The Week, in production, teaches the Tuesday Anchor in lesson 4.2.3.
For study only. This page is not a signal and not trade advice. Charts are Dukascopy candles, marked up after the fact.
Frequently asked questions
What does the Tuesday Anchor look like on a chart?
Tuesday runs past Monday's high or low in London or New York, the price closes back inside Monday's range, and the rest of the week swings away from that turn. On GBP/USD on 28 July 2026 the low came at 06:15 New York, 11 pips under Monday's low, and held as the week's low.
Can you tell on Tuesday morning that it is the Tuesday Anchor?
Not with certainty. A hunt of Monday's low looks the same as the start of a breakdown until price closes back. On gold on 8 September 2026 Tuesday went under Monday's low, never closed back, and the week fell further.
Where does Monday's high and low matter in the week?
They are the first levels the week has that everyone can see. We read the stops of anyone who traded Monday's move as resting just past them, which is why Tuesday often goes there first.