Published Trading Strategies Backtest: 20 Tests With Costs, None Passed
Dylan Forexia7 min read
We ran a published trading strategies backtest with real retail costs, and none of the twenty tests passed: one was a candidate worth following, nineteen failed, and the mark had been written down before the first run. Many of the patterns in the papers are there before costs. A trade every day pays the spread every day, and that is larger than the effect.
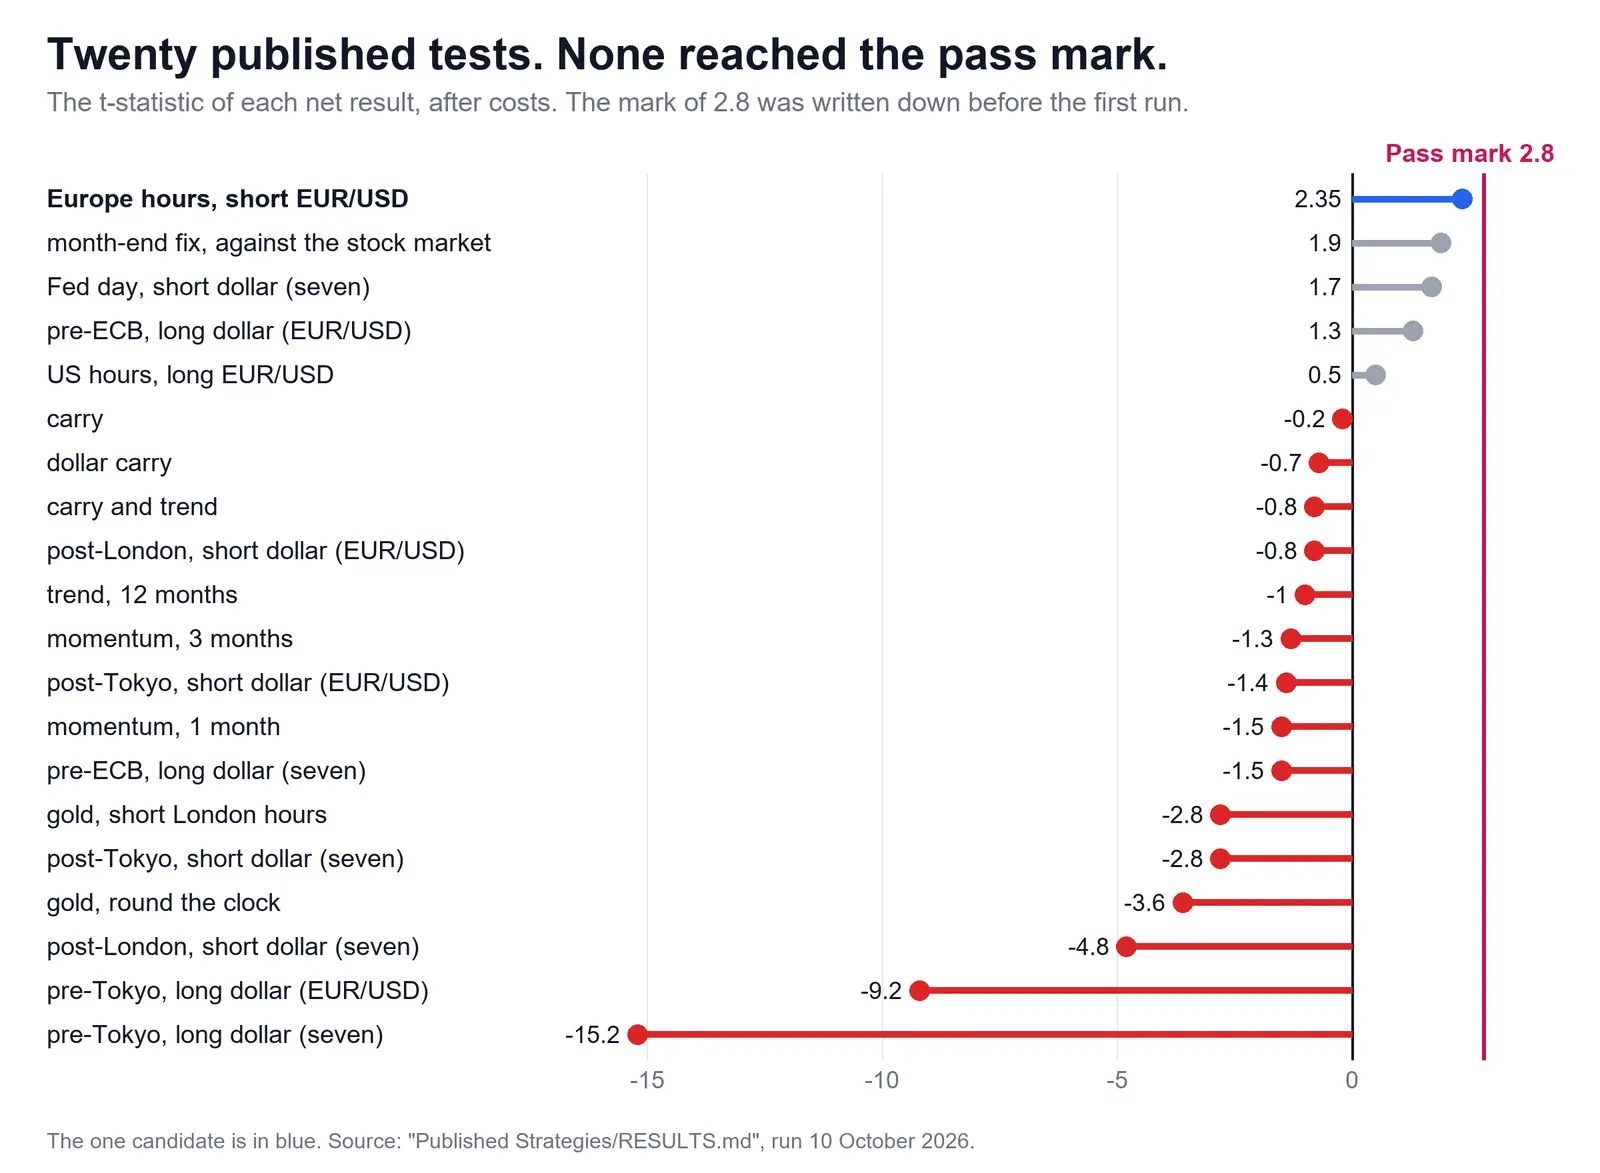
This was run on 10 October 2026, and no window, pair or cost was changed after seeing a result. The chart shows all twenty against the mark, and the rules and results are in the tables below.
What was the pass mark for this published trading strategies backtest?
It was written on 10 October 2026, before any of them ran. Eighteen tests were planned, so one reaching a t-statistic of 2 by luck was likely. A test passed only if, after costs, all three of these held:
- A t-statistic of the net return of 2.8 or more, which is 5% one-sided shared between the tests.
- Net return above zero in each half of the sample taken alone.
- Net return above zero in at least 60% of calendar years.
A net t of 2.0 to 2.8 that met the other two was a candidate: worth following on data it has not seen, not worth money. Everything else failed, and nothing was re-tuned after a fail. Two gold tests were added afterwards and before they ran, with the mark unchanged.
What was tested, on what data, and at what cost?
Twenty tests of sixteen rules, because four fixing windows are each judged twice: on the dollar against seven currencies in equal parts, and on EUR/USD alone. These rules come from published work, not from our courses, so they are stated in full.
| Intraday tests | Monthly tests | |
|---|---|---|
| Data | Dukascopy 5-minute bid and ask candles | Yahoo daily closes, BIS central bank policy rates |
| Period | 2015 to October 2026 | July 2006 to October 2026 |
| Markets | Seven majors and gold | Eight currencies |
| Costs | Buy at the ask, sell at the bid, plus 0.7 basis points a round trip ($7 a lot) | 2 basis points of turnover each way, plus 1% a year on gross exposure for a retail broker's financing markup |
| Halves | 2015-20 and 2021-26 | Split at July 2016 |
The sources the study names, read at source:
- Fixing windows: Krohn, Mueller and Whelan, Foreign Exchange Fixings and Returns Around the Clock.
- Europe and US hours: Breedon and Ranaldo, Intraday Patterns in FX Returns and Order Flow.
- Fed day: Mueller, Tahbaz-Salehi and Vedolin, Exchange Rates and Monetary Policy Uncertainty.
- Month-end fix: Melvin and Prins, Equity Hedging and Exchange Rates at the London 4 p.m. Fix.
The gold tests are the rule published by Speck and others, as the study names it. We could not find that work at its source, so it has no citation here. Carry, trend and momentum come from the wide literature on them, and the study names no paper for those six tests.
Did any of the published strategies make money after costs?
A few stayed above zero, and none by enough. Results are net percent a year, because these tests have no stop, so R does not apply. Tests above zero are given in words.
| Test | Rule | Net a year | t | Verdict |
|---|---|---|---|---|
| Pre-Tokyo (seven) | Long the dollar 18:00 New York to 09:55 Tokyo | -7.3% | -15.2 | Fail |
| Pre-Tokyo (EUR/USD) | Same | -4.6% | -9.2 | Fail |
| Post-Tokyo (seven) | Short the dollar 09:55 Tokyo to 08:00 Frankfurt | -2.0% | -2.8 | Fail |
| Post-Tokyo (EUR/USD) | Same | -1.0% | -1.4 | Fail |
| Pre-ECB (seven) | Long the dollar 08:00 to 14:15 Frankfurt | -1.5% | -1.5 | Fail |
| Pre-ECB (EUR/USD) | Same | Above zero | 1.3 | Fail |
| Post-London (seven) | Short the dollar 16:00 London to 16:55 New York | -4.5% | -4.8 | Fail |
| Post-London (EUR/USD) | Same | -0.9% | -0.8 | Fail |
| Europe hours | Short EUR/USD 07:00 London to 08:00 New York | Above zero | 2.35 | Candidate |
| US hours | Long EUR/USD 08:00 to 16:00 New York | Above zero | 0.5 | Fail |
| Fed day | Short the dollar, 16:55 New York the day before a decision to 16:55 that day | Above zero | 1.7 | Fail |
| Month-end fix | Last business day, 15:00 to 16:00 London: buy the currencies whose stock market lagged that month, sell those that led | Above zero | 1.9 | Fail |
| Gold, London hours | Short gold from the 10:30 auction to the 15:00 auction | -7.1% | -2.8 | Fail |
| Gold, round the clock | Long 18:00 New York to 10:30 London, then the test above | -13.2% | -3.6 | Fail |
| Carry | Long the three highest rates, short the three lowest | -0.3% | -0.2 | Fail |
| Dollar carry | All seven against the dollar, by whether their average rate beats the US rate | -1.2% | -0.7 | Fail |
| Trend | Each pair by the sign of its last 12 months | -1.4% | -1.0 | Fail |
| Momentum, 1 month | Long the three best of last month, short the three worst | -2.5% | -1.5 | Fail |
| Momentum, 3 months | The same on three months | -2.1% | -1.3 | Fail |
| Carry and trend | Half of each | -0.9% | -0.8 | Fail |
The pre-Tokyo test moves its start from 17:00 in the paper to 18:00, because the rollover hour cannot be traded at retail.
Why did these academic trading strategies fail?
Mostly because the pattern is smaller than the cost of collecting it.
The patterns are real before costs. Gold made its whole rise outside London hours, as the rule says, and was about flat between the auctions, where the rule expects a fall. EUR/USD fell in Europe's hours and rose in America's. Trading either one every day pays the spread every day, and the spread is larger. That is the plainest lesson here, and it is the same one our test of the stop hunt as a mechanical rule taught us.
Carry, trend and momentum made nothing on the majors since 2006. Carry lost 28% in 2008, and has earned about what financing costs since.
Fed day and month-end are too small and too few. Their t-statistics of 1.7 and 1.9 cannot be told from luck, on 94 and 140 trading days. The month-end effect was also below zero in the second half. Trading an FOMC day carries its own risks, and a tiny average does not make them smaller.
The one candidate is fading. Short EUR/USD in Europe's hours was up in ten years of twelve, and the two down years are the last two: -3.2% in 2025 and -1.5% in 2026 to October. Its t-statistic of 2.35 is below the 2.8 that this many tests call for. We did not move its hours to find a better year.
What does this test not prove?
It does not prove that the papers are wrong or that these effects are gone from every market.
- It tests retail collection, not the pattern. A desk paying far less than a retail spread faces a different sum, and we did not test that.
- The mark is strict on purpose. A 2.35 would clear the usual bar of 2 if it were the only test ever run. It was not.
- It is a set of chosen rules. Twenty tests are not all of published research. Most of that literature is on stocks, which we did not test.
- The markets are narrow. Seven majors and gold intraday, eight currencies monthly. Emerging market carry is not here.
- It uses one source for each kind of data. Another broker's spreads and swaps will differ, and the financing markup is an assumption.
- It does not test any later refinement of these rules. Nothing was re-tuned, which keeps the test clean and also means no improved version got a chance.
A rule that fails after costs has told you something a rule with no costs stated never can. Why strategies fail backtests draws out the common causes, and the archive of our tests lists the others, including our own setup and Gann, on the research page.
What changed when this page came back?
This page was taken down on 31 October 2026 and put back on 11 November 2026. Its figures were rerun on 11 November 2026 with scripts/seo-research-figures.mjs, which reads the study's RESULTS.md. All twenty rows matched: none passed, one candidate, nineteen failed. No finding was reworded to read better than the numbers.
Course 3 of ForexiaPRO, Reverse Price Action, teaches our read of the chart step by step, and our own test of that read as a rule lost too.
Frequently asked questions
Do published trading strategies work?
On our test, not at retail costs. Twenty tests of rules from published research ran on forex and gold with real spreads and financing. None passed a mark written before the first run, one was a candidate, and nineteen failed. Many of the patterns are real before costs. A trade every day pays the spread every day, and that is larger than the effect.
Does that mean the papers are wrong?
No. The papers measure a pattern in returns, and the pattern was usually there before costs in our data too. We tested something different: whether a retail trader could collect it. That the two answers differ is the finding.
Why a t-statistic of 2.8 and not 2?
Because many tests were run. With eighteen planned, one reaching 2 by luck is likely, so the usual 5% was shared between them, and that gives about 2.8. A strategy also had to make money in each half of its sample and in at least 60% of calendar years.
What was the one candidate?
Short EUR/USD from 07:00 London to 08:00 New York. Its t-statistic of 2.35 sits below the 2.8 mark, and it has been fading: the last two years were its two down years, -3.2% in 2025 and -1.5% in 2026 to October. A fair test of it now needs days that have not happened yet.