Good vs Weak Trading Setup: Eight of Eight Against One of Eight, on Real Days
Dylan Forexia6 min read
A good vs weak trading setup is usually a question of counting: the more reasons, the better the setup. We have three real USD/CAD days with scores from our markup tool, and the count does not do what the guides say. The best-scored day reversed 51 pips. A 7 of 8 day reversed 31. A 1 of 8 day fell 62. This page puts them side by side and says what that does and does not show.
How a stack is counted is in confluence trading in forex, and the numbers over 332 marked days are in how many confirmations a setup needs. All three days below were marked up after they turned, so they describe days and prove nothing about a trade.
What did a good setup look like? USD/CAD on 10 June 2026
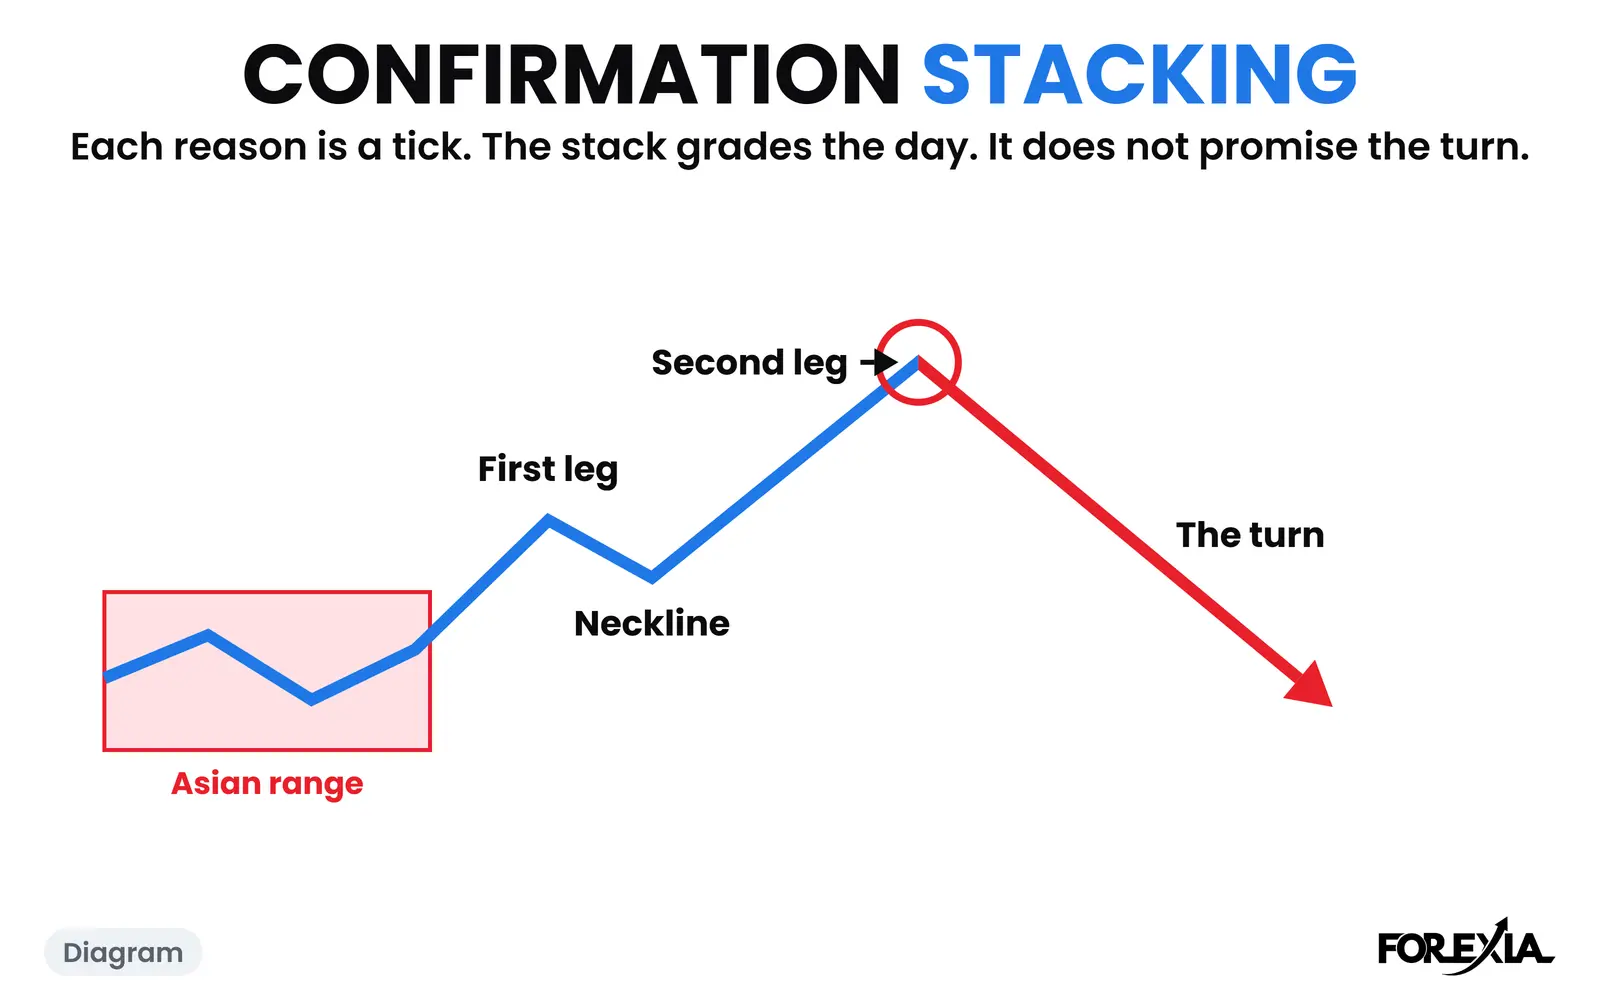
Wednesday 10 June 2026 scored 8 of 8, the top of the tool's list. The Asian range was 21 pips, from 1.39363 to 1.39569. New York then broke the low of that range by 13 pips, to 1.39230 at 08:30, in the candle where the US inflation figures landed. Price pulled back to a neckline at 1.39381. A second leg ran to 1.38984 at 09:45, 25 pips past the first leg and 20 pips through Tuesday's low at 1.39185, in the candle of the Bank of Canada's rate decision. From there price rose 51 pips to 1.39499 by 16:00, back inside the Asian range.
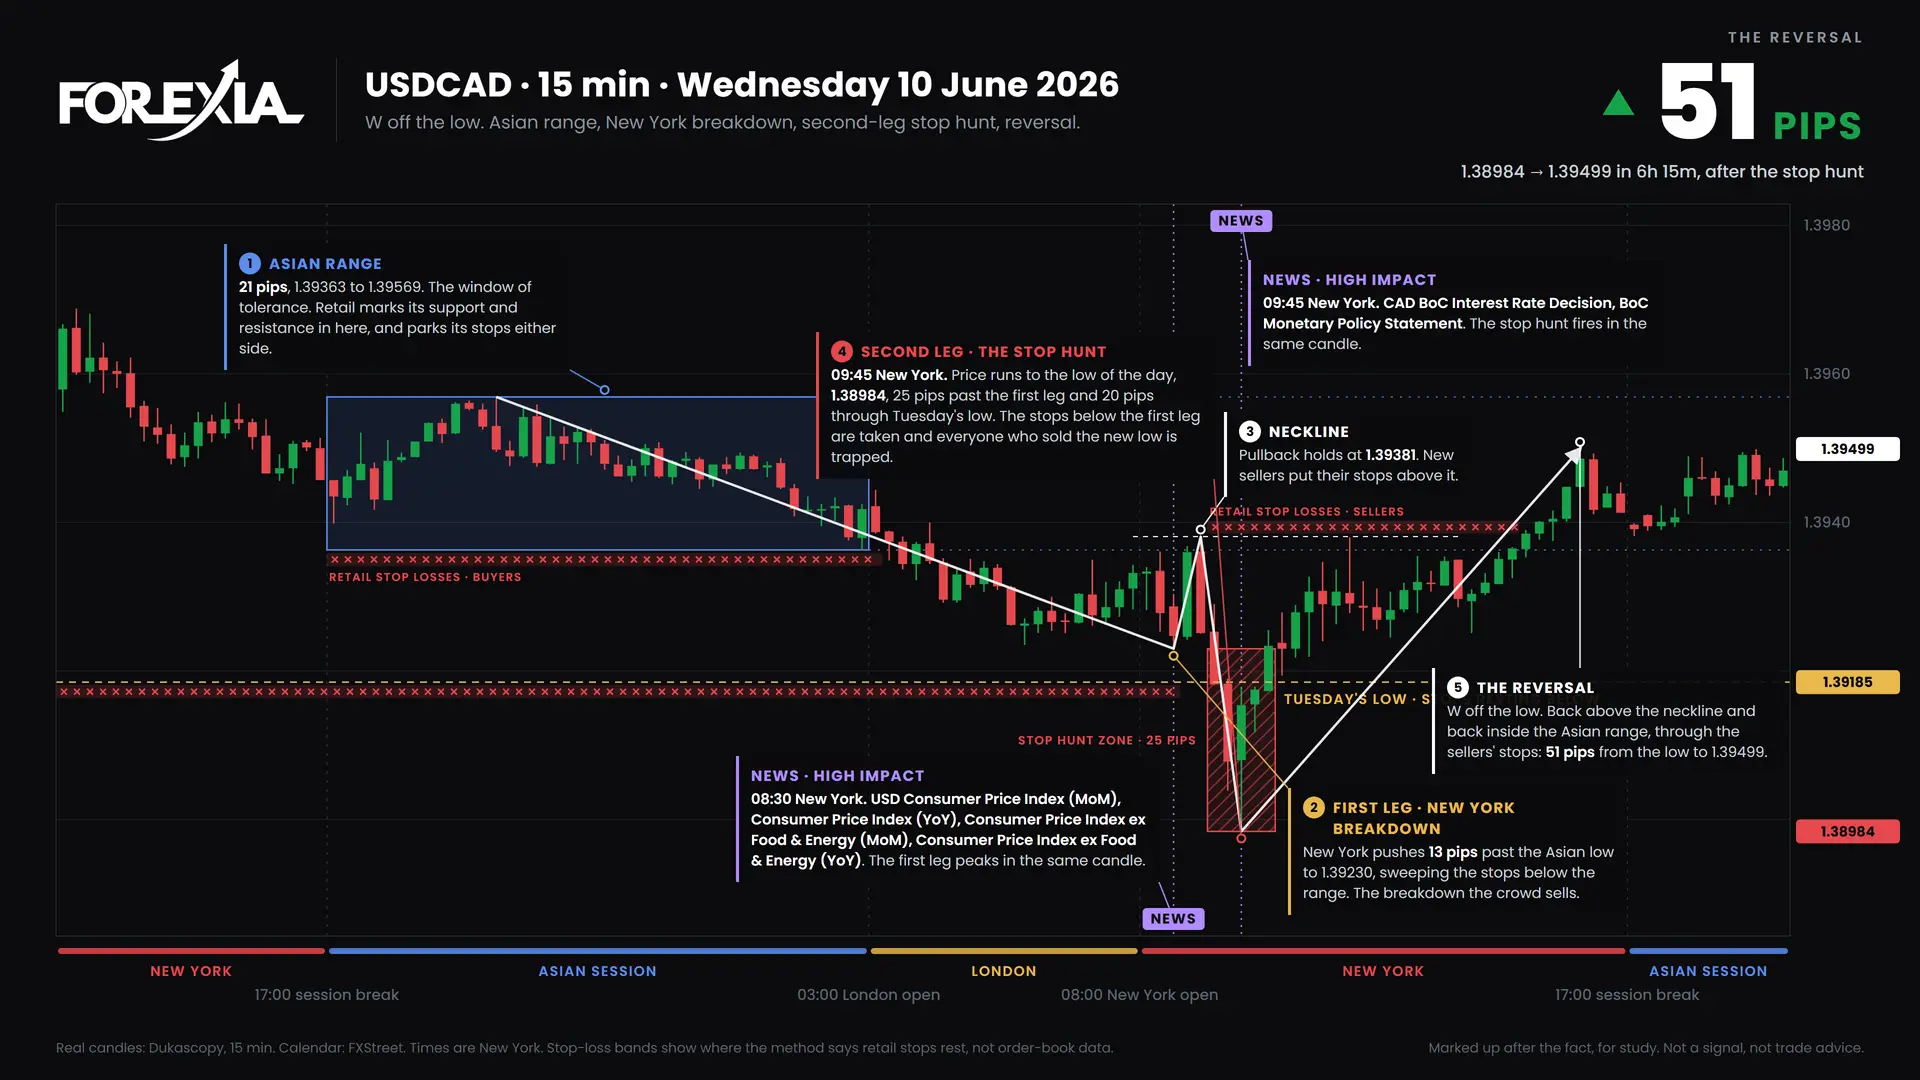
It was graded Textbook. From the low it ran 125 pips on the weekly scale, to 1.40235 on Thursday. One of its eight confirmations, that it is the low of the week, is something nobody knew at 09:45 on Wednesday. Those are the facts of the day. They say a lot was lined up. They do not say it was knowable.
What did a weaker setup look like? USD/CAD on 19 May 2026
Tuesday 19 May 2026 scored 7 of 8, one short. The Asian range was 26 pips, 1.37277 to 1.37534. London broke its high by 18 pips, to 1.37715 at 06:30, taking Monday's high at 1.37631 on the way. Price pulled back to a neckline at 1.37433, then ran a second leg to 1.37737 at 08:30, 2 pips past the first. The Canadian inflation figures landed in that candle. From there price fell 31 pips to 1.37428 in 8 hours 15 minutes.
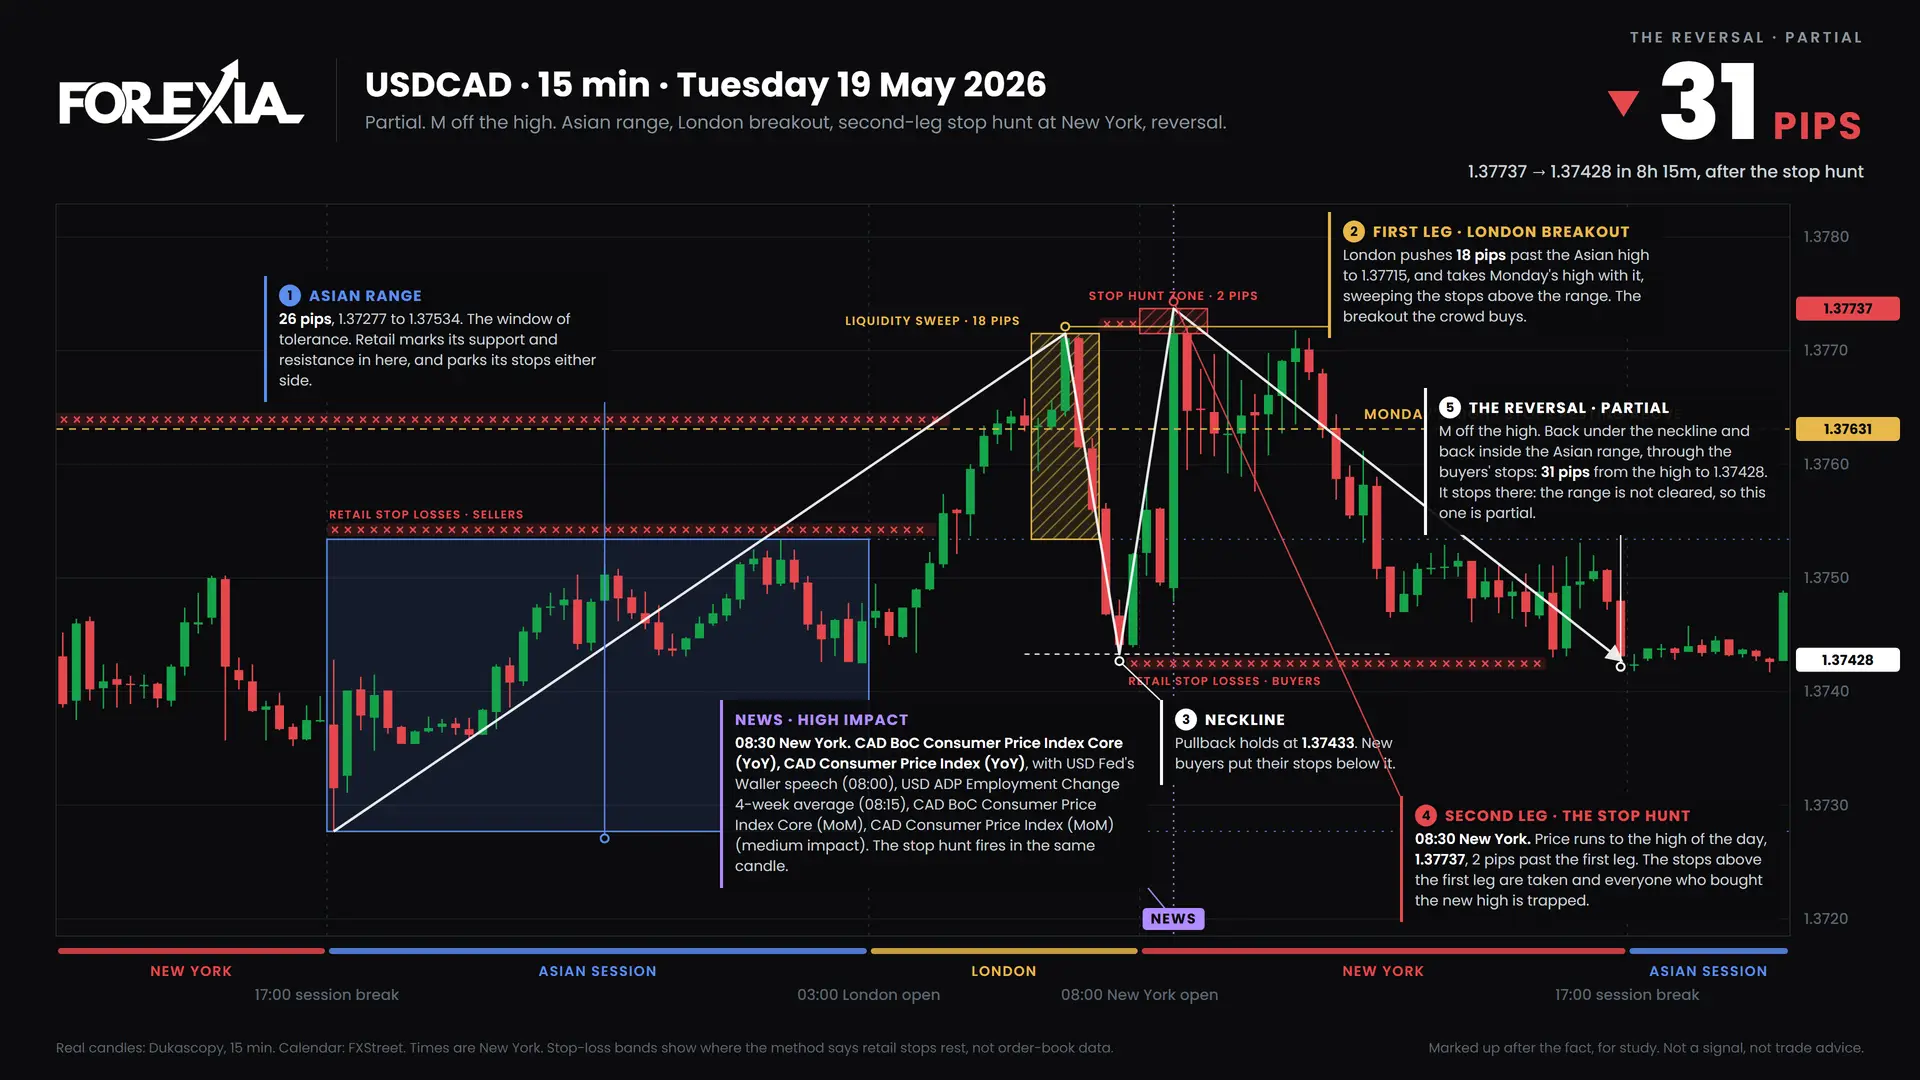
It was graded Partial. The one confirmation it missed was that it was the high of the week: the week's high was 1.38237, on Friday. Wednesday traded back through the 19 May high by 50 pips. So the structure was nearly all there, and the move was small. The missing piece was one nobody could have known on Tuesday.
What did the weakest setup do? USD/CAD on 15 April 2026
Wednesday 15 April 2026 scored 1 of 8. Its Asian range was 24 pips and drifted up, so it was not tight. There was no second leg. At 07:30 New York price pushed 6 pips past the high, to 1.37879, and then fell 62 pips to 1.37263 by 14:15, through the whole range. It was graded Textbook. The chart and its figures are on the Confirmation Stacking page.
Good vs weak trading setup: what do the three days show side by side?
Read the table by its first and last columns, the score and the move. The day with the most reasons did not make the biggest move, and the day with the fewest did.
| Day | Score of eight | Filed | Reversal |
|---|---|---|---|
| 10 June 2026 | 8 | Textbook | 51 pips |
| 19 May 2026 | 7 | Partial | 31 pips |
| 15 April 2026 | 1 | Textbook | 62 pips |
The order of the scores is the opposite of the order of the moves. We chose three days to make a point, so this proves nothing alone. Over 332 days the share filed Textbook was close to the same at every band of score, and the table is the evidence. What these days add is what it looks like on a chart.
A score is also partly hindsight. The week's high or low is one of the eight, and it can only be ticked once the week has ended. The 10 June day above leans on it, and the 19 May day lost its eighth point to it.
What would a fair comparison of strong and weak setups need?
Three things, and a page of three days has none of them. A large sample: 332 marked days are a start, and three are an anecdote. Days that were not picked: ours were marked because they turned, so a strong-looking day that did not turn is missing from every table we have. And a score fixed before the day, with no part of it known only afterwards, so that nobody can tick it in hindsight.
The days that did not turn matter most. Our archive is a folder of reversals and not a sample of ordinary days, and a reader who wants to know whether a score helps needs the days it did not help on. That is also why the mechanical test is in the story: it did not pick its days. It lost on all of them together, with six confirmations losing less than two and both losing.
Who is on each side of a strong setup?
The retail seat reads the 8 of 8 as the best of the three and the 1 of 8 as one to skip, because it adds reasons until it feels sure. The market maker's seat looks at where the stops sit. On all three days the stops sat in the same kinds of places, above or under a range and a previous day's extreme, and price went through them. The observer's seat, ours, files the day afterwards. That is a reading, not something the candles prove.
How should you use three days like these?
As a reminder of how a chart looks at the time against how it reads afterwards. On each of the three days the structure was visible in the candles as it printed: a range, a break, a second push or none, and a close back. What was not visible was the size of the move. If you keep a log, write down the score you gave before the move and the one you would give now, side by side. The gap between them is the part of the score that was hindsight, and it is the most useful number a journal can hold.
What do traders get wrong about a good setup?
Three readings cost the most.
- Grading before the day is over. Part of the score is known only afterwards, so the grade you give at 09:45 is not the one the day earns.
- Reading a high score as a size. A stack that moved 31 pips and a stack of one that moved 62 are different sizes of move, and the score did not say which. Our own test, which risked more on the best-scored setups, lost more, not less.
- Treating a picked day as a rule. Every day on this page was marked after it reversed.
Our own test of the setup as a mechanical rule did not make money, and a reversal seen afterwards is not a setup. Why trading setups fail says what we found.
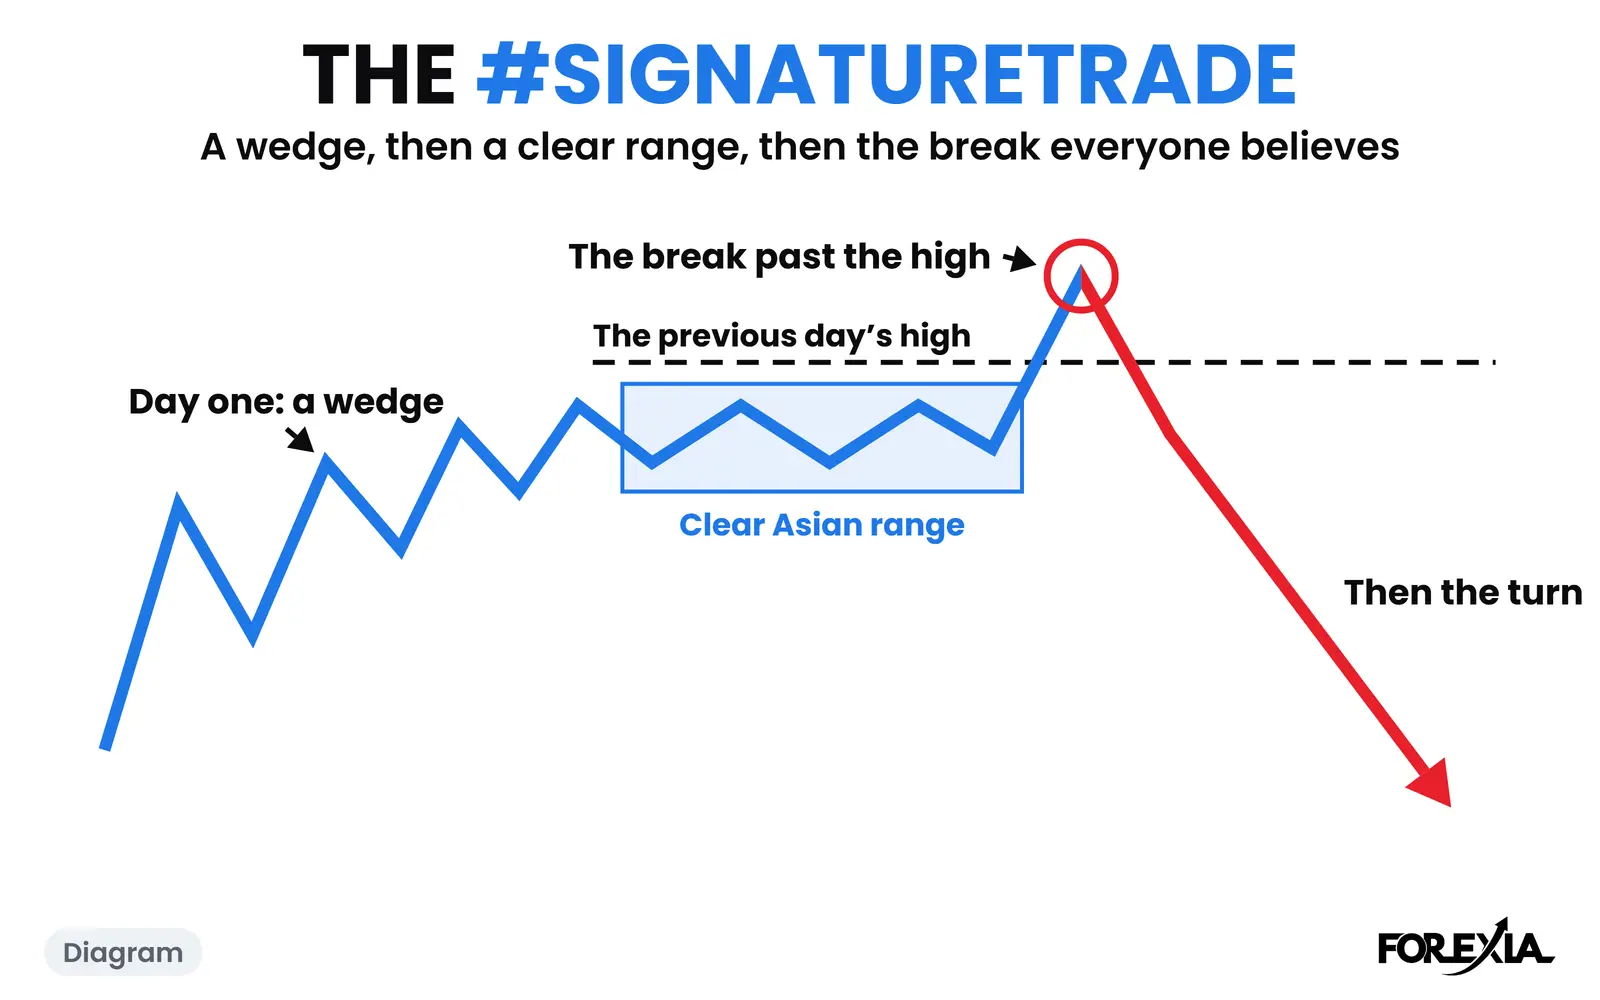
Course 5 of ForexiaPRO, The #SignatureTrade, teaches how to compare a thin setup with a stacked one on real days, in lesson 5.2.3. It is on ForexiaPRO.
Frequently asked questions
What makes a good trading setup versus a weak one?
Guides count reasons: more confirmations is a better setup. On three real USD/CAD days the count did not predict the move. A day with 8 confirmations of 8 reversed 51 pips, a day with 7 of 8 reversed 31, and a day with 1 of 8 fell 62. Each is a day we marked after it turned, so it is a description and not a test.
Why did a 7 of 8 setup only reverse 31 pips?
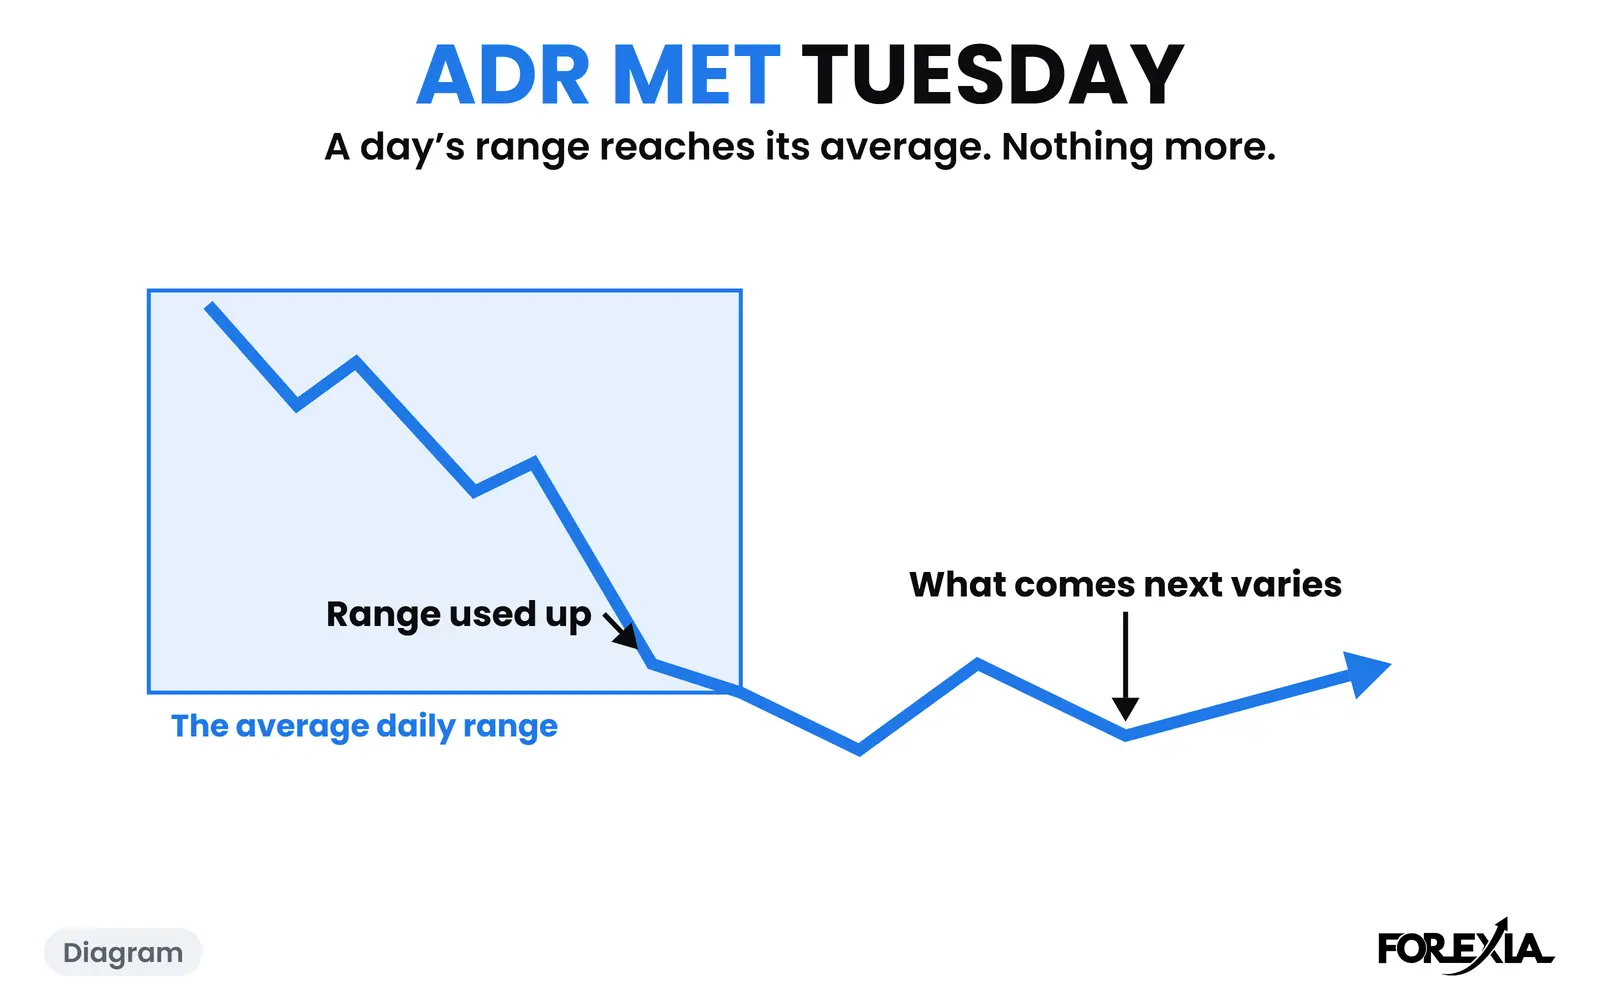
The 19 May 2026 day had every part of the structure except one, the high of the week, and that is only known once the week is over. It was filed Partial because the reversal stopped inside the Asian range and ran less than three quarters of the pair's 53-pip average daily range.
Can a weak setup still move a long way?
Yes. USD/CAD on 15 April 2026 scored 1 of 8 and fell 62 pips through its whole Asian range. A low score is not a veto, and a high score is not a promise.