What Is an Obvious High or Low in Forex? What Counts, and Where the Crowd Waits
Dylan Forexia8 min read
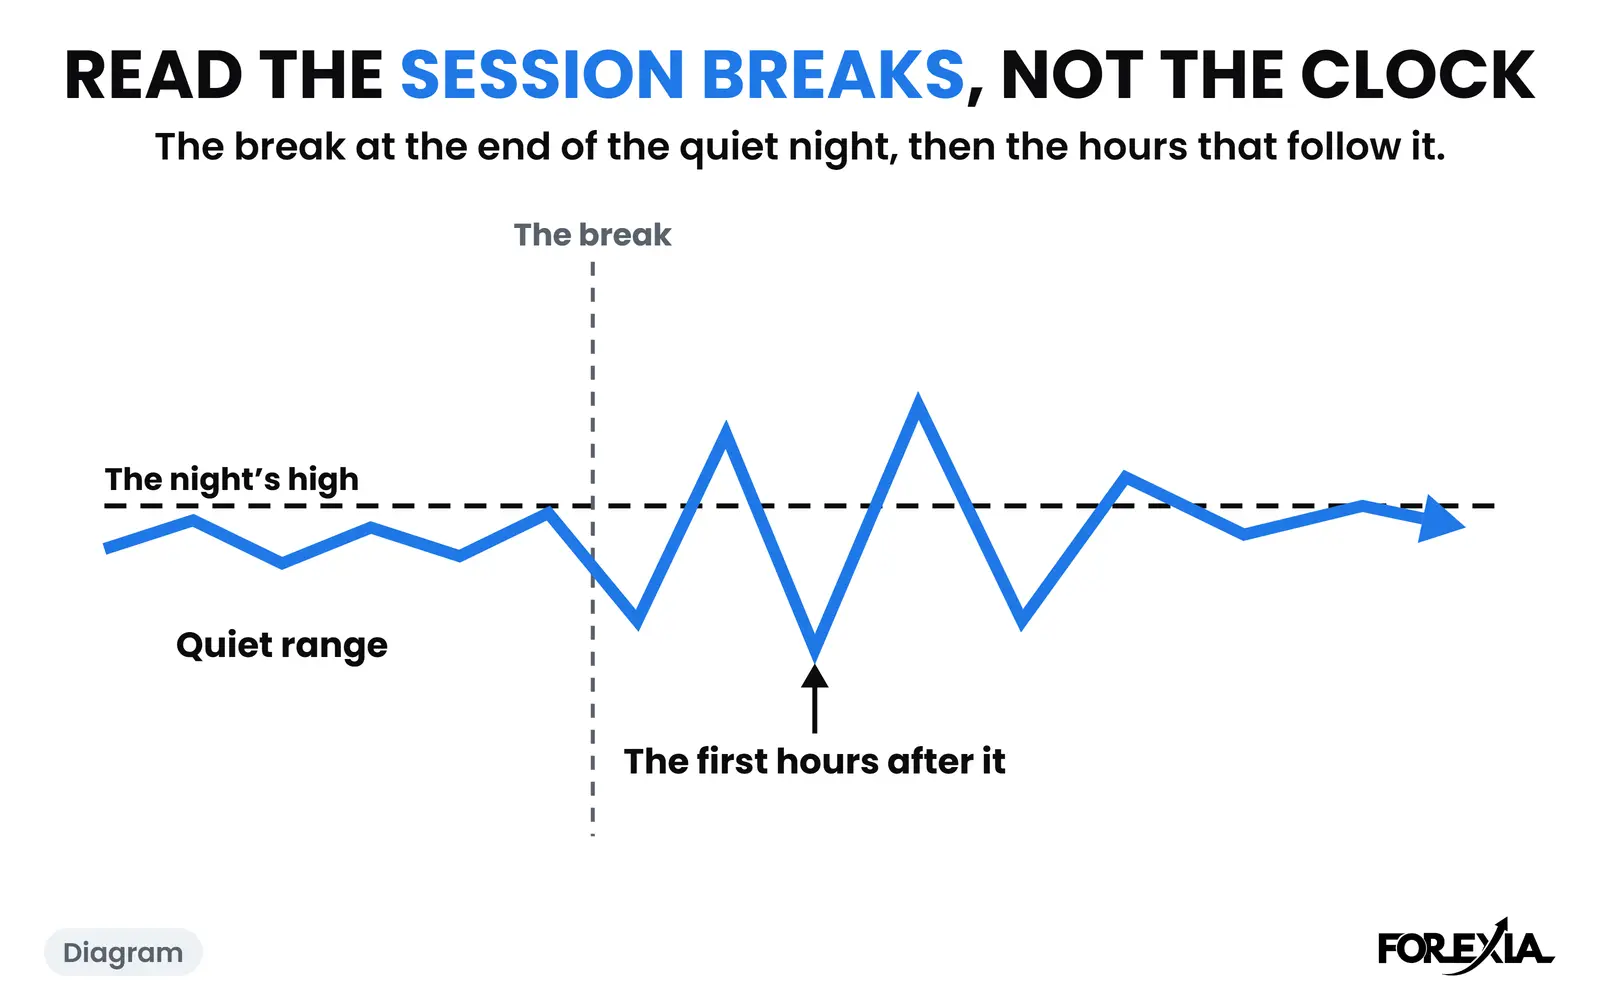
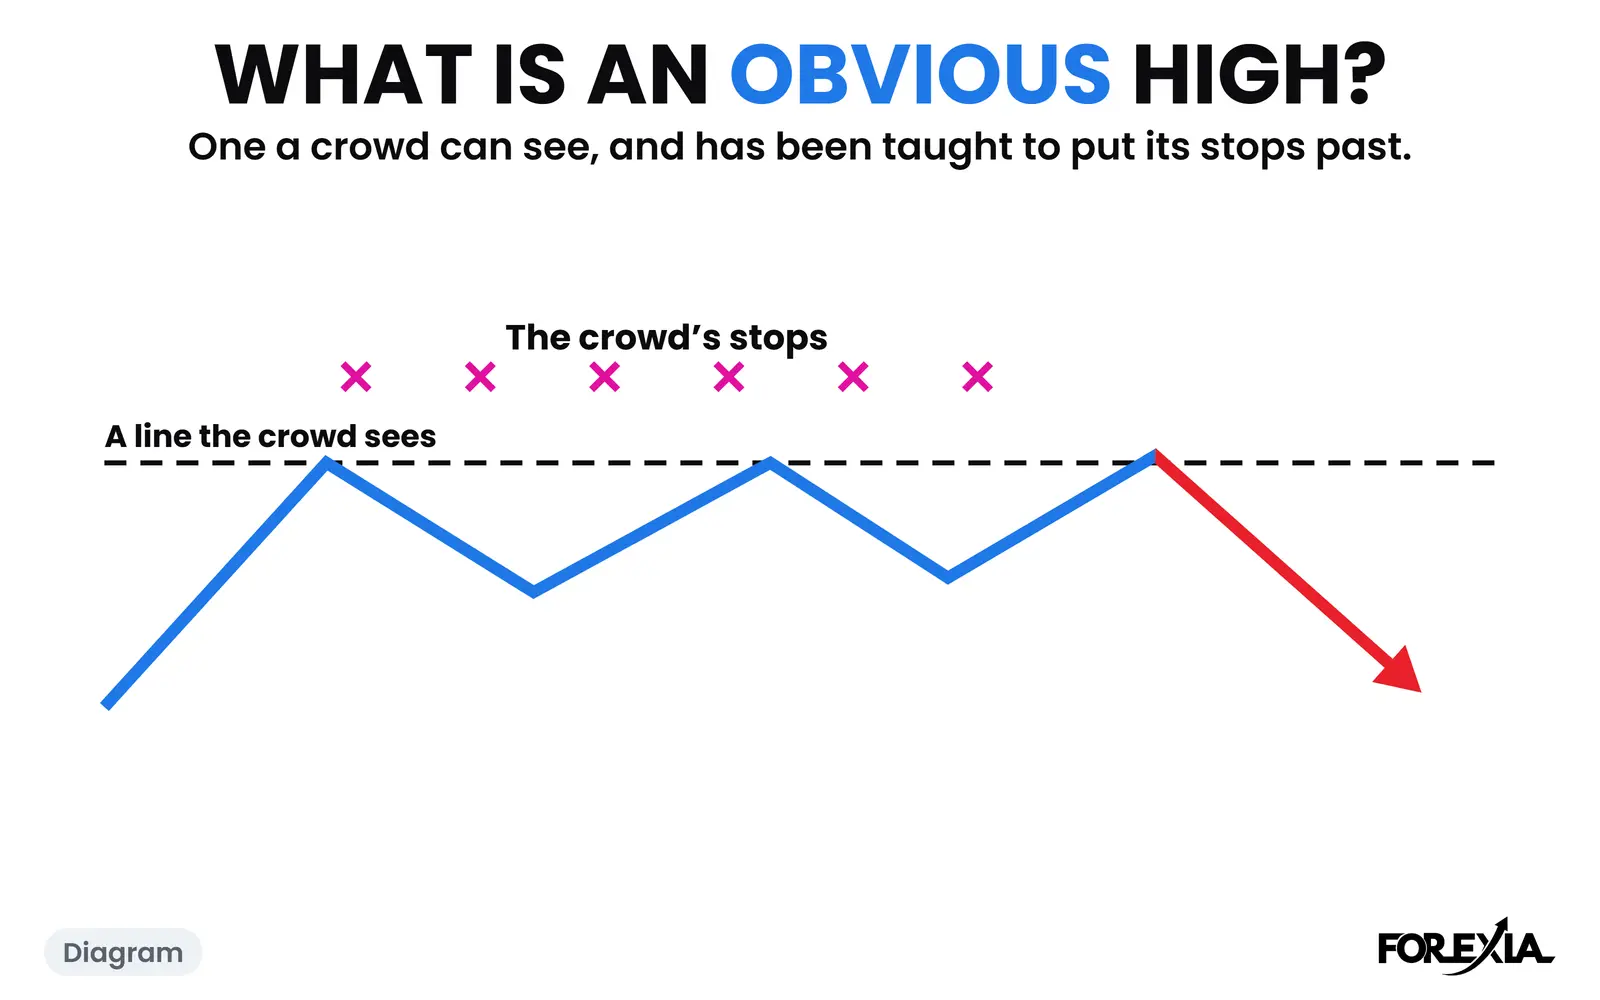
An obvious high or low in forex is one a trader can see without drawing anything, and one that the textbook tells them to put an order past. That makes it a place where orders gather. The usual four are the edge of the overnight range, the previous day's high or low, last week's high or low, and two touches at the same price.
This page sorts the levels that qualify from the swing points that do not. It counts how often each kind gets taken, and it shows a real day with two highs level to a tenth of a pip. Orders cannot be seen on any chart, so "obvious" here is a read, and we say where it stops.
What is an obvious high or low in forex, and what makes it obvious?
A level is obvious when three things are true. Anyone looking at the chart can see it. More than one trader has the same reason to use it. And it is recent, so it still sits on the screen.
Take the three seats. Retail sees a line and a rule from a book: sell the top, buy the break, put the stop just past it. The market maker's seat sees where those rules send the orders. The observer sees only whether a candle goes through and whether one closes back. We read market makers as the ones who build the chart, and that is a read and not a fact.
Marking these places before the session is Liquidity Mapping. Working out whose order is where is Liquidity Visualization. Neither can see an order, and neither pretends to.
Which levels do traders treat as obvious?
Four kinds come up on every chart we mark, and each is counted below.
- The edge of the Asian range. The calm overnight hours leave a box with a top and bottom, and the crowd marks both. We draw it as the Asian Box.
- The previous day's high and low. Yesterday's two extremes carry over the 17:00 New York session break into today.
- The week's high and low. Last week's extremes stay on the chart, and this week's build as the week goes. The Week's High and Low is where the biggest pool is read, and weekly high and low liquidity has its own page.
- Equal highs and lows. Two touches at the same price make a line anyone can draw. This one needs the most judgement, and the next section shows it.
Round numbers and a day's own high and low so far are also used, and the High and Low of the Day keeps the live version. We have no count for round numbers, so we say nothing about them here.
How often is each kind of level taken, and how often does price close back?
Most levels that get taken close back the same day. We counted every time one of these was traded through after the London open by at least 3% of the average daily range, on seven dollar majors and gold, from 6 April to 1 October 2026. A level Asia had already passed is left out. "Closed back" means a 15-minute candle closed on the near side of the line by 17:00 New York.
| Kind of level | Taken | Closed back the same day | No close back |
|---|---|---|---|
| Edge of the Asian range | 1,179 | 969 | 210 |
| Previous day's high or low | 422 | 341 | 81 |
| All the levels above | 1,601 | 1,310 | 291 |
Last week's high or low was counted on its own, by the week. Over 24 whole weeks on the same eight markets, from 13 April to 25 September, the first candle to trade past the line by 3% of the daily range came on 177 of the market-weeks' lines, and a candle closed back on the near side of it before Friday's 17:00 in 157 of them.
These count candles, not trades. A close back does not make the trade the other way pay, and our own test of that setup as a mechanical rule did not make money. The counts say that obvious levels are taken often and usually closed back. They do not say that a level has orders, or that more orders sit there than anywhere else. We have no count of price taking a level that was not obvious, so there is nothing to compare these against, and that is the honest limit of the table. The script is scripts/seo-counts.mjs, and the sample ends on 1 October.
What do equal highs and equal lows look like on a real day? EUR/USD, 24 September 2026
EUR/USD made two lines on one morning without a drawing tool. The first was a pair of highs. At 07:15 New York a candle reached 1.13776. At 09:00 another reached 1.13776, the same price to the fifth decimal. The second was a pair of lows. The 06:15 candle reached 1.13616 and the 08:30 candle 1.13623, 0.7 of a pip apart.
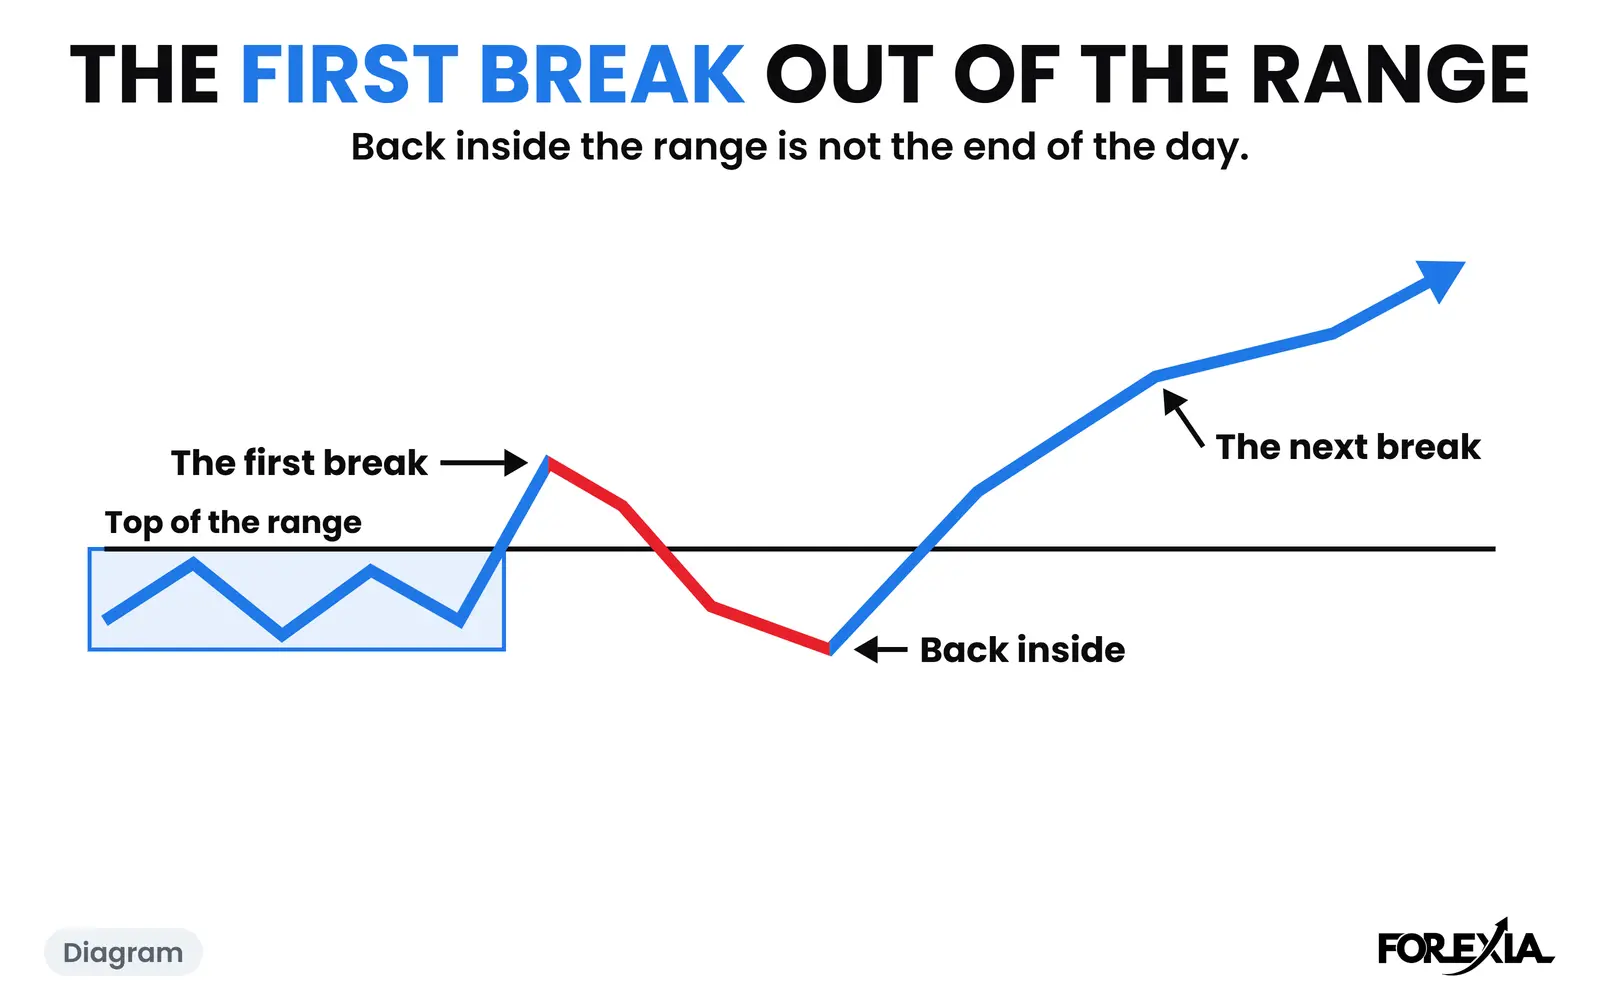
Look at what happened to the lows first. The 09:15 candle reached 1.13594 and closed at 1.13595, under both. The 09:30 candle went to 1.13590 and closed back over them at 1.13673. That is a stop hunt of the lows by the usual test: through the line, and a close back. At 10:00 a candle took the highs, 0.9 of a pip over them at 1.13785, and closed at 1.13775, a tenth of a pip under. Then the 12:15 candle ran to 1.13916, 14 pips over the line, and closed at 1.13826, well above it.
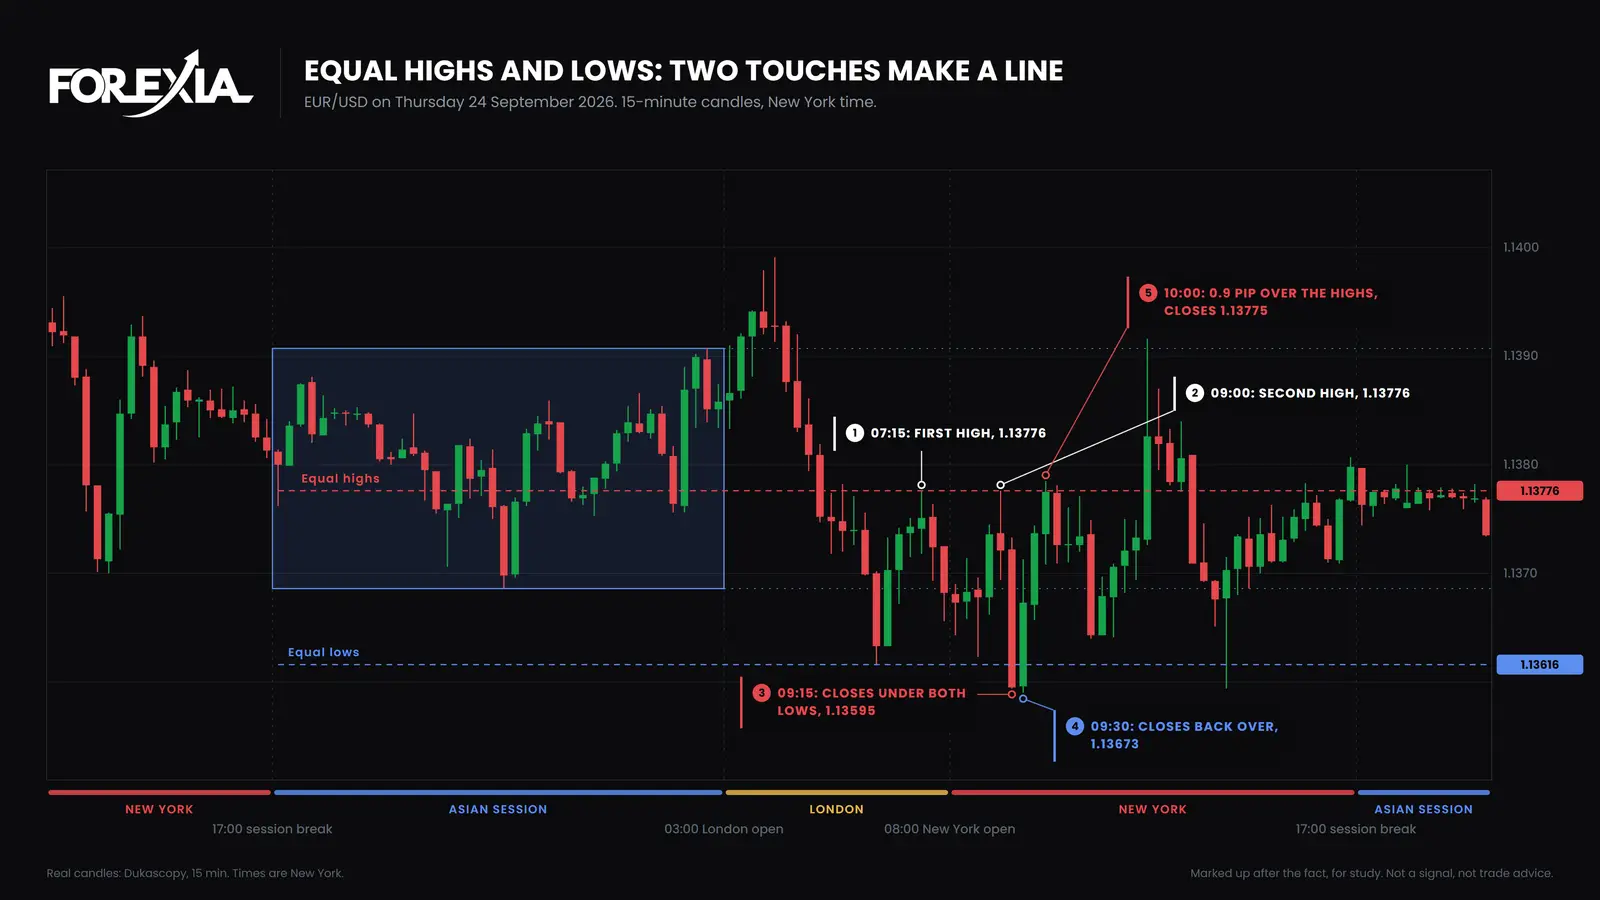
Times are New York, and the candles are 15-minute Dukascopy, so your broker's chart may differ by a pip or so. We cannot say anyone had an order at either line, and the candles do not show it. What we can say is that both lines were drawn on the screen of anyone watching, and price went to both within an hour. The day was one of ours picked afterwards, and a reversal seen afterwards is not a setup.
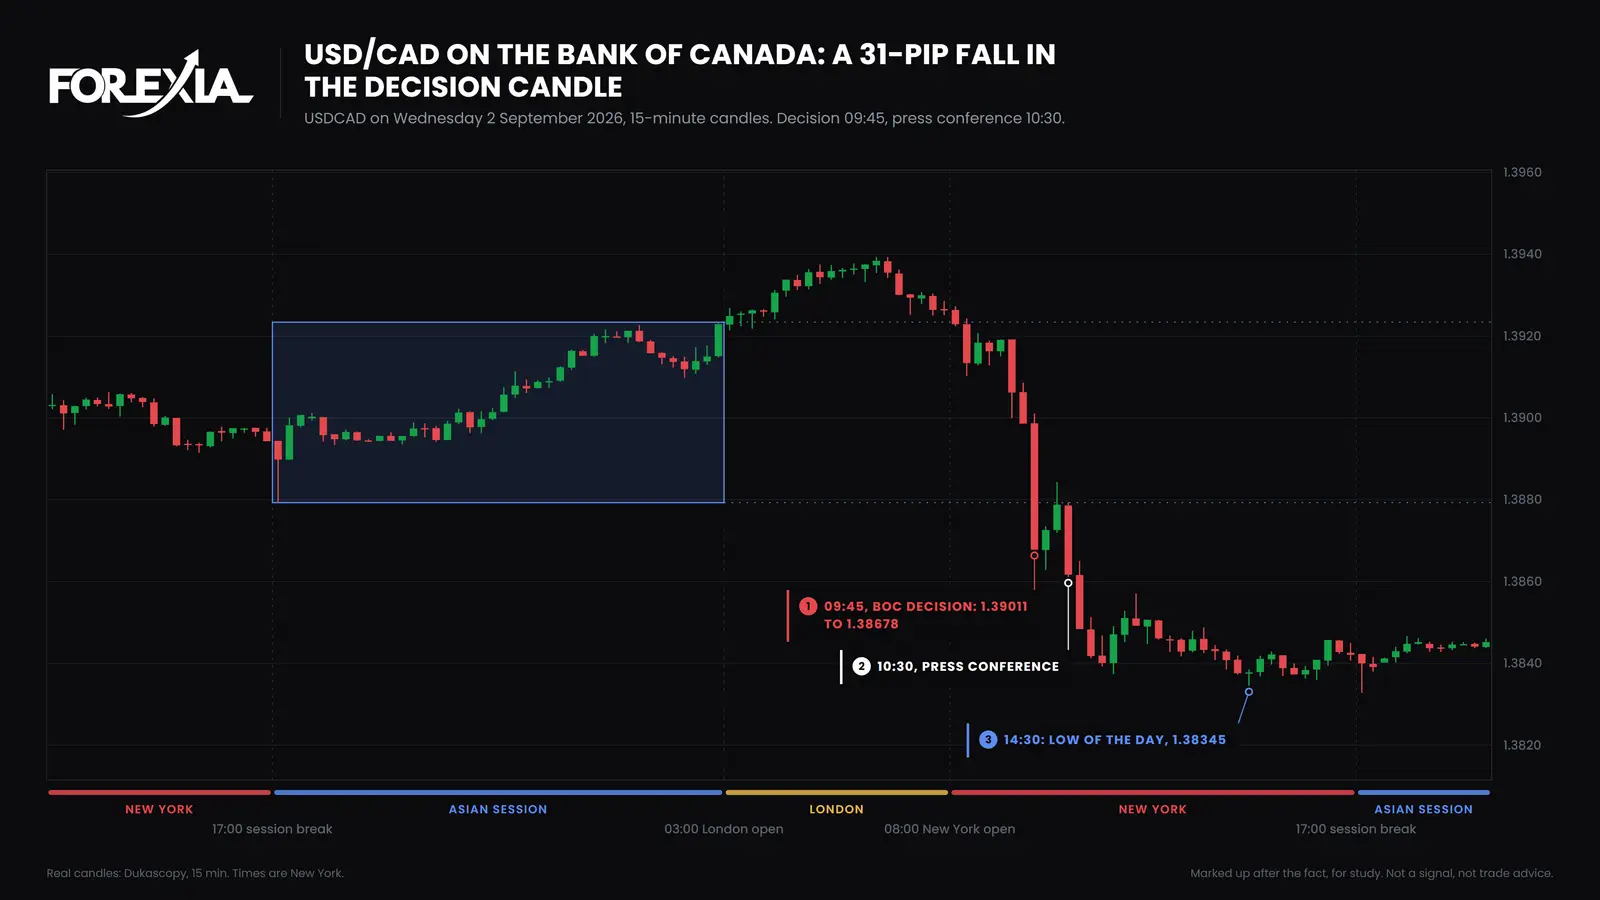
The same day also showed the other kind of level. The morning's first push, at 04:00, took the Asian high at 1.13907 by 8 pips, to 1.13991, and the 04:30 candle closed back at 1.13876. Which level was the obvious one depends on whose chart you were looking at.
Does a line always get visited? GBP/USD, 13 July 2026
No, and a second day shows it. On Monday 13 July 2026 GBP/USD made two highs a tenth of a pip apart. The 07:00 New York candle reached 1.34022, and the 09:00 candle reached 1.34021. Two more highs a pip lower, 1.33988 at 06:45 and 1.33989 at 08:45, sat just under them. That is a line anyone could draw.
The morning's real high had come earlier. At 04:15 price reached 1.34114, 19 pips past the Asian high of 1.33921, and it was already behind us when the line formed. After the 09:00 candle, price never traded back over 1.34021. It fell to 1.33422 at 16:15, 60 pips under the line. Our calendar has only medium-impact speeches that day, none near the line.
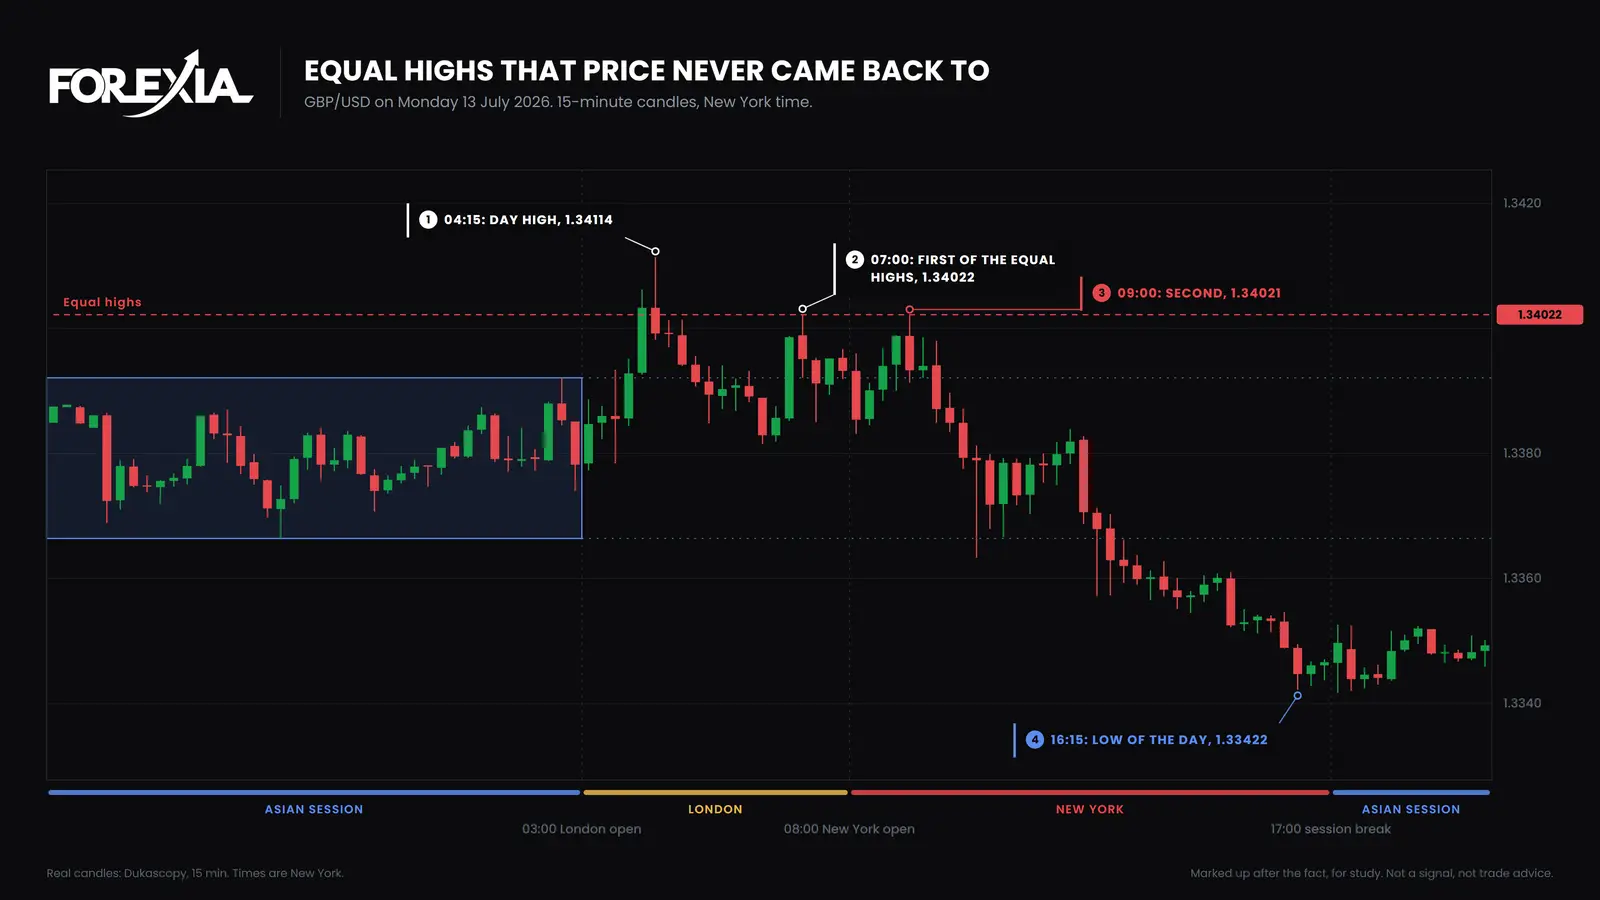
So a line is a place where orders may have gathered, and it is not a promise that price will come for them. On the euro day above, price took both lines within the hour. On this day it took neither again. We have no count of which happens more often, and nobody has shown us one.
Does every swing high hold stop orders?
No. A single peak in the middle of a move gives nobody a reason to put an order past it. It was not a boundary, nobody sold at it with a rule from a book, and by the next hour it has scrolled out of sight. On the same EUR/USD morning, the high at 04:00 mattered because it sat just past the Asian high and a lone peak with nothing at its price would not have been one.
Two touches in a row are more convincing than one, and the pattern behind that is the double top. Is a double top a stop hunt goes through it, and The Third Tap is the clean third touch that makes a level look safe. In our count of 983 double tops and bottoms in the same sample, 680 never closed through their neckline. So an equal high is a place where orders gather, and it does not tell you what price does there.
How close counts as equal is a judgement. Chart tools ask for a tolerance, and a tight one misses real pairs while a loose one joins unrelated highs. On our day we accepted 0.7 of a pip on a pair that price cleared in the same hour, and a pair apart by 10 pips would not have counted. The pip scale depends on the market and on the day's range, so we do not give a rule.
What do traders get wrong about obvious highs and lows?
Three readings cost the most.
- Treating every swing point as a pool. A level collects orders by being seen, not by being a peak.
- Reading the level as a forecast. It says where orders probably are. It does not say when price goes there, or whether it comes back.
- Forgetting that your own stop is part of the pool. If your stop sits just past an obvious level, it sits with everyone else's. Why stop losses sit above highs and below lows explains the mechanics, and sweep, grab or run sorts the three endings.
For the wider picture, start with the liquidity sweep hub.
Course 1 of ForexiaPRO, Reading the Map, teaches this read step by step in lesson 1.2.2, The Daily Pools.
Frequently asked questions
What is an obvious high or low in forex?
It is a high or low that a trader can see on the chart without drawing anything, and that the usual textbook advice tells them to put an order past. The usual examples are the edge of the overnight range, the previous day's high or low, last week's high or low, and two or more touches at the same price. Whether any orders really rest there is a read, and no chart shows it.
What are equal highs and equal lows?
They are two or more highs, or lows, printed at nearly the same price. Two touches make a line that anyone can draw, and stop-loss orders tend to be placed just past it. How close counts as equal is a judgement. On our EUR/USD example, two highs matched to a tenth of a pip and two lows were 0.7 of a pip apart.
Are equal highs a double top?
A double top is a pattern built from two highs, so equal highs are its raw material. The pattern adds a reading, that price should turn at the second touch. Our own count of 983 double tops and bottoms found 680 that never closed through the neckline, so the line is a place where orders gather. It is not a promise about the turn.
Does every swing high hold stop orders?
No. A single peak in the middle of a move, on a chart few people watch, gives nobody a reason to put an order past it. A level collects orders when it is visible, when more than one trader has the same reason to use it, and when it is recent. Nobody can count the orders, so the test is a judgement and not a measurement.