Asian Range Breakout: Why the First Break Often Fails
Dylan Forexia8 min read
An Asian range breakout often does not hold. On our count of eight markets from 6 April to 1 October 2026, the first edge of the Asian range to be taken closed back inside by 17:00 New York on 806 of 958 market-days. The day still ended beyond that first edge on 529 of them. The break came back, and the day often went its way anyway.
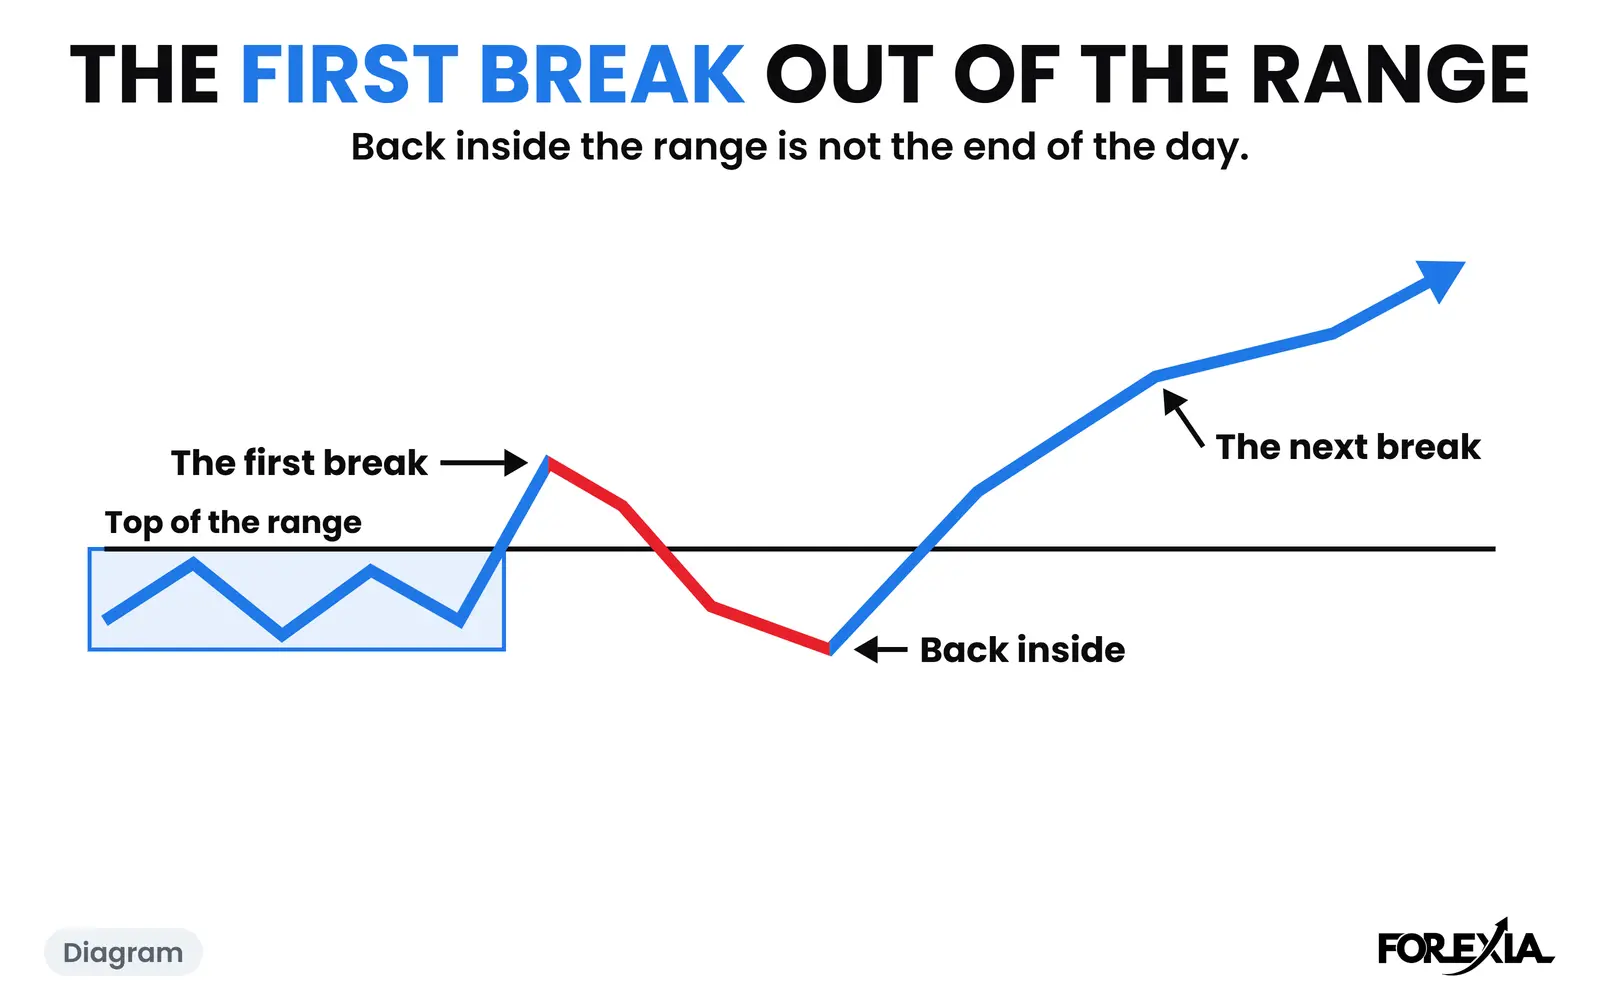
Those two facts are why this search has so many wrong answers. "The first break fails" is true if you mean it comes back, and false if you mean the day reverses. Most pages that rank for it give a script and leave out both counts.
What is an Asian range breakout?
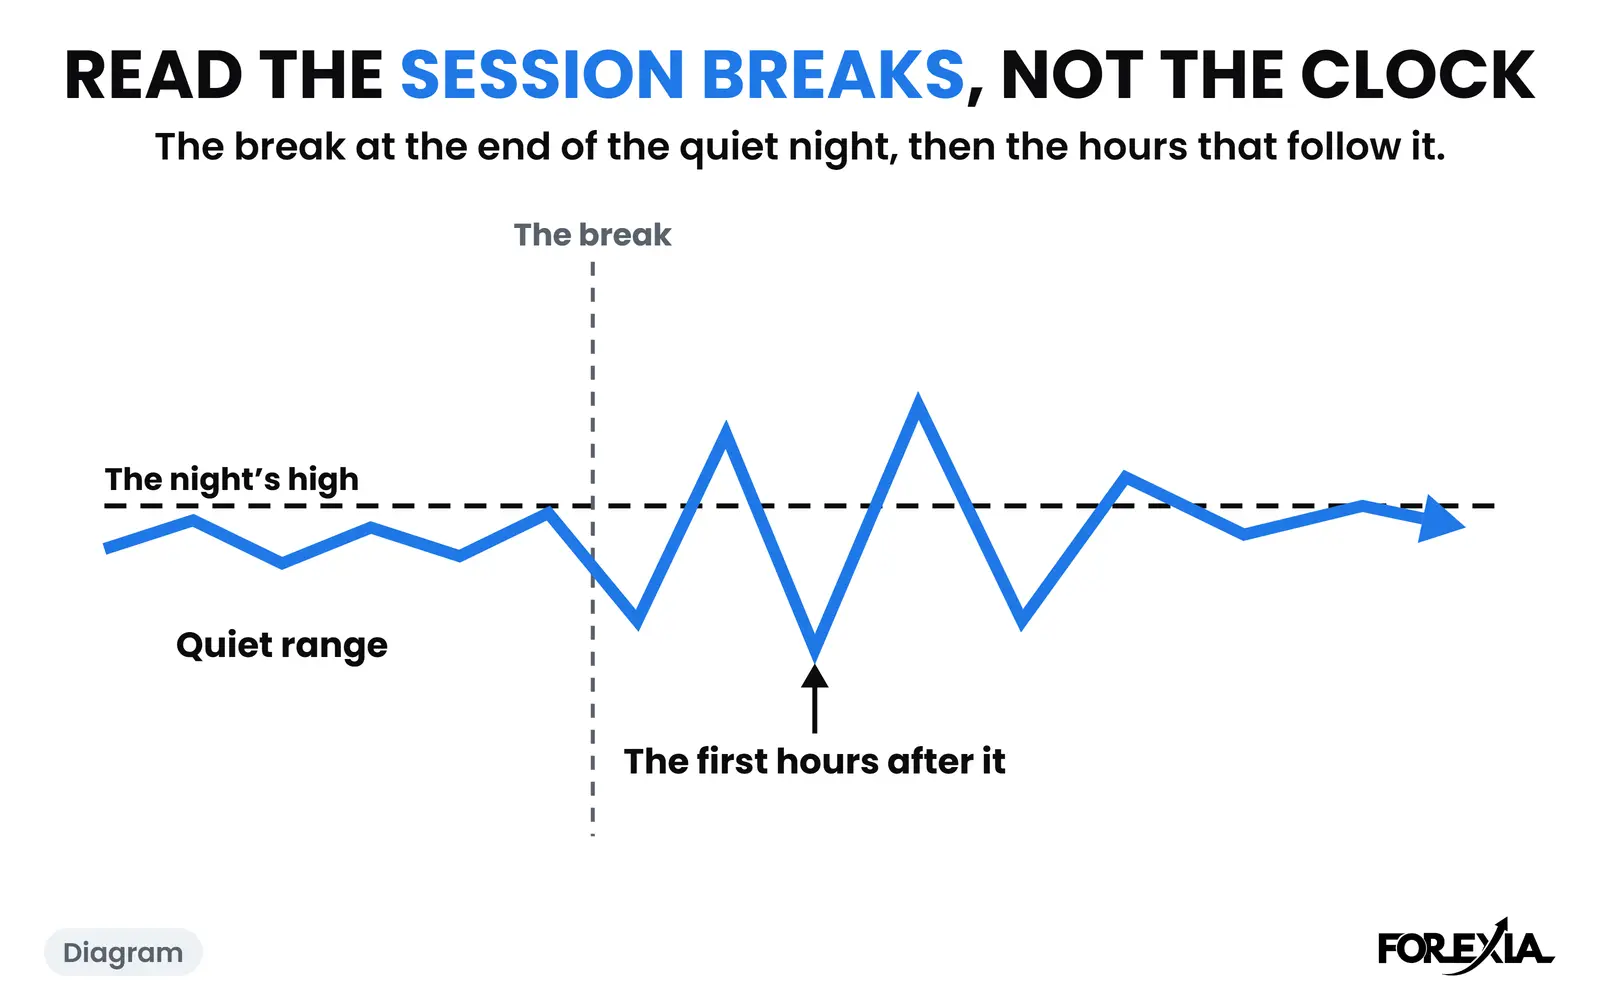
An Asian range breakout is price trading out of the high or low of the quiet hours before London opens. We draw that range as the Asian Box, from the 17:00 New York session break to the London open at 03:00 New York in most weeks. The textbook reads the first move out as the start of the day's trend, and that first move is what we mean by the first break. The forex sessions page has the clock and the hours.
Two definitions matter for the counts below. A break is "taken" when a 15-minute candle after the London open trades past an edge by at least 3% of the market's average daily range. A "close back" is the first candle from then on that closes on the near side of that edge again. On the charts further down we use the plainer read: the first candle that closes outside the box.
Why does the first break come back?
We read it as orders. A quiet night gives the crowd two obvious edges, and the stops of traders who sold the high or bought the low sit just past them. The first move out of the box meets those orders, and so it meets the crowd entering on the break too. The crowd's entries and the crowd's stops are the orders a larger seller needs on the other side. This is the stop hunt in the sense of our word, and a liquidity sweep in the sense of most traders' word. We cannot see those orders, so that is a reading and not something we have measured.
What we can measure is how quickly it comes back. Of 1,179 edge breaks, 969 closed back by 17:00. Of those, 279 closed back on the same candle that took the edge, 449 within the next hour and 241 later in the day. So 728 of the 969 came back within the hour. A median close back went 9% of the average day past the edge before it turned. The 210 that did not close back went a median 64% of the average day past it.
What did the first break do in the day, counted?
Across 958 market-days on seven dollar majors and gold, one edge of the box went first and the order is known. On 521 days the high went first and on 437 the low.
| What happened | Market-days |
|---|---|
| The first edge closed back by 17:00 | 806 |
| The other edge was taken too | 217 |
| The day ended beyond the first edge | 529 |
| The day ended inside the box | 308 |
| The day ended beyond the other edge | 121 |
The last three rows add to 958. They are counted on the day's last candle, from the box's edges, so they say where the day ended and nothing about what a trade would have made. "Ended beyond the first edge" does not mean the move was smooth. Of the 969 edge breaks that came back, 620 saw a later candle that day trade past the furthest price the break had reached.
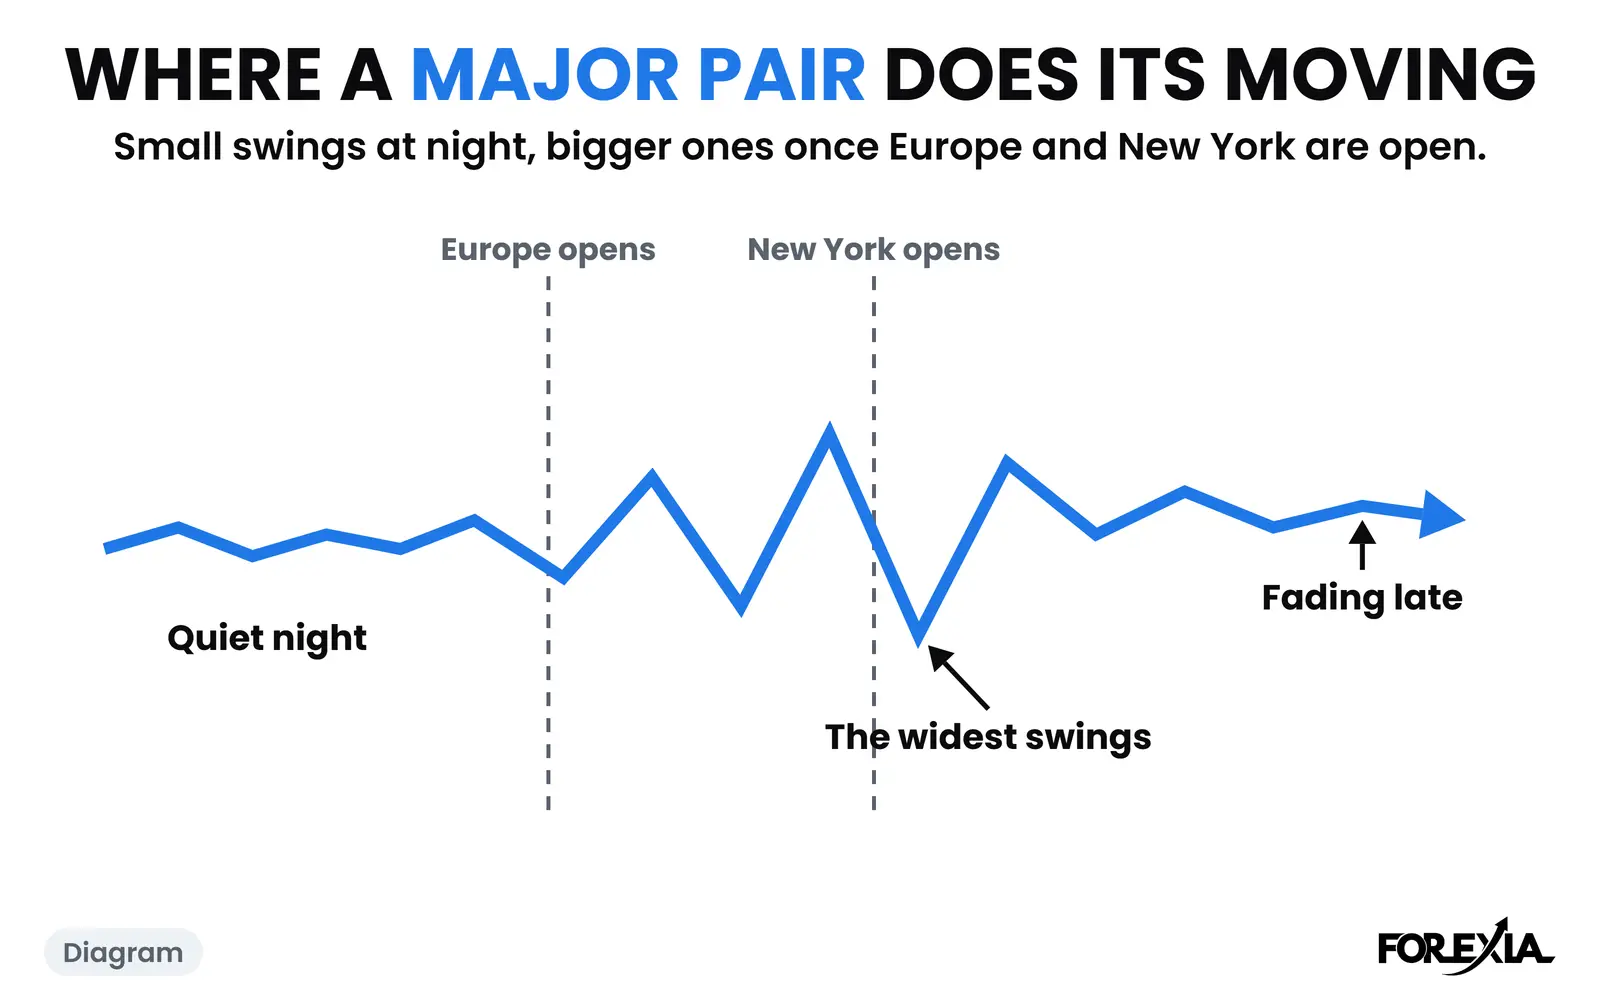
The first two hours of London were the busiest for first breaks, with 534 of the 958 days. On those, 450 closed back, and the day ended beyond the first edge on 310.
A break that came back, and the day turned: EUR/USD, 23 June 2026
On Tuesday 23 June 2026 the Asian box ran 13 pips, from 1.14186 to 1.14319. The 03:15 New York candle reached 1.14390 and closed at 1.14374, the first close over the box. The euro area's purchasing managers' indexes sat on our calendar at 03:15 and 03:30, and the 03:30 candle fell to 1.14121 and closed at 1.14157, under the whole box. The low of the day was 1.13755, 63 pips under the high of the first break.
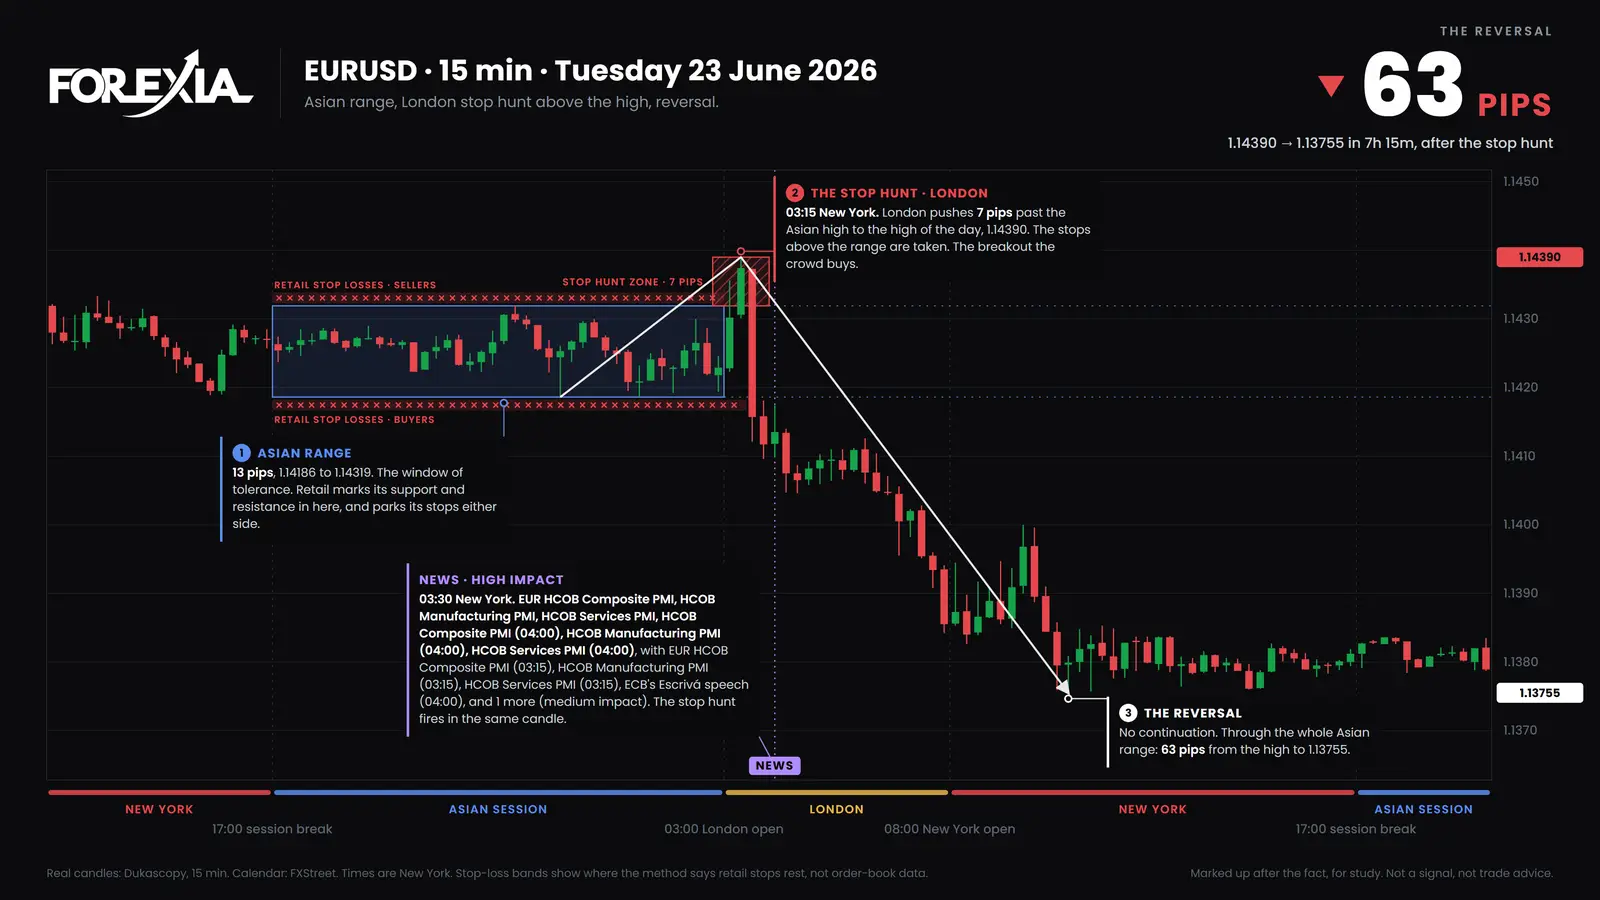
Anyone who bought the 03:15 close had a stop under the box, and that stop was gone one candle later. The crowd sold the same price with a stop above the box, so there was nothing on that chart to say which way the day would go. The seat that sees the break first is the retail one, and what it sees is a breakout with momentum. The market maker's seat is the one with orders to fill. The observer's seat sees a close over a box and nothing more until the next close arrives.
A break that came back, and the day went its way anyway: EUR/USD, 13 April 2026
On Monday 13 April the box ran 31 pips, from 1.16638 to 1.16948. The 03:15 candle closed at 1.16967, two pips over the edge. The 04:00 candle closed at 1.16920, back inside, and price spent a few hours drifting inside the box. The day's only medium-impact release before 10:00 was a speech by an ECB official at 08:15. At 14:45 price reached 1.17653, 70 pips over the box's high, and the last candle of the day closed at 1.17582.
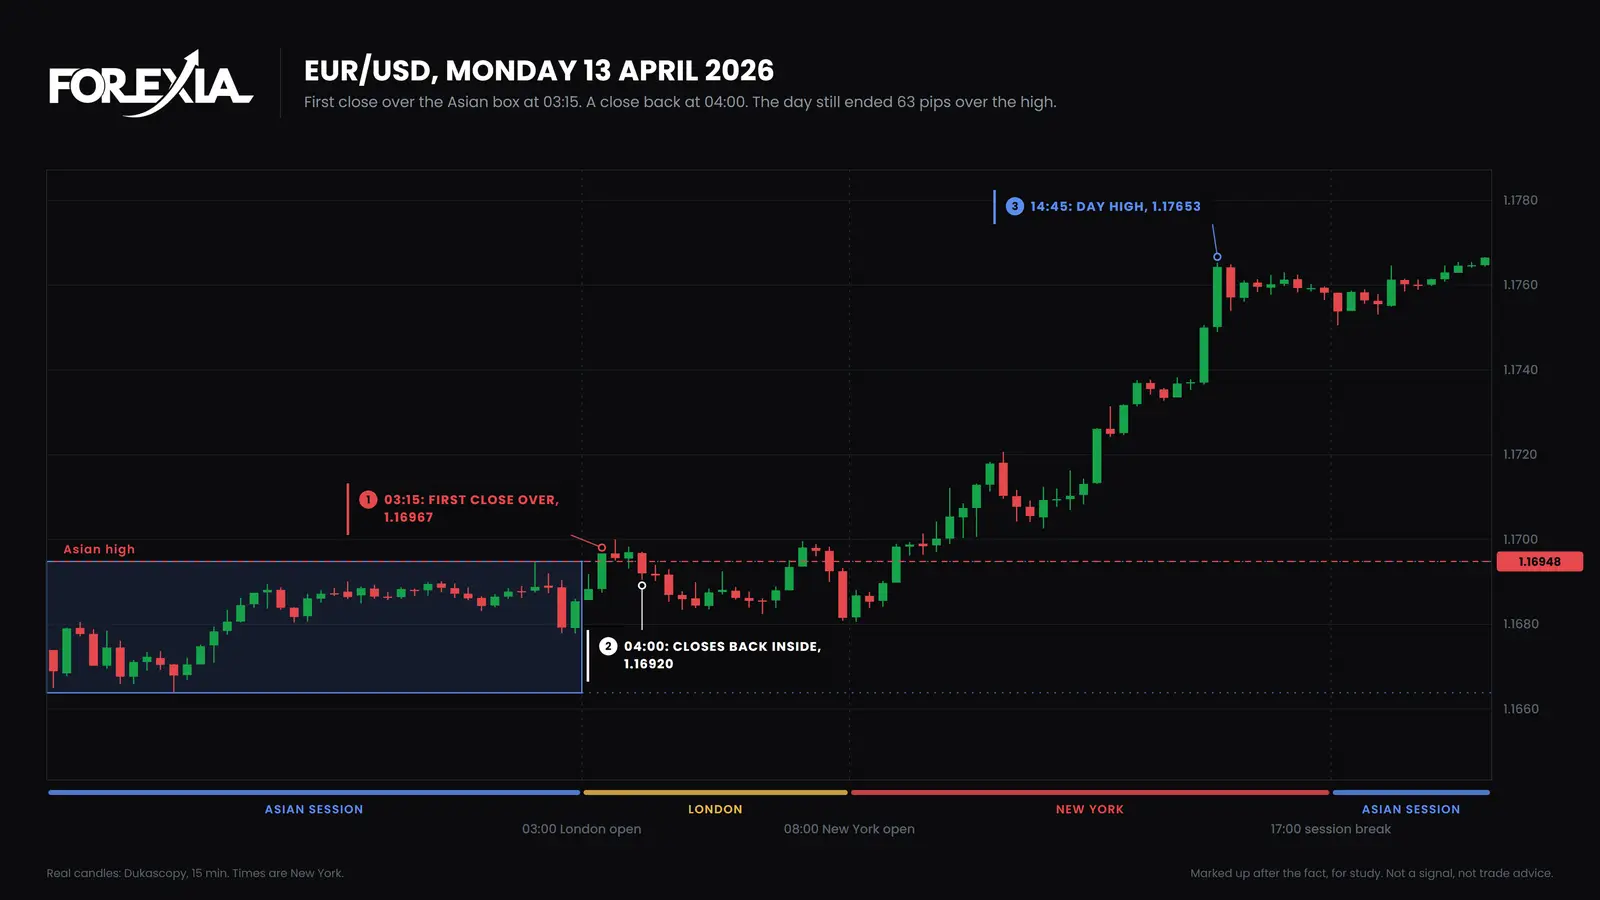
A reading made afterwards says the first break was fine and the close back was a pause. Someone who sold the close back at 04:00 would have been wrong for most of the day. That is the 529 days in the table. It is also why a close back, however clean, is a fact about one candle and not a forecast.
A break that never came back: GBP/USD, 13 April 2026
Cable did the same morning more plainly. Its box ran 34 pips, from 1.33806 to 1.34146. The 03:00 candle closed at 1.34153, seven tenths of a pip over, and no candle closed back inside for the rest of the day. The high was 1.35083 at 16:00, 94 pips over the box.
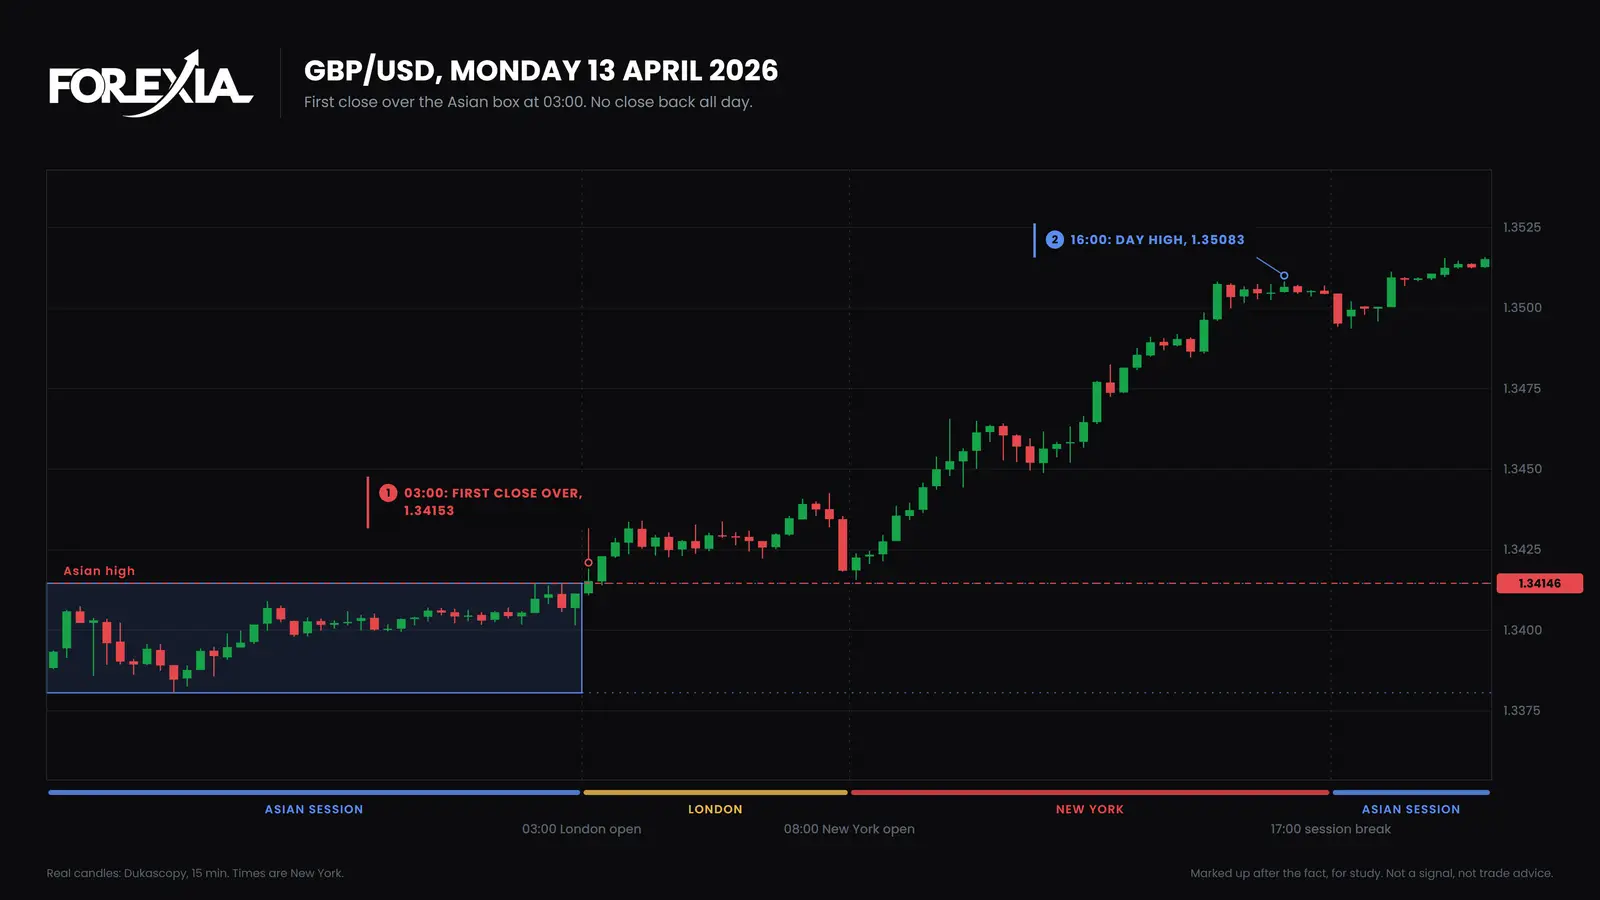
Those 210 edge breaks with no close back are the other side of the counts. Both days above start with a close a hair over an edge, and the first one did not tell the two apart. The difference only showed in what came later.
What does this not tell you?
It does not tell you what an Asian range breakout trade would have made. The counts are of candles, with no entry, no stop and no cost, on eight markets in six months in one setting of the clocks. They are our reading of where the orders were, and a chart cannot prove that. Our own test of the setup as a fixed mechanical rule did not make money. A reversal seen afterwards is not a setup.
It also does not say the first break is the wrong side to be on. On more than half the days in the table the first edge was where the day ended. On nearly a third the day finished inside the range.
For where each pair does its moving across the hours, see the best time to trade GBP/USD and EUR/USD. If the break stands into the New York open, the NY session reversal counts how often New York turns it. The London Breakout is our name for the first close out of the box, and the close back is the candle that returns.
Common mistakes
Four readings cost traders the most with this search, and each one swaps a fact for a forecast.
- Reading "comes back" as "reverses". 806 breaks came back and 529 days ended beyond the first edge anyway.
- Treating the first candle as the break. A wick through the edge and a close through it are different facts, and the counts above use a size, 3% of the average day, to separate a touch from a break.
- Judging a break from a chart seen afterwards. Every day on this page was picked after it ended.
- Using one clock all year. The box runs to London's open, and that is 04:00 New York in the weeks when the clocks are out of step. The sessions page has the dates.
Course 2 of ForexiaPRO, The Chaos Pattern, teaches this read step by step, starting with lesson 2.1.1, Asia Sets It, London Breaks It, New York Turns It.
Frequently asked questions
Does the first break of the Asian range usually fail?
Price usually comes back inside, and the day usually does not turn. On our count of eight markets from 6 April to 1 October 2026, the first edge taken closed back by 17:00 New York on 806 of 958 market-days. The day still ended beyond that first edge on 529 of them. So a first break often fails to hold and often still ends up right.
Why does the first break out of the Asian range come back?
Our read is that a quiet night leaves two obvious edges with traders' orders just past them, and the first move out fills those orders. Nobody outside a broker's book can see them, so this is a reading and not a measurement. What the candles do show is that the close back came within the hour on 728 of the 969 edge breaks that came back.
Is an Asian range breakout a strategy?
It is a description of what price did, and a breakout of a quiet range is the first thing a textbook says to trade. Our own test of the setup run as a fixed mechanical rule did not make money. A close back that you see afterwards is not a setup, and nothing on this page is a signal.
What is the difference between the first break and the real move?
The first break is the first candle to trade past an edge of the range. The real move is wherever the day ends. They are often the same side, and often not. Of 958 market-days, 529 ended beyond the first edge, 308 ended inside the range, and 121 ended past the other edge.