Best Time to Trade USD/JPY: Tokyo and New York, Hour by Hour
Dylan Forexia7 min read
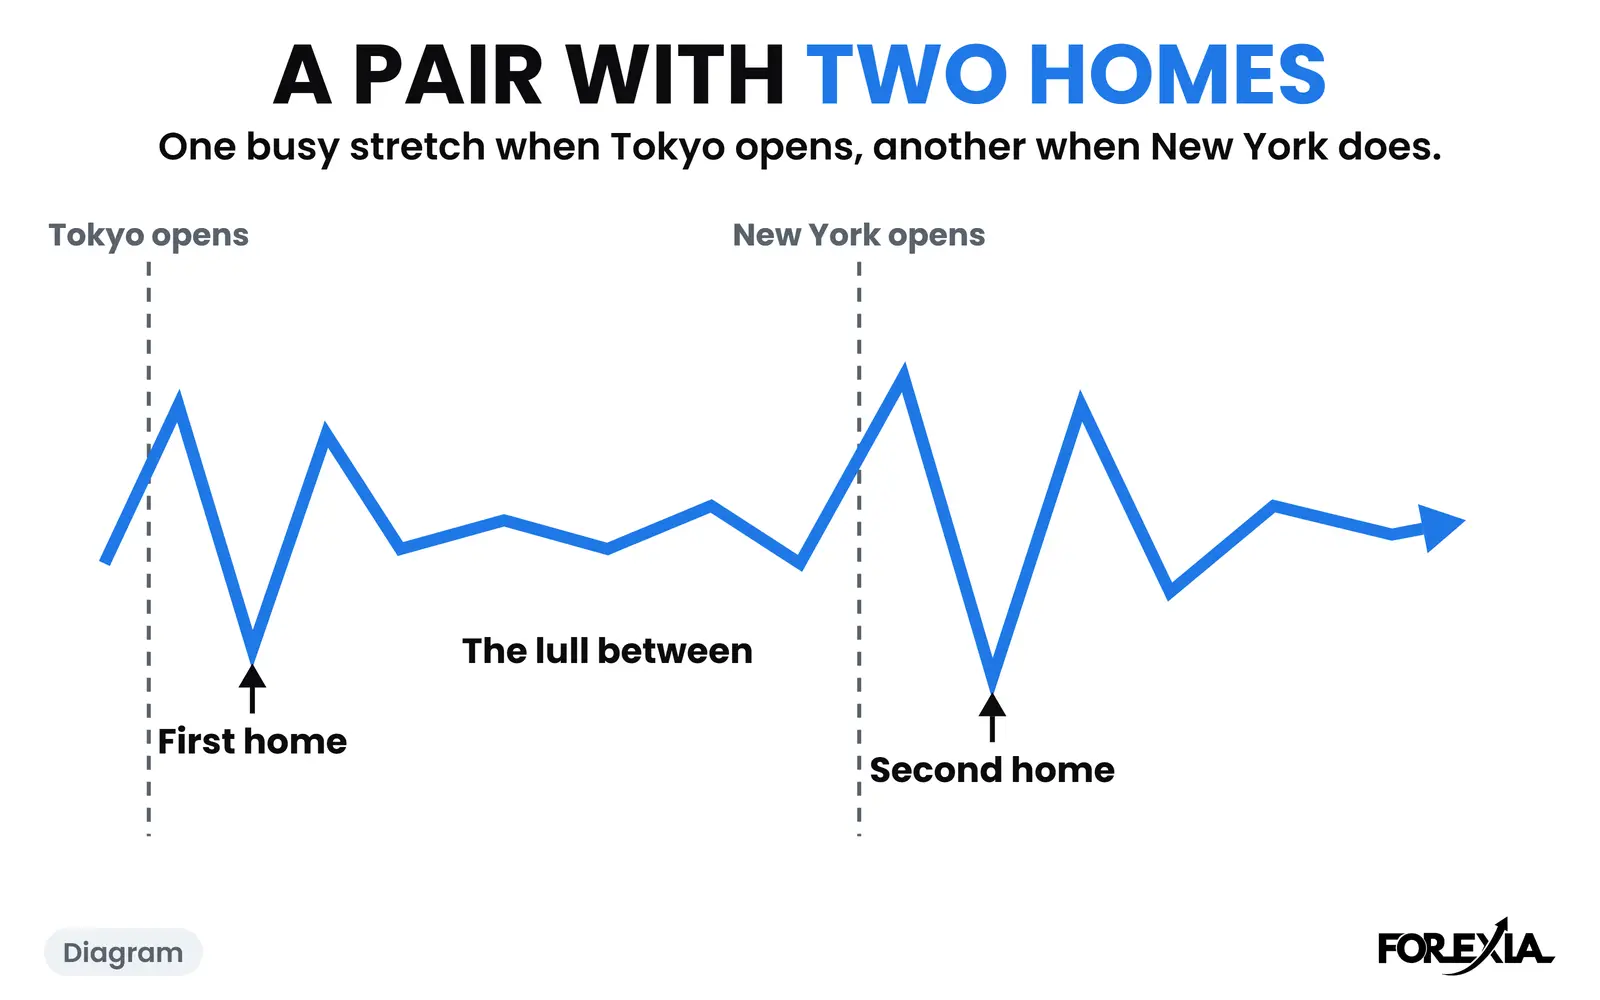
The best time to trade USD/JPY for movement is the New York morning, 08:00 to 11:00, with Tokyo's open a close second. On 129 market-days from 6 April to 1 October 2026, USD/JPY's median range was largest in the 10:00 New York hour, at 18.6 pips, and 16.1 in the 20:00 hour when Tokyo opens. USD/JPY has two homes, and we did not count spreads.
The rest of this page is the hour-by-hour table behind that answer, two real days, and what it cannot tell you. The forex sessions page has the clock and every daylight-saving date.
What is the best time to trade USD/JPY, hour by hour?
Here is each hour of the trading day, from the 17:00 New York break to the next, with its median high-to-low range in pips. An hour is named by the New York time its candles open: the 10:00 row is 10:00 to 10:59. London is five hours ahead of New York in this sample and Tokyo thirteen. The 17:00 row is counted on 128 days and the rest on 129.
| New York hour | London | Tokyo | Median range, pips |
|---|---|---|---|
| 17:00 | 22:00 | 06:00 | 9.5 |
| 18:00 | 23:00 | 07:00 | 8.8 |
| 19:00 | 00:00 | 08:00 | 9.6 |
| 20:00 | 01:00 | 09:00 | 16.1 |
| 21:00 | 02:00 | 10:00 | 13.9 |
| 22:00 | 03:00 | 11:00 | 10.6 |
| 23:00 | 04:00 | 12:00 | 9.2 |
| 00:00 | 05:00 | 13:00 | 9.3 |
| 01:00 | 06:00 | 14:00 | 10.4 |
| 02:00 | 07:00 | 15:00 | 13.4 |
| 03:00 | 08:00 | 16:00 | 15.0 |
| 04:00 | 09:00 | 17:00 | 14.4 |
| 05:00 | 10:00 | 18:00 | 11.9 |
| 06:00 | 11:00 | 19:00 | 11.3 |
| 07:00 | 12:00 | 20:00 | 12.5 |
| 08:00 | 13:00 | 21:00 | 18.1 |
| 09:00 | 14:00 | 22:00 | 16.5 |
| 10:00 | 15:00 | 23:00 | 18.6 |
| 11:00 | 16:00 | 00:00 | 15.8 |
| 12:00 | 17:00 | 01:00 | 12.6 |
| 13:00 | 18:00 | 02:00 | 11.7 |
| 14:00 | 19:00 | 03:00 | 11.1 |
| 15:00 | 20:00 | 04:00 | 9.6 |
| 16:00 | 21:00 | 05:00 | 8.6 |
What the table says:
- The peak is the New York morning, at 18.1, 16.5 and 18.6 pips for 08:00, 09:00 and 10:00, then 15.8 at 11:00.
- Tokyo's open is a real second peak. The 20:00 hour, 09:00 in Tokyo, had a median of 16.1, then 13.9 at 21:00. On EUR/USD the 20:00 hour was 7.4 and on GBP/USD 9.4.
- London's open is a third, smaller one, at 13.4, 15.0 and 14.4 for 02:00, 03:00 and 04:00.
- The lulls are the late afternoon and the start of the day. The median was 8.6 at 16:00 and 8.8 at 18:00, and 9.2 and 9.3 at 23:00 and midnight.
By window, Asia's ten hours had a median range of 41.2 pips, London alone's five 31.3, the overlap's four 34.9 and New York's last five hours 25.3. The windows are different lengths, so read that as a ranking and not a rate. On those figures Asia was the biggest window for USD/JPY, the reverse of EUR/USD and GBP/USD.
When does USD/JPY print its high and low of the day?
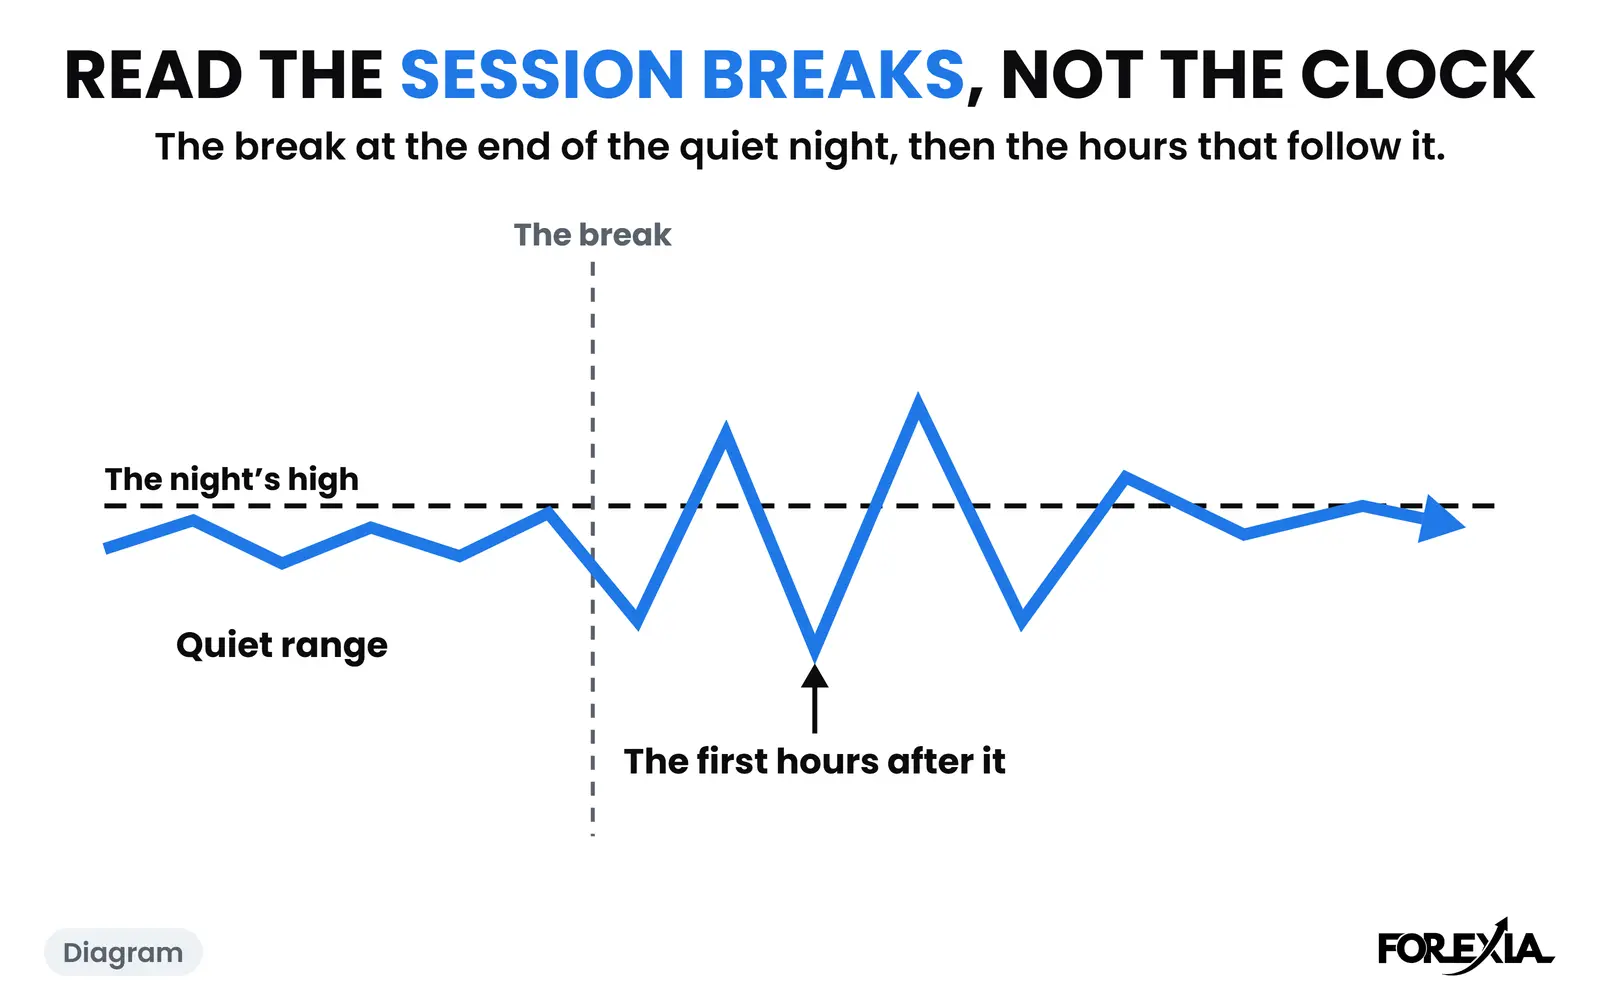
Often in Asia. Of the 129 days, the day's low first printed in Asia on 68 and its high on 44. The overlap held 20 highs and 28 lows, London alone 19 and 23, and New York's last five hours 46 highs and 10 lows. Asia's range was about 62% of the day's at the median.
That fits the habit of the yen to do more of its moving in the Pacific hours. It is also why the Asian range is as wide on this pair as anywhere. The median Asian Box on USD/JPY, 41 pips, was the largest of the seven majors in our count. The Asian session strategy covers what the night sets up.
What does Tokyo's hour look like? USD/JPY, 3 September 2026
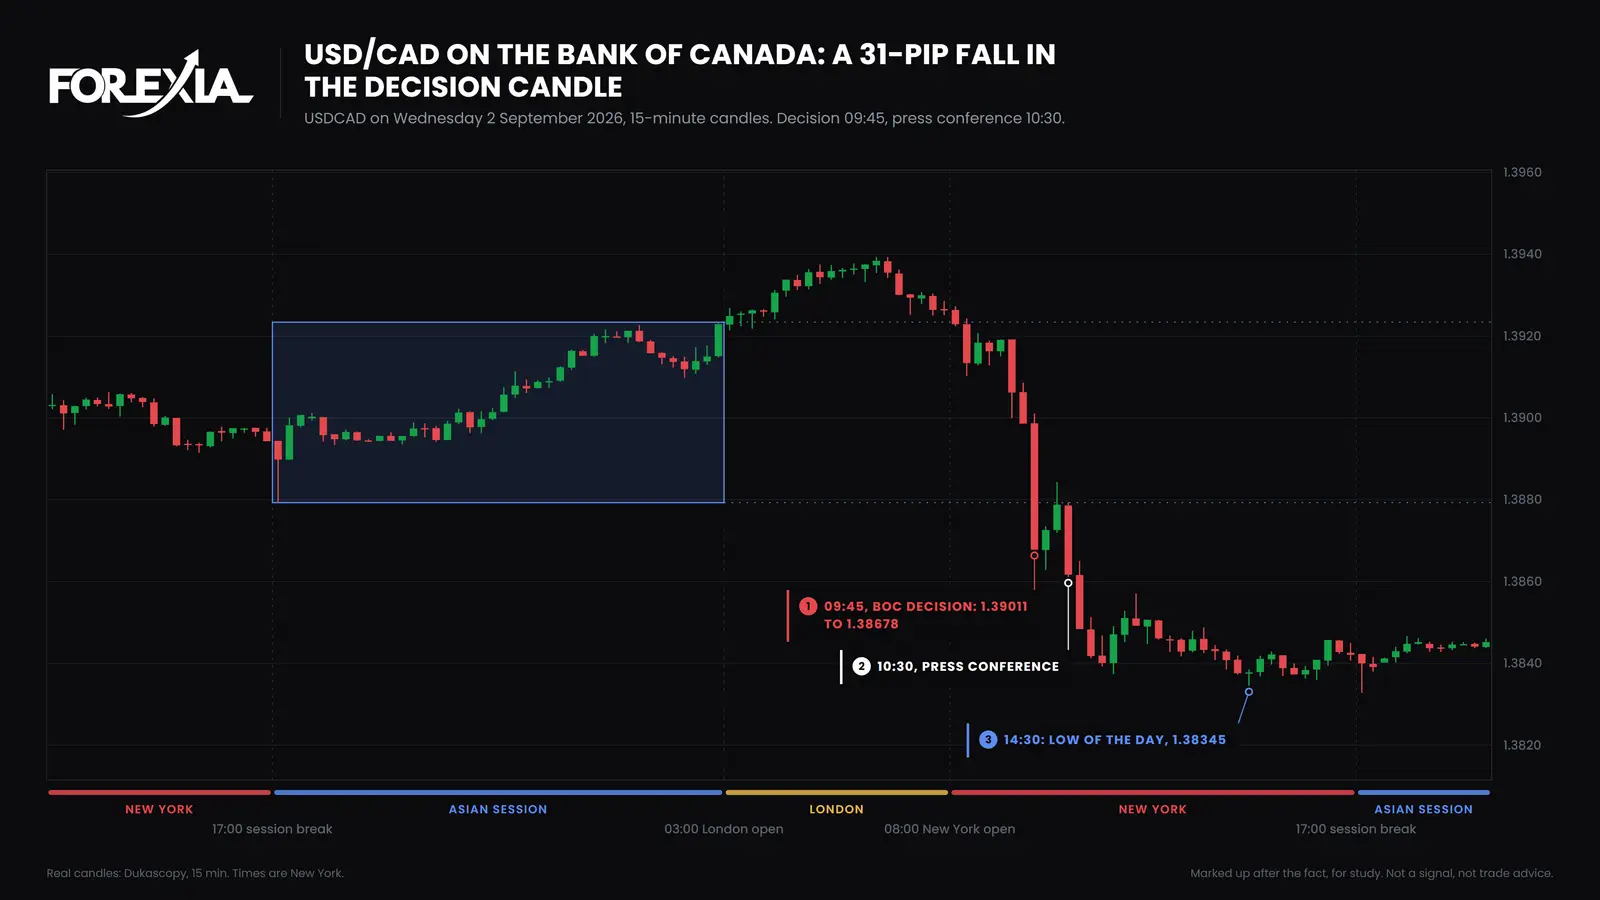
On the evening of Thursday 3 September, the 20:00 New York hour, which is 09:00 on Friday in Tokyo, ranged 66.4 pips against a median of 16.1. Our calendar had no medium or high-impact release for the yen that day. The 20:00 candle fell from 155.638 to 155.294, a 38-pip candle, the low of the day, and price climbed back through the next hours. The Asian range ran 115 pips, 155.294 to 156.446, against a median night of 41. Price was inside it when London opened. At 08:30 the US jobs report took the 08:30 candle up to 156.756, the day's high, and the 08:45 candle fell to 155.352.
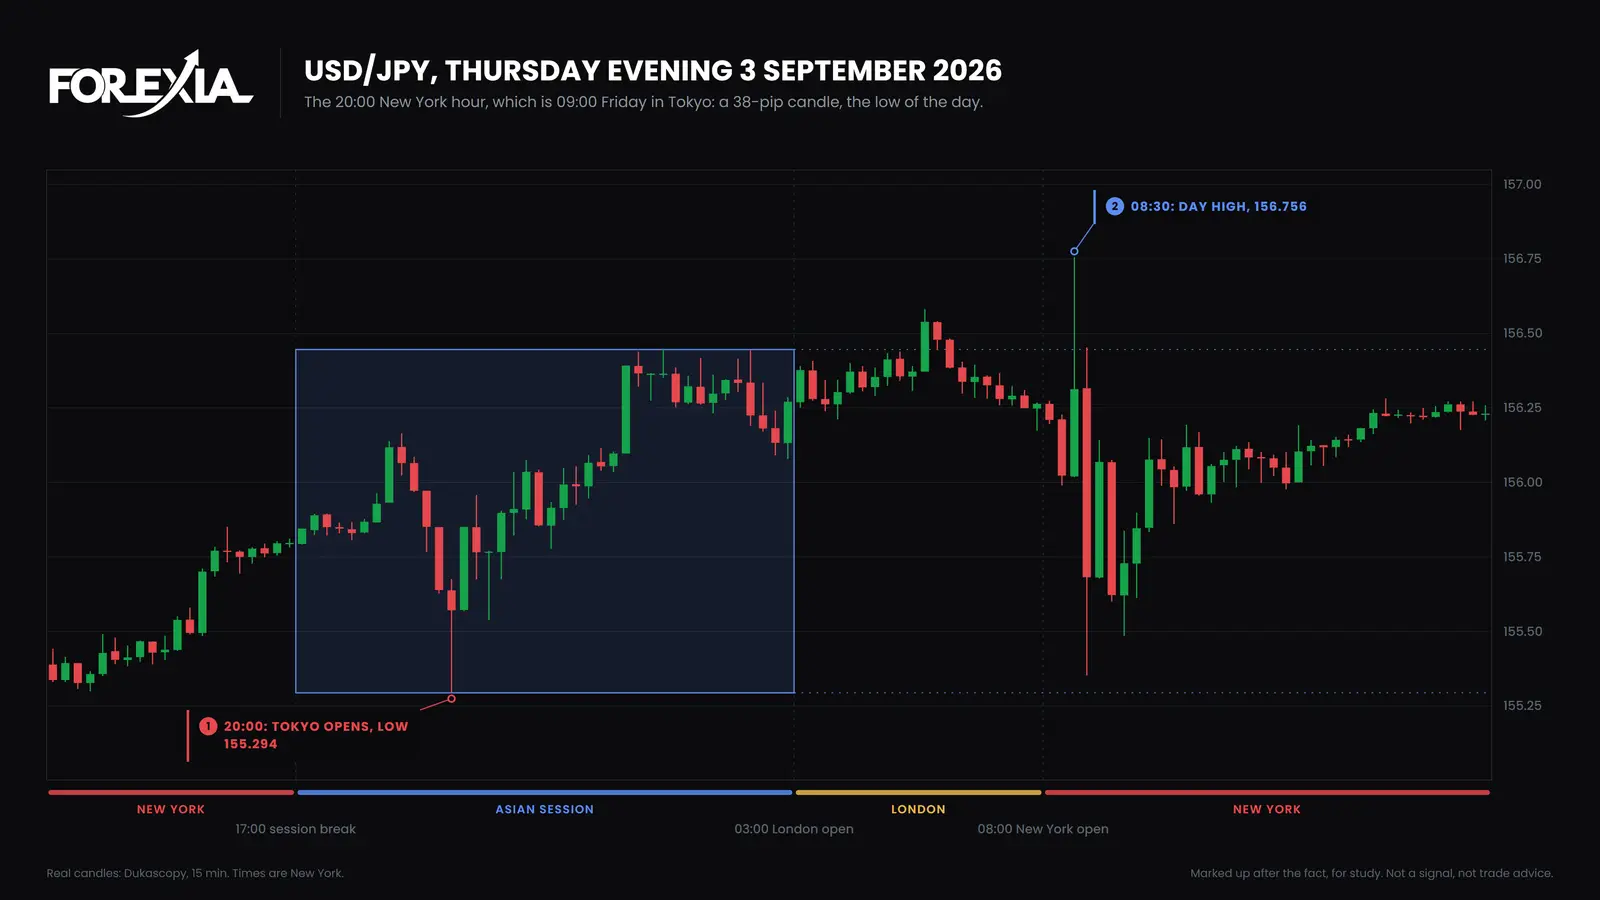
Tokyo's hour did the first of that, with no release behind it on our calendar. We do not know what moved it. A table of hours says when price travelled, not why.
What does the New York hour look like? USD/JPY, 7 August 2026
Friday 7 August had a 36-pip Asian range, 158.216 to 158.573, . At 08:30 New York the US jobs report landed, on our calendar as a high-impact item. The 08:30 candle opened at 158.340 and reached 156.669, a drop of 167 pips in one candle. The 08:00 hour ranged 173 pips against a median of 18.1, and the day ranged 190.
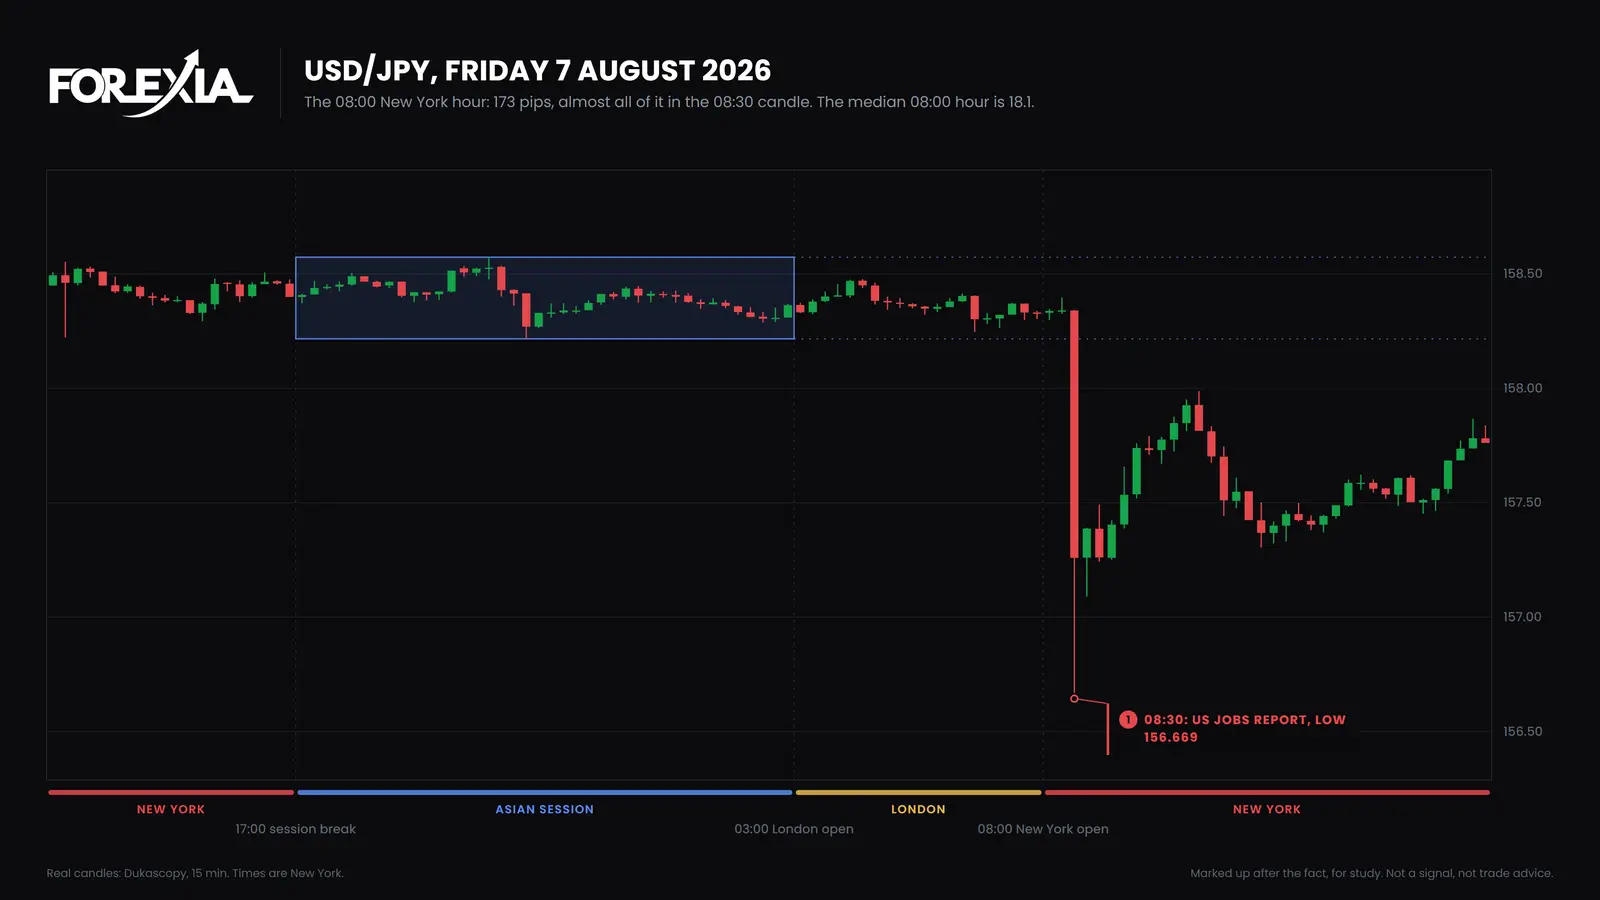
A median is about the usual hour. This is what the tail looks like, and the 08:00 hour's high median owes part of itself to days like it. If you trade near a scheduled release, plan for the tail and not the median.
What does this not tell you?
It does not tell you what a trade in any of those hours would have made. The counts are of ranges from candles, with no entry, stop or cost, on one feed, in one setting of the clocks with New York and London both on summer time. They do not include spreads, which are usually said to be tightest in the overlap, because our feed is bid prices only. Range is not profit: our own test of the setup as a fixed rule lost money in London and in New York alike. A reversal seen afterwards is not a setup.
One thing changes with the season. Japan does not change its clocks, so Tokyo's 09:00 is 20:00 New York while New York is on summer time and 19:00 from 1 November. The table's Tokyo column is for the sample. From 1 November to 14 March 2027, Tokyo's rows sit an hour earlier on New York's clock.
The three seats read the table three ways. Retail reads "busiest" as "best". The market maker's seat is the one nobody outside can see, and we do not claim to know what it does at Tokyo's open. The observer reads it as where price travelled. The Three Seats explains each, and the New York Reversal is our word for what New York tends to do to London's move.
Which hours suit which question?
It depends on what you want from the market, and the table gives a different answer for each.
- If you want movement: 08:00 to 11:00 New York, or Tokyo's first two hours.
- If you want the night's range: Asia, which on this pair is wide and holds the day's low on more than half the days in our count.
- If you want quiet: late New York, 16:00, and the hours around the day's break.
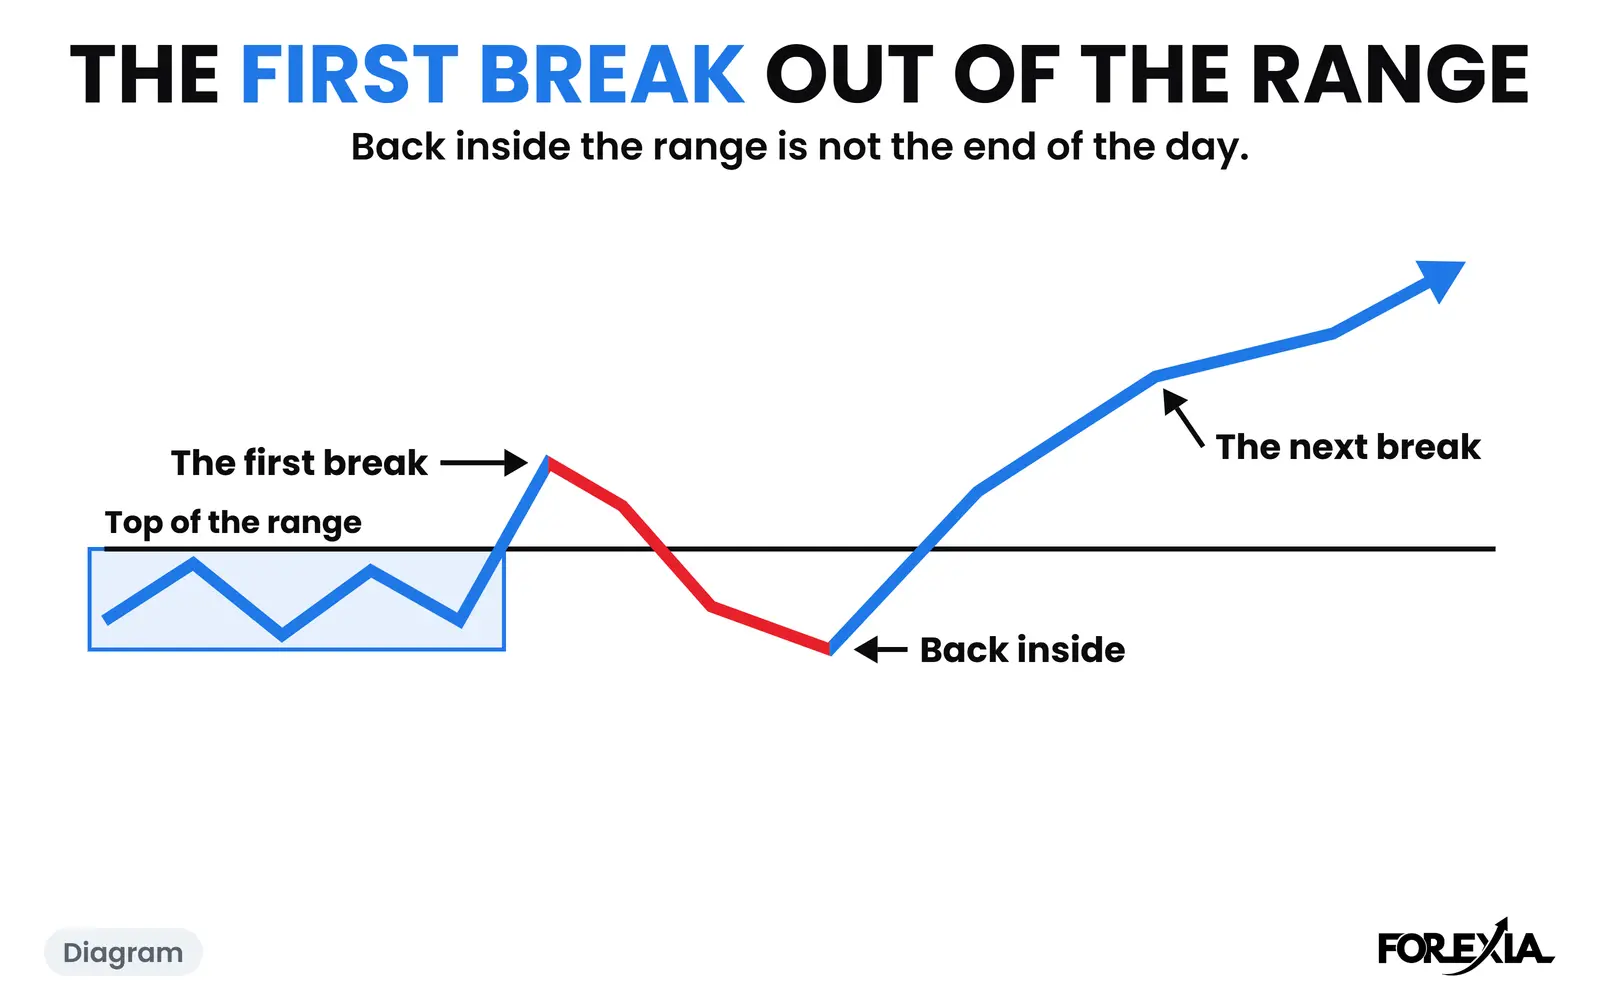
For the week's first hours, see the Sunday open, and for what a break of the night's range does, why the first break of the Asian range often fails.
Common mistakes
Two mistakes matter most with this pair.
- Using London's clock for a yen pair. The yen's busiest hours start in Tokyo, and a table that begins at London's open leaves out Tokyo's whole hour.
- Forgetting the clock change. Tokyo's hour moves against New York's. Read what has closed and not what time it is.
Course 2 of ForexiaPRO, The Chaos Pattern, teaches how a day moves from its quiet night to its New York hours, starting with lesson 2.1 and lesson 2.4.1, The New York Reversal.
Frequently asked questions
What is the best time to trade USD/JPY?
For movement, the New York morning, 08:00 to 11:00 New York time, with Tokyo's open a second window. On 129 market-days from 6 April to 1 October 2026 USD/JPY's median range in the 10:00 New York hour was 18.6 pips, the largest, and 16.1 in the 20:00 hour when Tokyo opens. Spreads were not counted, and movement is not profit.
Does USD/JPY move in the Asian session?
Yes, more than most pairs. Over Asia's ten hours its median range was 41.2 pips, more than London alone's 31.3, the overlap's 34.9 or New York's last five hours at 25.3. The day's low first printed in the Asian window on 68 of 129 days, and Asia's range was about 62% of the day's range at the median.
What time does Tokyo open in New York time?
09:00 in Tokyo is 20:00 New York while New York is on summer time, as in our sample, and 19:00 New York from 1 November 2026. Japan does not change its clocks, so Tokyo's hour moves against New York's twice a year.
Why does USD/JPY jump at 08:30 New York?
US releases land at 08:30 New York, and the dollar is half of the pair. On Friday 7 August 2026 the US jobs report took the 08:30 candle from 158.342 to 156.669, and the 08:00 hour ranged 173 pips against a median of 18.1. That is one day of 129, and nothing here says which way the next release will go.