Why Is Monday Slow in Forex? What Real Mondays Show
Dylan Forexia6 min read
Why is Monday slow in forex? Mostly because little is scheduled, and the week has not yet found its direction. In our count Monday's median range was 86% of the market's own average day, below Wednesday and Thursday at 97%. But it was not the smallest day, since Tuesday's was 83%, and several real Mondays were far from slow.
This page counts how big Mondays are, shows real Mondays that ran against the idea, and says why a slow Monday does not make Tuesday the real move. Is Friday a bad day to trade forex is the other end of the week, and both sit inside the weekly cycle.
How slow is Monday in forex?
Slower than Wednesday and Thursday, and level with Tuesday. We counted seven majors and gold on 15-minute candles from Monday 6 April to Thursday 1 October 2026: 208 Mondays across eight markets. A day's range is its high to its low, from the 17:00 New York break to the next, so a Monday starts on Sunday at 17:00. Each day is shown as a share of that market's own average day.
| Weekday | Median day | Middle half of days |
|---|---|---|
| Monday | 86% | 64% to 112% |
| Tuesday | 83% | 66% to 104% |
| Wednesday | 97% | 71% to 144% |
| Thursday | 97% | 78% to 128% |
| Friday | 89% | 71% to 113% |
Monday reached the average of the 20 market-days before it on 56 of 176 days, 32%, against 28% for Tuesday and 44% for Wednesday and Thursday. The middle halves of Monday and Tuesday overlap almost completely, so a weekday tells you little about the day in front of you. The count is of ranges, and a bigger range is not a better trade. It also includes the Sunday evening hours, which are thin, so part of what looks slow is only that the day starts before most of the world is at a desk. A Monday measured from the London open would be a different count, and we have not run it.
Why is the first day of the week quiet?
Because the calendar is quiet, as far as this count can see. We split each Monday by whether a high-impact US item fell inside the trading day. Only 32 of the 208 Mondays had one, and those ran at a median of 101% of the market's average day. The other 176 ran at 84%. Wednesday is the opposite, with a US item on 168 of its 208 days, which goes a long way to explaining its place in the table.
That is a count of US items only. Central banks and data from other countries are not separated, so a Monday counted as quiet may still have had a release for another currency. It is also an association and not a cause. What it supports is the plain reading that a day with something scheduled moves more, and Monday so often has nothing.
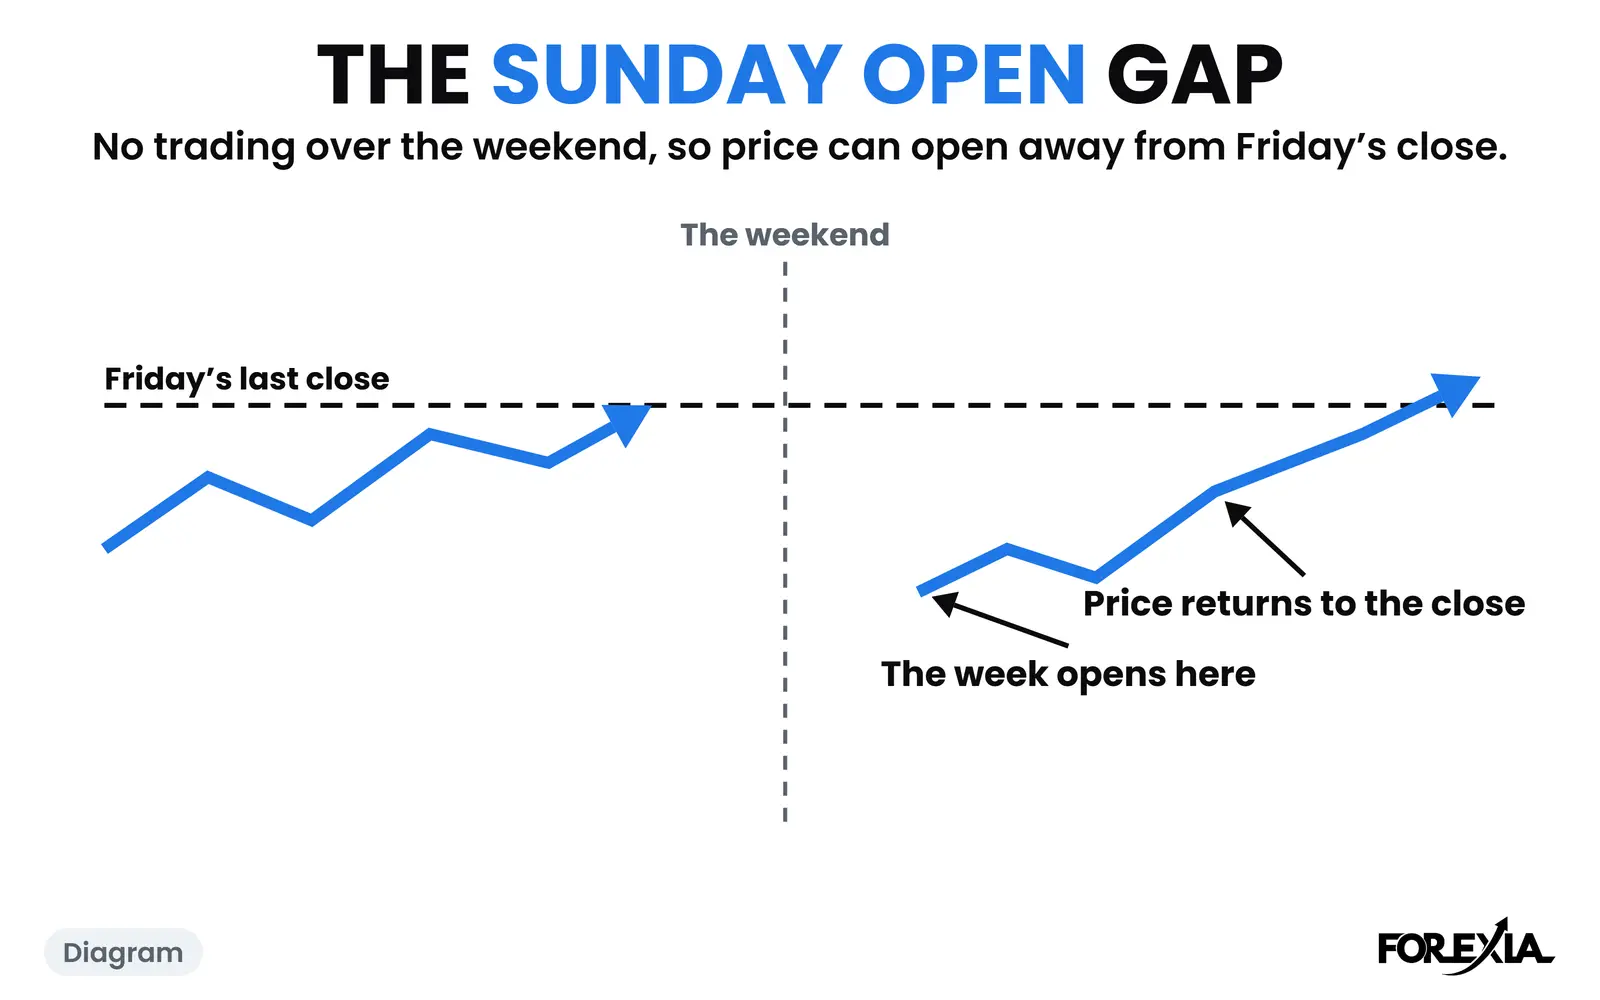
The open adds a second reason to expect a thin start, and the count lets us size it. Over 26 Sundays the median gap between Friday's last price and Sunday's first was between 7.5 and 12.2 pips on the seven majors and 14.6 on gold, and price traded back to Friday's close before London opened on Monday on 147 of 207 Sundays. A small gap and a quick fill are what a quiet start looks like.
Were real Mondays slow?
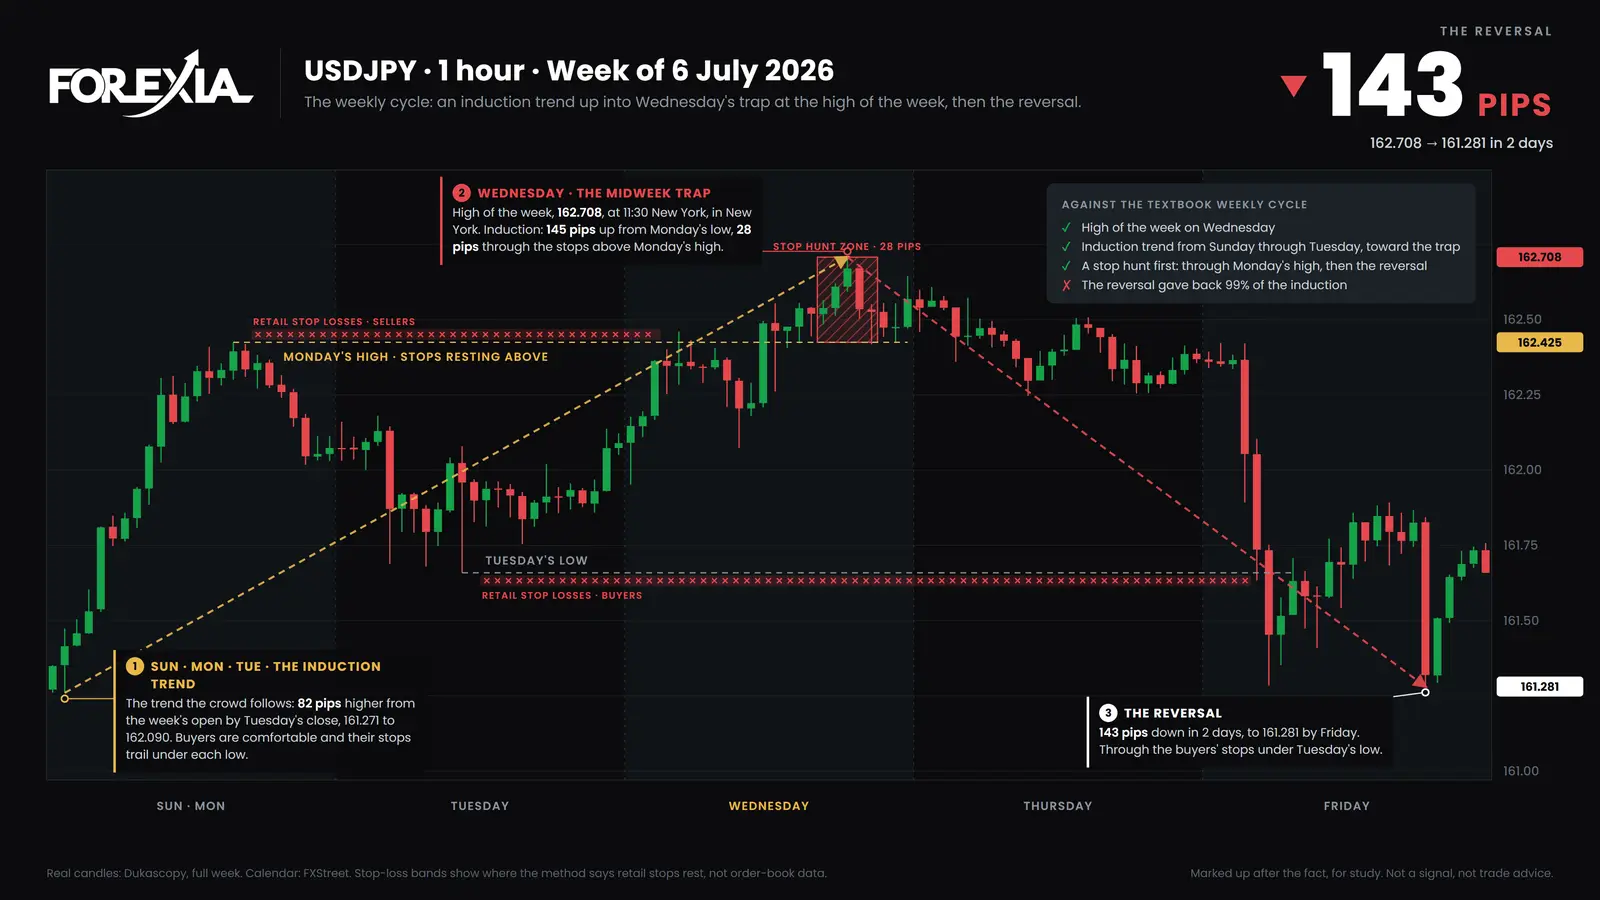
Some were not, and they are the better test of the idea. USD/JPY in the week of 6 July 2026 opened at 161.271 and ran up 80 pips on Monday, with a high of 162.425 at 08:45 New York. Monday's range was 116 pips, against 52 on Tuesday before the hunt and 36 on Thursday after it.
Gold in the week of 11 May 2026 opened at 4681.26 and closed Monday at 4735.19, 54 pips higher, with a high of 4748.48. At 20:15 that night, already in Tuesday's session, it reached 4773.34, the high of the week. EUR/USD in the week of 22 June closed Monday at 1.14270, 33 pips under its open, and AUD/USD in the week of 27 July closed Monday at 0.69885, 9 pips under its open of 0.69975, in a day that ran only 26 pips from 0.69850 to 0.70109. Same weekday, four different sizes.
What did a slow Monday open look like?
A gap that took most of a day to fill. EUR/USD's Friday close on 10 April 2026 was 1.17216 and the week opened at 1.16739, 48 pips lower. Price drifted inside a 31-pip range all through Asia, and London opened on Monday with the gap unfilled. The first candle to trade back to Friday's close was the 12:30 New York candle on Monday, which reached 1.17263, 19 and a half hours after the open, and price went on to 1.17653 at 14:45. Our calendar had an ECB speech at 08:15 and existing home sales at 10:00, both medium impact, and nothing larger.
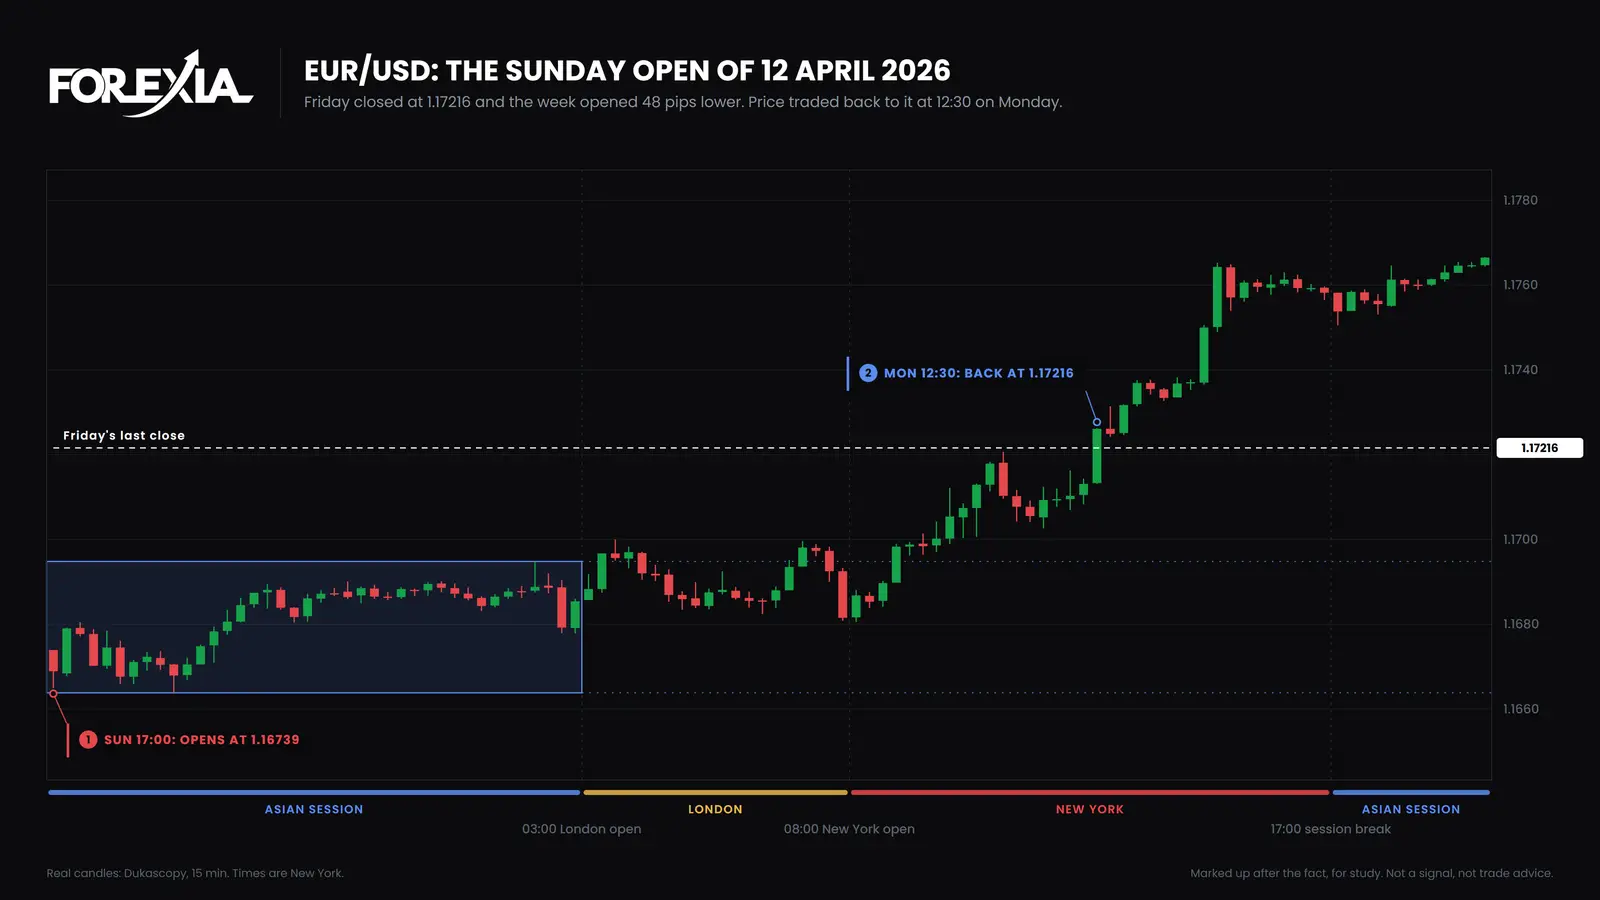
Price was in a 31-pip range through Asia and moved 39 pips from the fill to the high by 14:45. A reading made afterwards makes the fill look inevitable, and at London's open the gap-fill idea had nine and a half hours still to wait.
Does Tuesday set the week after a slow Monday?
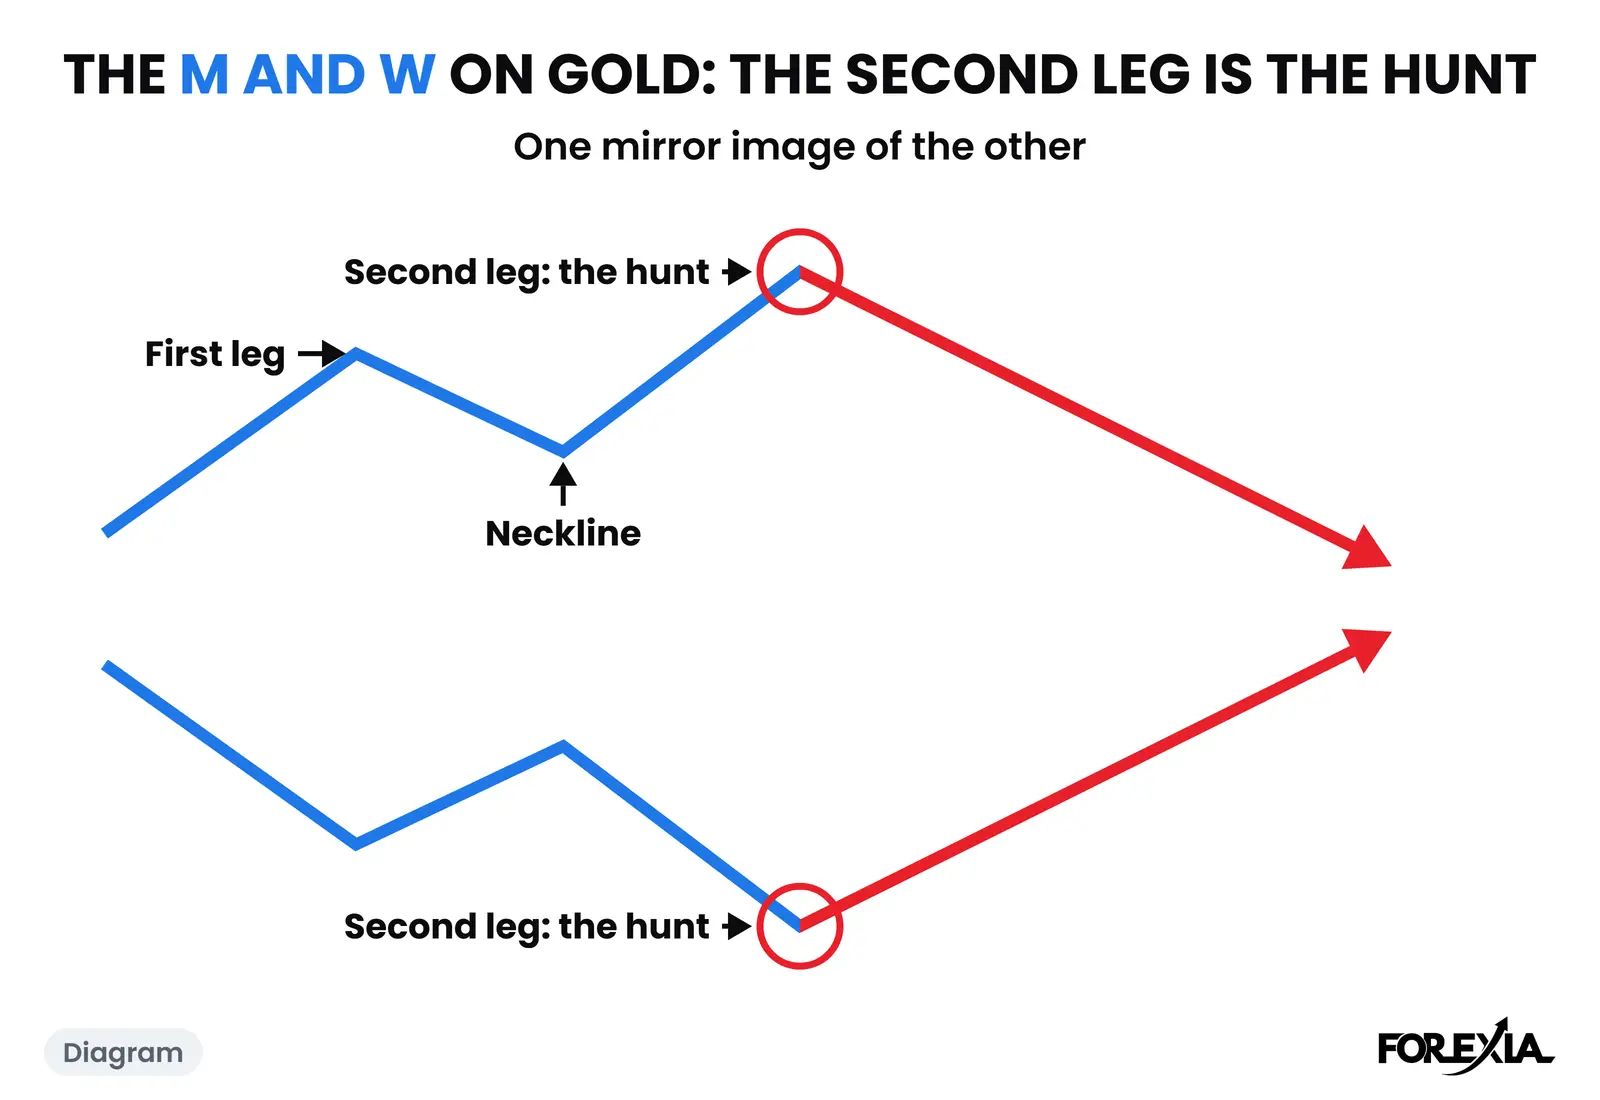
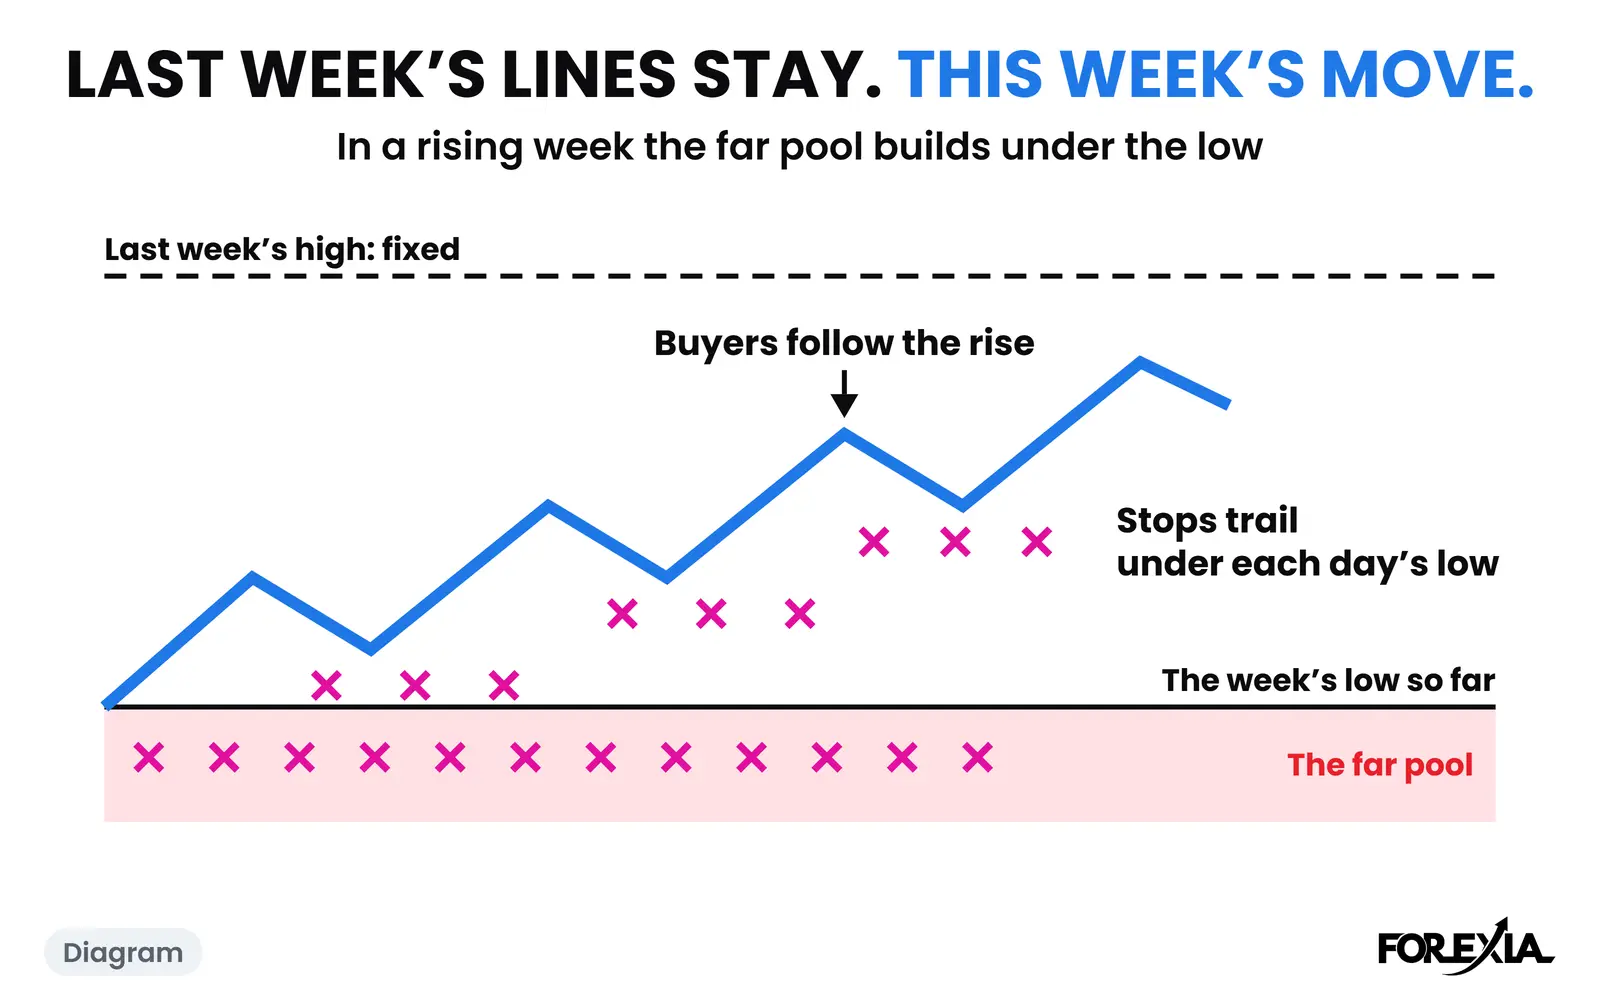
Sometimes, and it is not the bigger day. Tuesday's median range was the smallest of the five days at 83%, which sits badly with "Monday is slow, Tuesday is the real move". On GBP/USD on Tuesday 28 July 2026 price went under Monday's low in London, made the low of the week at 1.32733 and rose 38 pips by 11:45. That is the pattern we call the Tuesday Anchor. On USD/CAD on 4 August, Tuesday stayed over Monday's high and the turn came on Wednesday.
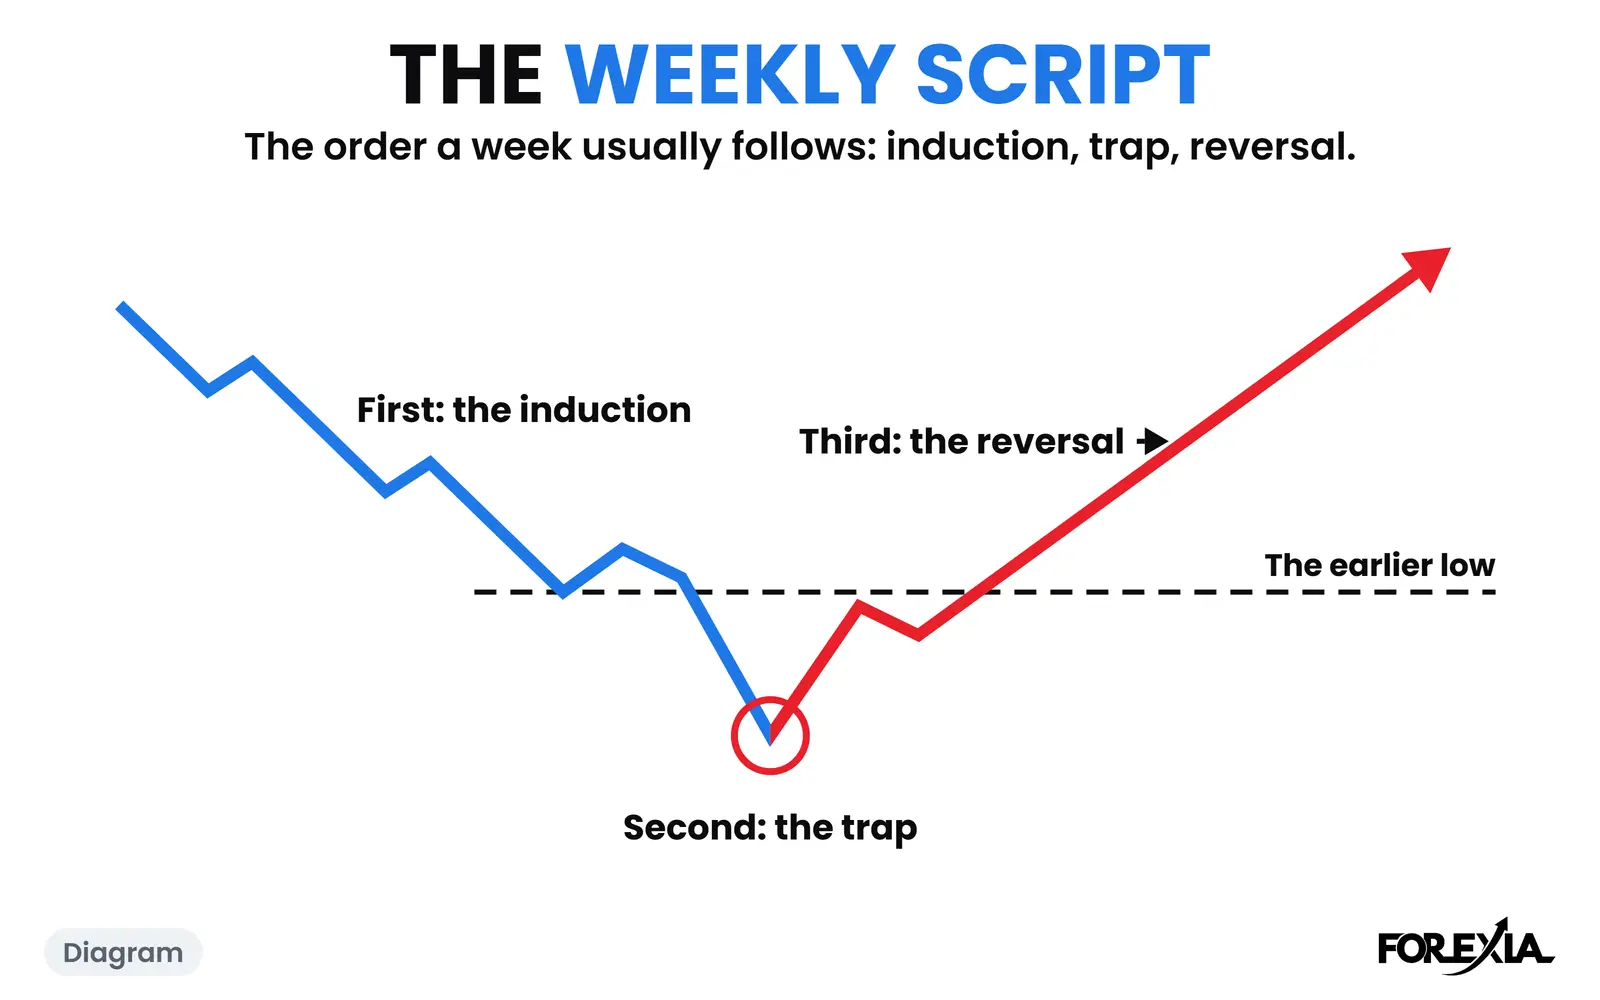
A Tuesday does one useful thing for a slow Monday: it has Monday's high and low to go past, and those are the first levels everyone can see. How to spot the Tuesday Anchor reads that day candle by candle. The Induction Trend is the trend that Monday and Tuesday can build, and a slow Monday only delays it.
What do traders get wrong about Monday?
Three readings cost the most.
- Reading slow as safe. USD/JPY ran 116 pips on its Monday, more than twice Tuesday's 52 before the hunt.
- Reading Monday as the day that sets the week. Mondays set the first levels, not the week's extreme. Tuesday's own median range was smaller.
- Reading a count as a forecast. The sample is 26 weeks of one year on markets that often move on one dollar. A reversal seen afterwards is not a setup, and our own test of the daily setup as a mechanical rule did not make money.
Sources
The counts are from scripts/seo-counts.mjs, on Dukascopy 15-minute candles in New York time, from 6 April to 1 October 2026. The real Mondays are read from our weekly-cycle and Sunday-open chart write-ups. The US calendar is the one our chart markups use.
Course 4 of ForexiaPRO, The Week, in production, teaches how Monday fits into the week.
For study only. This page is not a signal and not trade advice. Charts are Dukascopy candles, marked up after the fact.
Frequently asked questions
Why is Monday slow in forex?
Mostly because little is scheduled. In our count only 32 of 208 Mondays had a high-impact US release, and those days ran at 101% of the market's average day against 84% for the rest. Monday's median day was 86% of the average, so it was below Wednesday and Thursday, but not the smallest.
Is Monday the slowest day in forex?
Not in our count. Monday's median day was 86% of the market's own average and Tuesday's was 83%, and the two are close. The middle half of Mondays and of Tuesdays overlap almost completely.
Does Tuesday set the week after a slow Monday?
Sometimes. GBP/USD on Tuesday 28 July 2026 went under Monday's low and made the low of the week. USD/CAD on 4 August did not turn until Wednesday. Tuesday's median range was the smallest of the five days, so it is not the bigger day.