Prop Firm Challenge: How to Pass One With a Daily Loss Rule
Forexia Academy10 min read
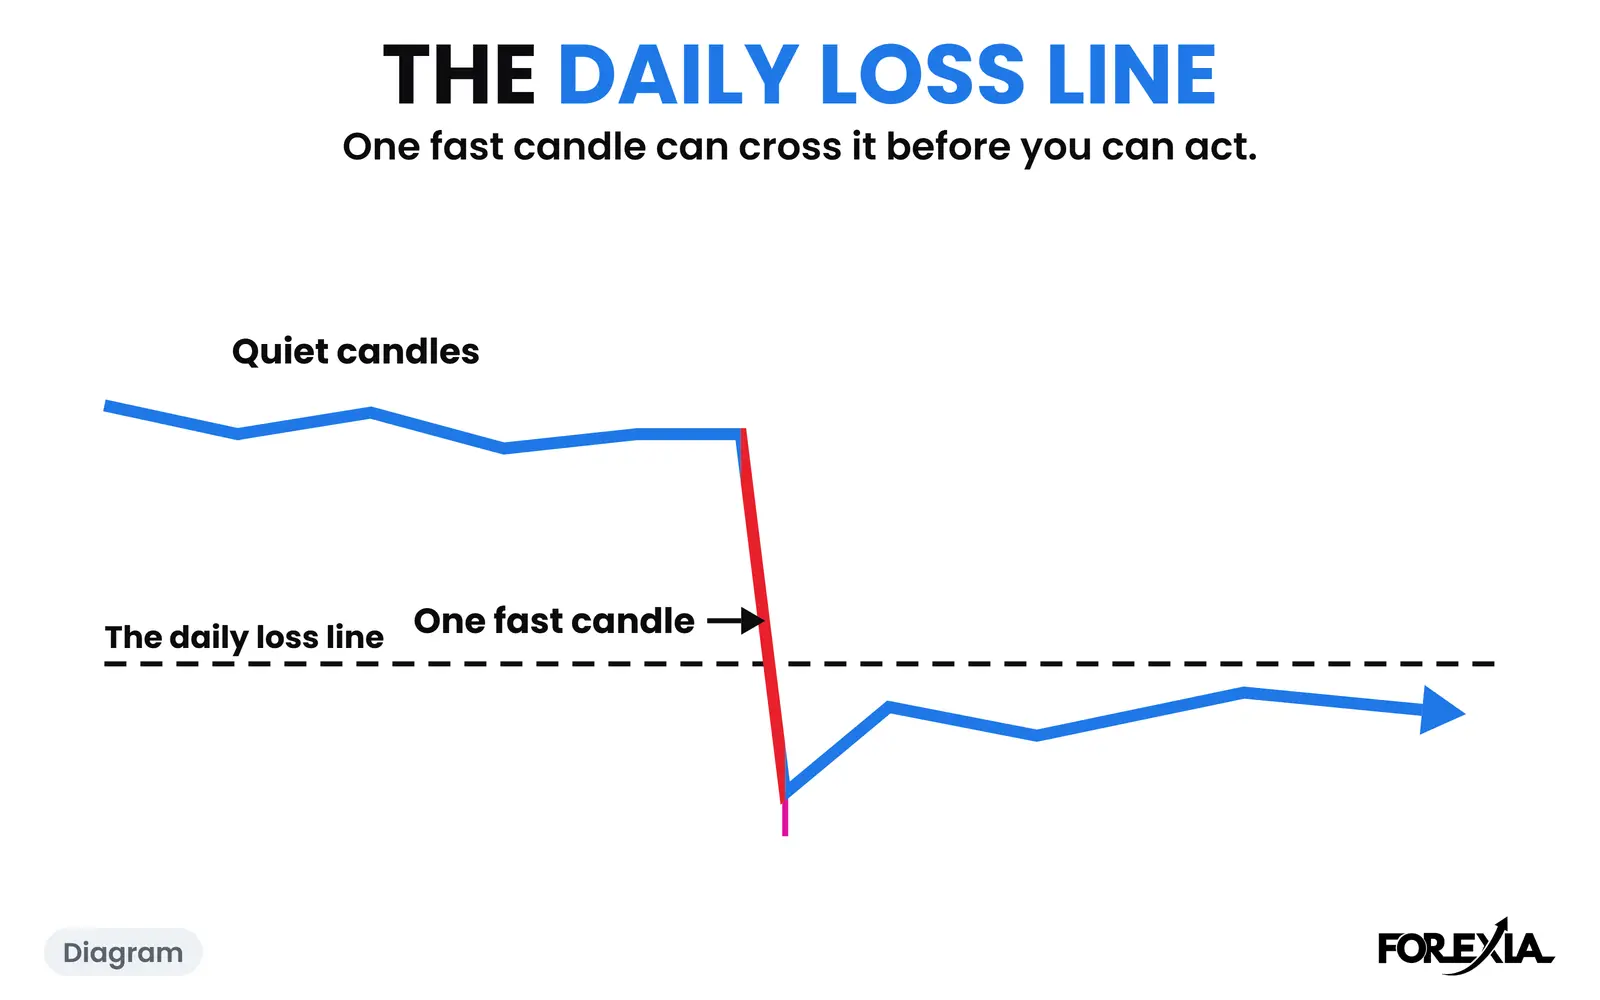
A prop firm challenge is passed by staying under its loss rules first and reaching its profit target second, and the daily loss rule is the one that ends most attempts early. It is a line you can cross in one candle, so the work is sizing every position for the fastest candle you can expect, not for the average one. This guide does the sums and shows two real days, and it promises no pass.
In brief
- The rule: a daily loss limit is a line on the account, and price does not respect your stop's distance to it.
- The sum: risk per trade times the number of losses you can take, plus room for one outsized loss, must fit inside the day's allowance.
- The evidence: one EUR/USD candle on a jobs-report morning ran 73 pips, and one London stop hunt went 37 pips past the Asian high.
- The limit: firm rules differ, we have no data on how challenges end, and nothing here is a signal or advice.
What is a prop firm challenge, and what does it test?
A prop firm challenge is a paid evaluation on a simulated account. You trade it under rules the firm sets, and if you reach a profit target without breaking them, the firm offers you a funded account on its terms. The details differ between firms: the size of the account, the target, the number of phases, the fee and what happens to it.
The rules that end an attempt are almost always loss rules. The two you will meet are a daily loss limit, which caps what the account may lose in one trading day, and a maximum drawdown, which caps the total fall from a high-water mark or the starting balance. The profit target is the same everywhere in one way: it asks you to take risk, and the loss rules punish you for taking too much.
We name no firm here, and nothing below is a claim about any one. Before you size a trade, read three things in your own firm's wording:
- How the day is cut off. Some firms reset at a fixed hour, some at the server's midnight. Know the hour in New York time, because that is where this guide counts.
- What the limit is measured on. Balance, or equity with open profit and loss included. The second can be crossed by a trade that is still open.
- What happens at the limit. A breach may end the attempt, or pause the day. Fees are the firm's to set, so check what is refunded.
How does the daily loss limit actually get hit?
It gets hit in two ways, and traders prepare for only one. The first is the slow way: three or four losing trades in a row, each inside its stop. The second is the fast way: one position that loses far more than its stop's distance because price jumped through it.
For the slow way, the sum is simple. Take a hypothetical account of $50,000 with a 5% daily loss limit, which is $2,500. Risking 1% a trade is $500. Five full losses would reach the line, so a trader who stops after two or three keeps a margin. Those numbers are an illustration. Your firm's may be different, and so may the right amount for you.
For the fast way, the sum needs a real market. A standard lot of EUR/USD (100,000 units) moves about $10 for each pip, which is arithmetic from the contract size and the fourth decimal place. At $10 a pip, 73 pips is $730 on one lot. That is more than the $500 risked on the trade and 29% of the whole $2,500 allowance, in one candle.
The risk-reward and lot-size arithmetic is on its own page: the lot size calculator and the risk-reward calculator do it from the numbers you type.
What does one fast candle look like? EUR/USD, 2 July 2026
On Thursday 2 July 2026 the US jobs report came out at 08:30 New York, a day early because of the holiday. The candle before it, the 08:15, ran from 1.13953 to 1.14013: 6 pips. The 08:30 candle opened at 1.13988, ran down to 1.13986 and up to 1.14717, and closed at 1.14714. That is a range of 73.1 pips in 15 minutes, and 72.9 of them were straight up from the open.
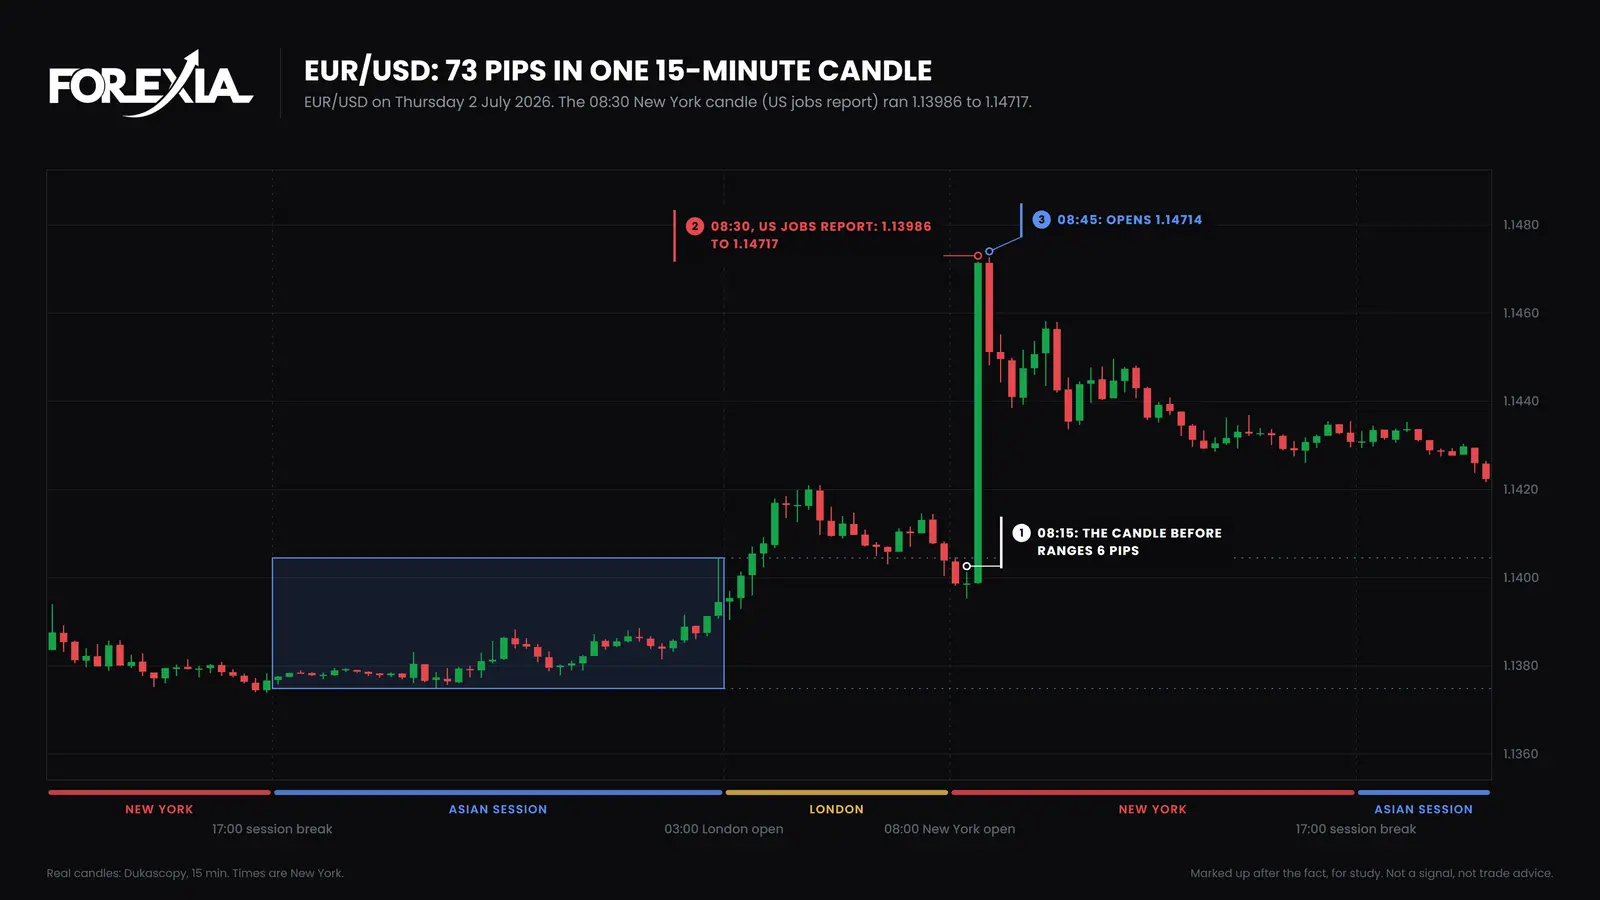
EUR/USD, 15-minute, Thursday 2 July 2026: the 08:15 candle ranged 6.0 pips (1.13953 to 1.14013); the 08:30 candle ranged 73.1 pips (1.13986 to 1.14717) and closed at 1.14714.
- Before the release. The 08:15 candle ranged 6 pips, which is about what an ordinary 08:30 candle does. On the days in our sample with no high-impact US release at 08:30, the median 08:30 candle on EUR/USD ranged 6.7 pips.
- The release candle. It ran 73.1 pips, nearly eleven times that ordinary range. A stop set 10 pips from entry, sized for the quiet candles before, sits inside a move like this.
- What the day did next. The 08:45 candle opened at 1.14714 and fell back to 1.14482. The spike was the whole of the first move and then price came back some of the way. A trader who was stopped out could not know which way the rest would go.
The 2 July candle was the largest of five. On the five jobs-report mornings in our sample, from 8 May to 4 September 2026, the 08:30 candle on EUR/USD had a median range of 41.3 pips, 6.2 times the ordinary median. A count of five mornings is a small sample, and the eight markets we count move largely on one dollar. It tells you what a jobs-report candle can do, not what the next will.
Average NFP move by pair has the five mornings for every market, and NFP spread widening and slippage looks at the single minute inside the candle. For a challenge the point is narrow. Your stop is a request to close at the price you named or the next one available. In a candle like this one, the next one available can be far away.
How far does a stop hunt go past a level? EUR/USD, 13 July 2026
The second way a day goes wrong is a stop that sits at the obvious place. On Monday 13 July 2026 EUR/USD spent the Asian session in a 25-pip range, from 1.13843 to 1.14089. London opened and pushed 37 pips past the top of it, to 1.14457 at 04:15 New York. Price then turned and fell 68 pips to 1.13776.
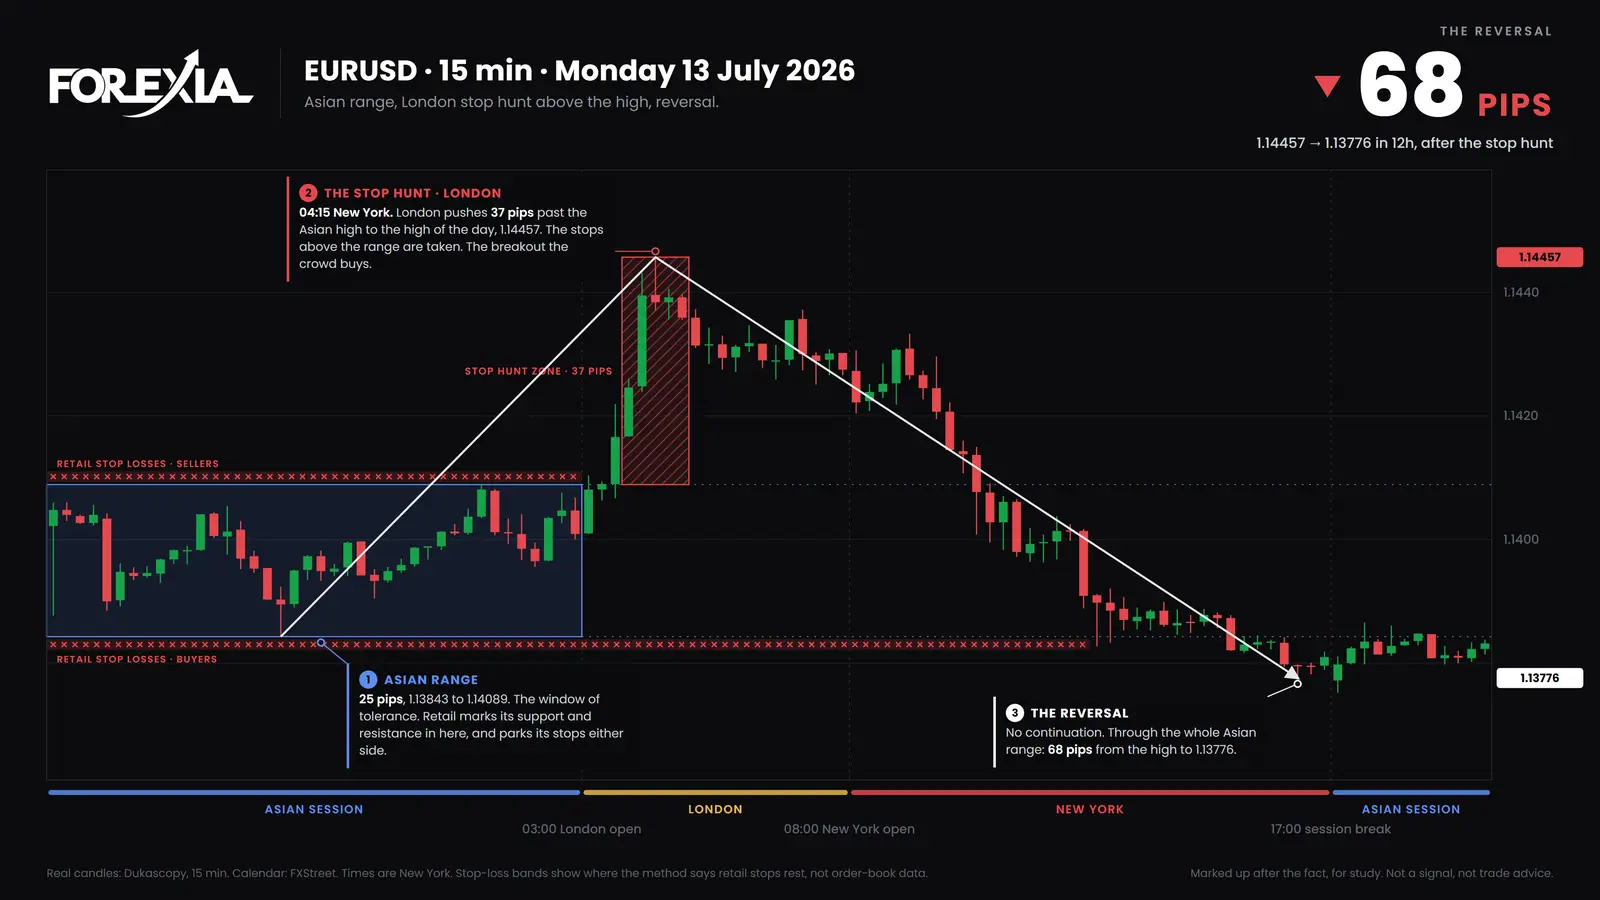
EUR/USD, 15-minute, Monday 13 July 2026: Asian range 1.13843 to 1.14089 (25 pips); high of the push 1.14457 at 04:15 (37 pips past the range); low 1.13776 at 16:15 (68 pips below the high).
- The range. 25 pips from 17:00 New York to the London open at 03:00. We read this as the place where the crowd leaves its stops, above and below.
- The push. 37 pips over the top at 04:15. A stop 10 or 20 pips over the high would have been taken, and so would one 30.
- The turn. Price did not continue. It fell 68 pips from the high, through the whole range.
We read that as a stop hunt: the crowd's orders were the fuel for the turn. That is our reading and not something the chart proves. What the chart does show is that a stop over the high would have been crossed, and that the way the day finished did nothing for it.
How common is a trip that deep? Our count covers EUR/USD between 6 April and 1 October 2026. It took the Asian box edges and the previous day's high and low, and found 218 levels taken by at least 3% of the average daily range. Of them 182 closed back the same day. On those 182 the median trip past the level was 6.5 pips, and the middle half ran from 3.3 to 11.4. The 37 pips on 13 July is far beyond that middle half, and 11.4 pips is already more than a tight stop allows.
This does not tell you where to put a stop. It says that a stop sized to the typical trip will be crossed by the larger ones. A trader who knows that has a reason to size the position down, not to widen the stop to suit the lot.
How should you size trades inside the daily loss rule?
Size from the loss line, not from the profit target. The method below is arithmetic, not a trading rule.
- Write the day's allowance in dollars. The limit times the starting balance. Use the firm's number.
- Decide how many full losses you will take before you stop for the day. Two or three is a common choice. It is your choice.
- Divide the allowance by that number, then by something more. The remainder is room for one loss that is bigger than its stop. The size of the room is yours; the two days above suggest it should be real.
- Turn the dollars into lots from the stop's distance. At $10 a pip for a standard lot on EUR/USD, risking $500 over a 25-pip stop is $20 a pip, or two lots. The lot size calculator does this for any pair.
- Read the calendar and the clock before you hold a position. A scheduled release is where the fast candle on 2 July landed, and the London open is where the 13 July push did. Whether you hold through them is a decision about your allowance, not a rule from us.
The slow way and the fast way ask different things of you. The slow way tests how you behave after a loss, which how to stop revenge trading covers. The fast way tests the size you chose before the candle.
What does this guide not tell you?
It tells you nothing about how likely you are to pass. We hold no data on challenges, pass rates or any firm's rules, and we will not guess at them. Two real days show how big the candles were. They do not say how often a candle that size comes, or that your stop would have been where we describe.
The counts are from eight markets across 6 April to 1 October 2026 on 15-minute candles, with a feed that carries the bid only and no spread. Slippage in a live account is not in them. And our own test of the Asian-range setup as a fixed rule did not make money, so none of this is a method for passing a challenge.
If you trade a challenge, trade it as a risk-sizing problem first. That is the part a chart reading can help with, and the rest depends on the firm.
Where to learn the chart reading behind this
Learning to read where the crowd's stops rest, and where price tends to go to take them, is what the trading psychology hub and the Asian range explain. Course 1 of ForexiaPRO, Reading the Map, teaches that reading step by step. It starts on the ForexiaPRO page.
Sources
- US Bureau of Labor Statistics, Employment Situation release schedule: the 08:30 New York release time of the jobs report.
- Dukascopy 15-minute bid candles for EUR/USD, 2 July and 13 July 2026: every price and pip count above.
- Forexia's counts,
scripts/seo-counts.mjsandcontent-web/seo-map/counts.json(6 April to 1 October 2026): the five jobs-report mornings, the ordinary 08:30 candle and the 182 closed-back levels on EUR/USD.
This page is for study. It is not a signal, not trade advice and not an offer. Forex trading carries a high risk of loss, and a challenge fee can be lost. Charts: candles by Dukascopy, marked up after the fact.
Frequently asked questions
How do you pass a prop firm challenge?
You pass it by meeting the profit target without crossing the firm's loss rules, and the loss rules are the part you control first. Size every trade so that a stop that fails, a gap or one fast candle cannot take the day's allowance. We cannot promise a pass, and we publish no pass rate, because we have no data on challenges.
What is a daily loss limit in a prop firm challenge?
It is the most the account may lose in one trading day, usually stated as a percentage of the starting balance. How the day is cut off, and whether open profit and loss counts, differs from firm to firm, so read your own firm's wording before you size anything.
How much should you risk per trade in a prop firm challenge?
Enough that several losses in a row, and one outsized loss, still leave you under the daily limit. As an illustration only, risking 1% of the balance on a trade leaves room for a few losses under a 5% daily limit. Your firm's numbers may differ, and no figure is advice.
Why do traders fail prop firm challenges?
We have no data on how challenges end, so we do not give a reason as fact. What we can show is how the loss rules meet real candles: a news candle can run six times an ordinary one, and a stop hunt can go far past a level before price turns.