Average NFP Move by Pair: EUR, GBP, JPY and Gold on Five Real Jobs Reports
Dylan Forexia7 min read
The average NFP move by pair, measured on the five jobs reports from 8 May to 4 September 2026: the 08:30 candle ranged a median 41 pips on EUR/USD, 51 on GBP/USD, 74 on USD/JPY and $62 on gold. That is six to ten times an ordinary 08:30 candle. It is five reports, so treat it as a size and not a forecast.
NFP is nonfarm payrolls, the headline of the US Employment Situation report, out at 08:30 New York. All times here are New York, a candle is named by the time it opens, and on gold we count $1 as 1 pip. How the release works is in news trading.
How far does each pair move on NFP? The average NFP move by pair
We measured the 08:30 15-minute candle on seven dollar majors and gold on every NFP morning in our sample, 6 April to 1 October 2026. That is 8 May, 5 June, 2 July (a Thursday), 7 August and 4 September. Three numbers per market, each a median of the five reports, in pips.
| Market | Range, high to low | Open to furthest point | Open to close | An ordinary 08:30 candle | Times an ordinary candle |
|---|---|---|---|---|---|
| EUR/USD | 41.3 | 41.3 | 27.6 | 6.7 | 6.2 |
| GBP/USD | 50.6 | 50.6 | 34.5 | 8.3 | 6.1 |
| USD/JPY | 73.8 | 73.6 | 29.3 | 7.6 | 9.7 |
| USD/CHF | 44.0 | 44.0 | 35.0 | 5.9 | 7.5 |
| AUD/USD | 36.2 | 36.1 | 20.8 | 5.2 | 7.0 |
| USD/CAD | 55.2 | 55.0 | 45.0 | 6.8 | 8.1 |
| NZD/USD | 34.7 | 34.7 | 25.9 | 4.6 | 7.5 |
| Gold | 62.0 | 62.0 | 58.3 | 10.7 | 5.8 |
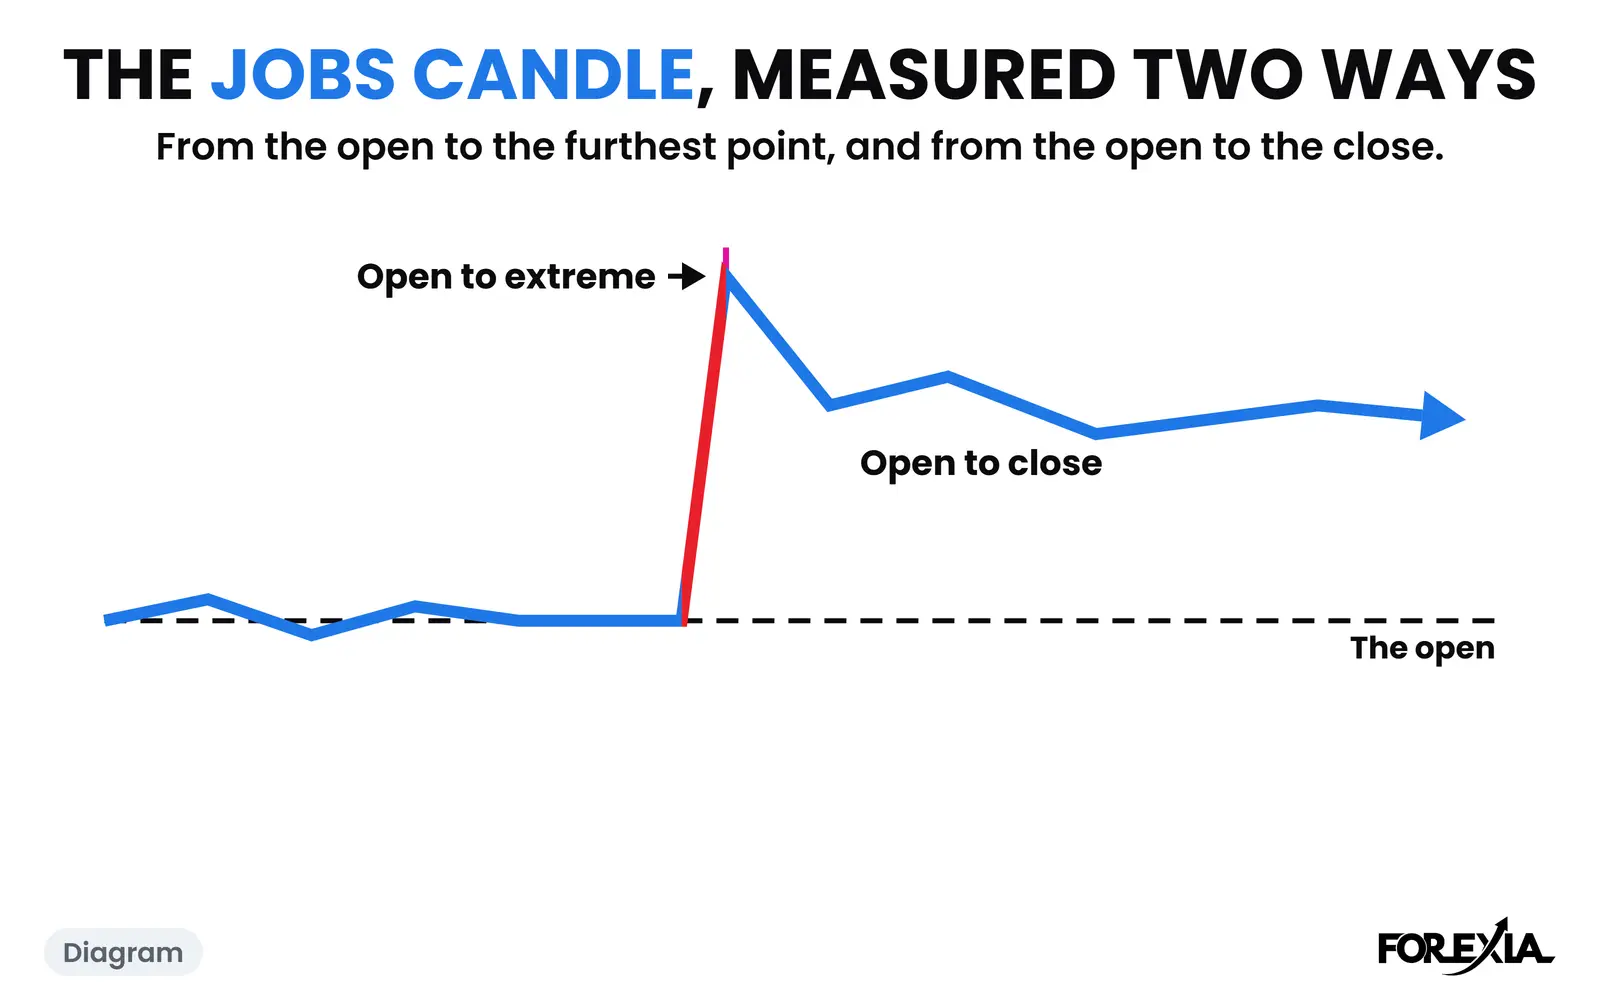
The ordinary candle is the median range of the 08:30 candle on every market-day with no high-impact US item at 08:30, so it is the same time of day with no release. Open to furthest point is the larger of the high minus the open and the open minus the low. Open to close is the size of the candle's body.
The count is newsMoves.nfp830 in scripts/seo-counts.mjs. It stops on Thursday 1 October 2026, and it counts candles, not trades.
What did each report do, one at a time?
The medians hide a pattern in the reports themselves. The same five mornings, the 08:30 candle's range in pips on four of the markets.
| Report | EUR/USD | GBP/USD | USD/JPY | Gold |
|---|---|---|---|---|
| 8 May | 22.5 | 23.0 | 30.8 | 29.0 |
| 5 June | 29.9 | 32.9 | 15.7 | 25.8 |
| 2 July (Thursday) | 73.1 | 78.9 | 91.1 | 76.1 |
| 7 August | 50.2 | 58.1 | 167.3 | 62.0 |
| 4 September | 41.3 | 50.6 | 73.8 | 97.2 |
Read across, the euro, the pound and gold mostly rise and fall together. On 2 July all four were between 73 and 91. On 8 May all four were between 22 and 31. Read down, the report mattered more than the pair. That is what a market that moves on one dollar looks like, and it is why the eight markets are not eight samples.
Two mornings stand out as one market's own. USD/JPY ran 167.3 pips on 7 August, more than double any other market that morning, and gold ran 97.2 on 4 September, which was the largest gold candle of the five. On 5 June the yen's candle was the smallest of the table at 15.7 pips while the other three ran 26 to 33.
Why open to extreme and open to close are different numbers
Open to extreme is how far price went. Open to close is where the candle settled. The first is almost the same as the whole range in every market, because the jobs candle usually opens near one end of its move and runs to the other. The second is smaller, because most candles give some of it back before they close.
On USD/JPY the gap is the widest: a median 73.6 pips to the furthest point and 29.3 to the close. On gold the two are nearly equal, 62.0 and 58.3, so on those mornings gold closed near its furthest point. The average does not tell you which one a given morning will be.
Does an average hide the real size? EUR/USD, 2 July 2026
It does. The five EUR/USD mornings ranged 22.5, 29.9, 73.1, 50.2 and 41.3 pips, a spread of more than three times. The median, 41.3, is the 4 September morning itself. The other four sat 9 to 32 pips from it.
The largest was Thursday 2 July. The 08:30 candle opened at 1.13988, its low was 1.13986 and it closed at 1.14714, 73 pips higher. The Asian Box was 30 pips, topping out at 1.14045, and the candle went through the top of it and through Wednesday's high of 1.14227 as one move. The day's high came on the next candle, 1.14727.
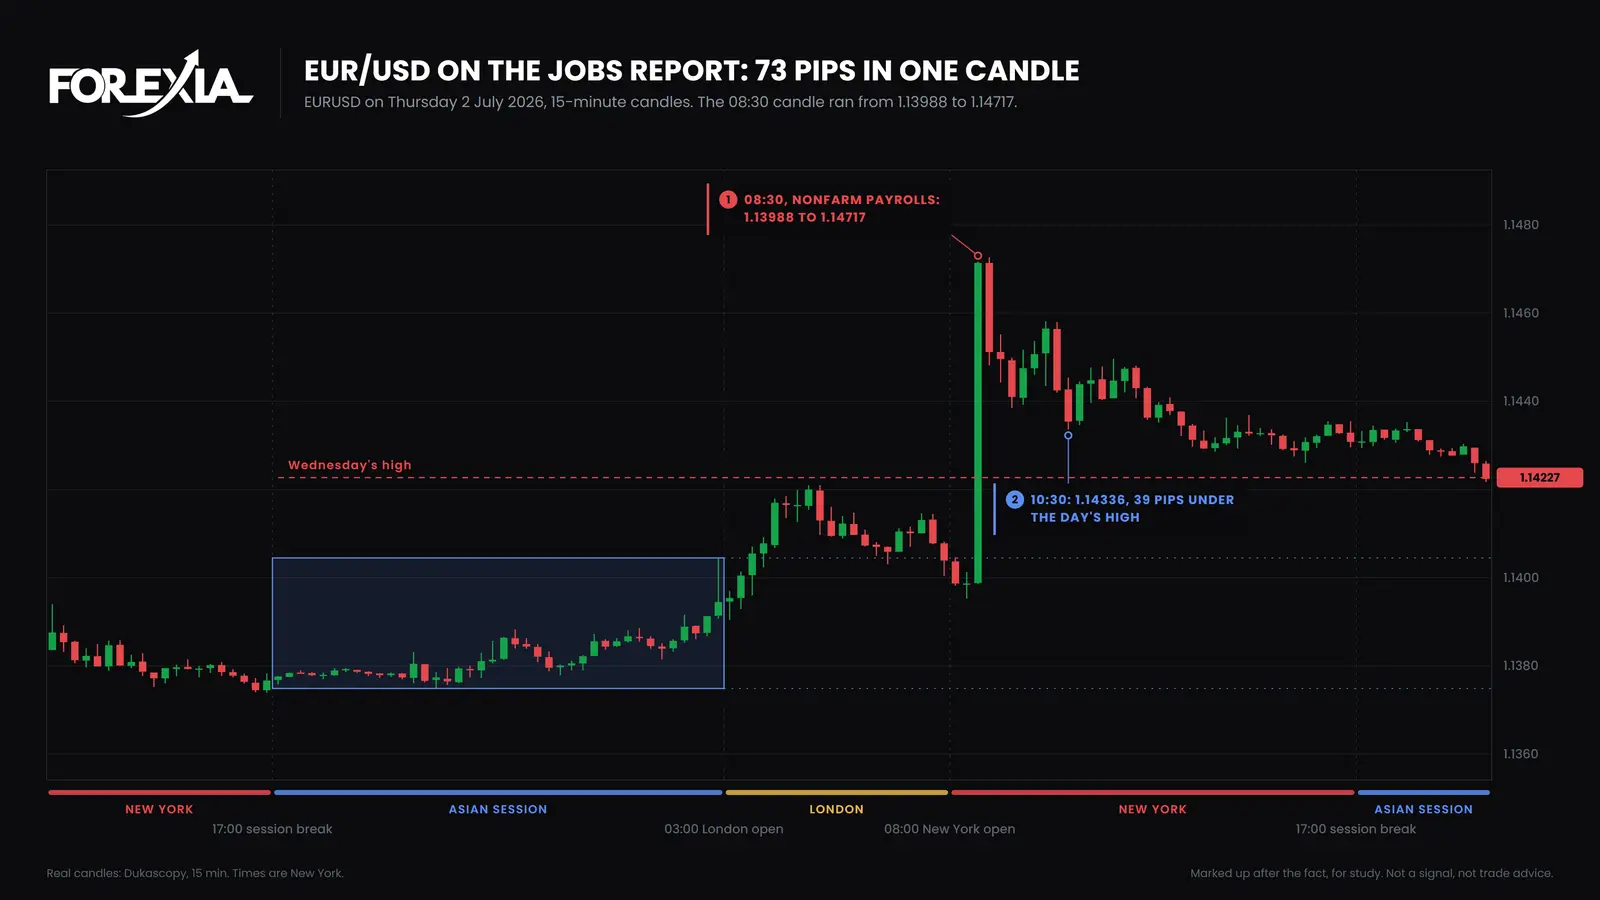
By 10:30 the candle's low was 1.14336, 39 pips under the day's high and still 11 pips over Wednesday's high. No 15-minute candle closed back under that level in the next two and a half hours. Our calendar also has the Fed's Daly speaking at 08:05, but the move came at 08:30.
Is NFP bigger than CPI?
In our sample, yes, on every market. We ran the same measure on the six CPI mornings from 10 April to 11 September 2026.
| Market | NFP, median range | CPI, median range |
|---|---|---|
| EUR/USD | 41.3 | 22.3 |
| GBP/USD | 50.6 | 29.4 |
| USD/JPY | 73.8 | 37.5 |
| Gold | 62.0 | 46.6 |
The other four markets follow the same order. The CPI figures are also from newsMoves, and they are six mornings, so the same warning applies. Reading CPI itself is in how to trade CPI.
How should you use a figure like this?
As a size to respect, not a target. An average of five is a middle value, and the report to report spread on one market was three to eleven times between the smallest and the largest. On USD/JPY it was from 15.7 pips on 5 June to 167.3 on 7 August.
Two habits follow from the table. Do not carry one market's figure to another: the euro's 41 pips and the yen's 74 are different sizes in different units of risk. And do not carry last month's figure forward as this month's, because the 8 May reports were under 31 pips on all four markets above and the 2 July reports were over 73 on all four.
The three seats use it differently. The Three Seats read the candle as retail seeing a number, the market maker seeing a known minute with orders waiting past levels, and the observer seeing a size. We read the size as News-Induced Liquidity: the orders arrive because everyone knows the minute, not because of what the number says. That is our reading, and a chart cannot show whose orders they were.
What does this not tell you?
It does not give a direction. Of the 40 market-mornings in the count, the 08:30 candle held the day's high or low on 12, which the NFP stop hunt takes report by report. It is five reports on one feed, and the eight markets all move on the same dollar, so the figures are not eight independent samples. It is the bid only, and it counts candles. It says nothing about fills: NFP spreads and slippage takes up how much room one minute leaves.
How the central banks compare is in the ECB and Bank of England decision days, which are not part of this count.
Course 2 of ForexiaPRO, The Chaos Pattern, teaches this read step by step in lesson 2.3.3, NFP, CPI, FOMC: One Read, Three Calendars.
Frequently asked questions
How many pips does EUR/USD move on NFP?
On the five jobs reports from 8 May to 4 September 2026, the 08:30 15-minute candle on EUR/USD ranged a median 41.3 pips, from 22.5 on the smallest to 73.1 on the largest. An ordinary 08:30 candle on a day with no high-impact US release ranged a median 6.7 pips. Five reports is a small sample.
How many pips does gold move on NFP?
The 08:30 candle on gold ranged a median $62 on the same five reports, from $26 to $97. On gold we count $1 as 1 pip. Its release candle was about 5.8 times an ordinary 08:30 candle, the smallest multiple of the eight markets we count.
Which pair moves most on NFP?
USD/JPY, by median: 73.8 pips in the 08:30 candle, with a spread from 15.7 to 167.3 across five reports. Measured against its own ordinary morning it was also the largest, at 9.7 times. One report, 7 August 2026, drove most of that.
Is the average NFP move useful to know?
As a size, partly. The five mornings of a single market differed by a factor of three or more, so an average says little about the next one. It says nothing about direction.