Previous Day High Breakout at London Open: Real or Trap? A Count of 422
Dylan Forexia7 min read
A previous day high breakout at the London open looks like a continuation: yesterday's high is a line everyone can see, and a break of it reads as the market going on. Our count says it is as often the opposite. On seven dollar majors and gold, 422 previous-day levels were traded through, and 341 of them closed back the same day.
This page asks whether the break is real or a trap, and what the clock has to do with it. The wider picture is in what the previous day's high and low are. The same level is the third condition of the #SignatureTrade, and here it stands alone.
What is a previous day high breakout at the London open?
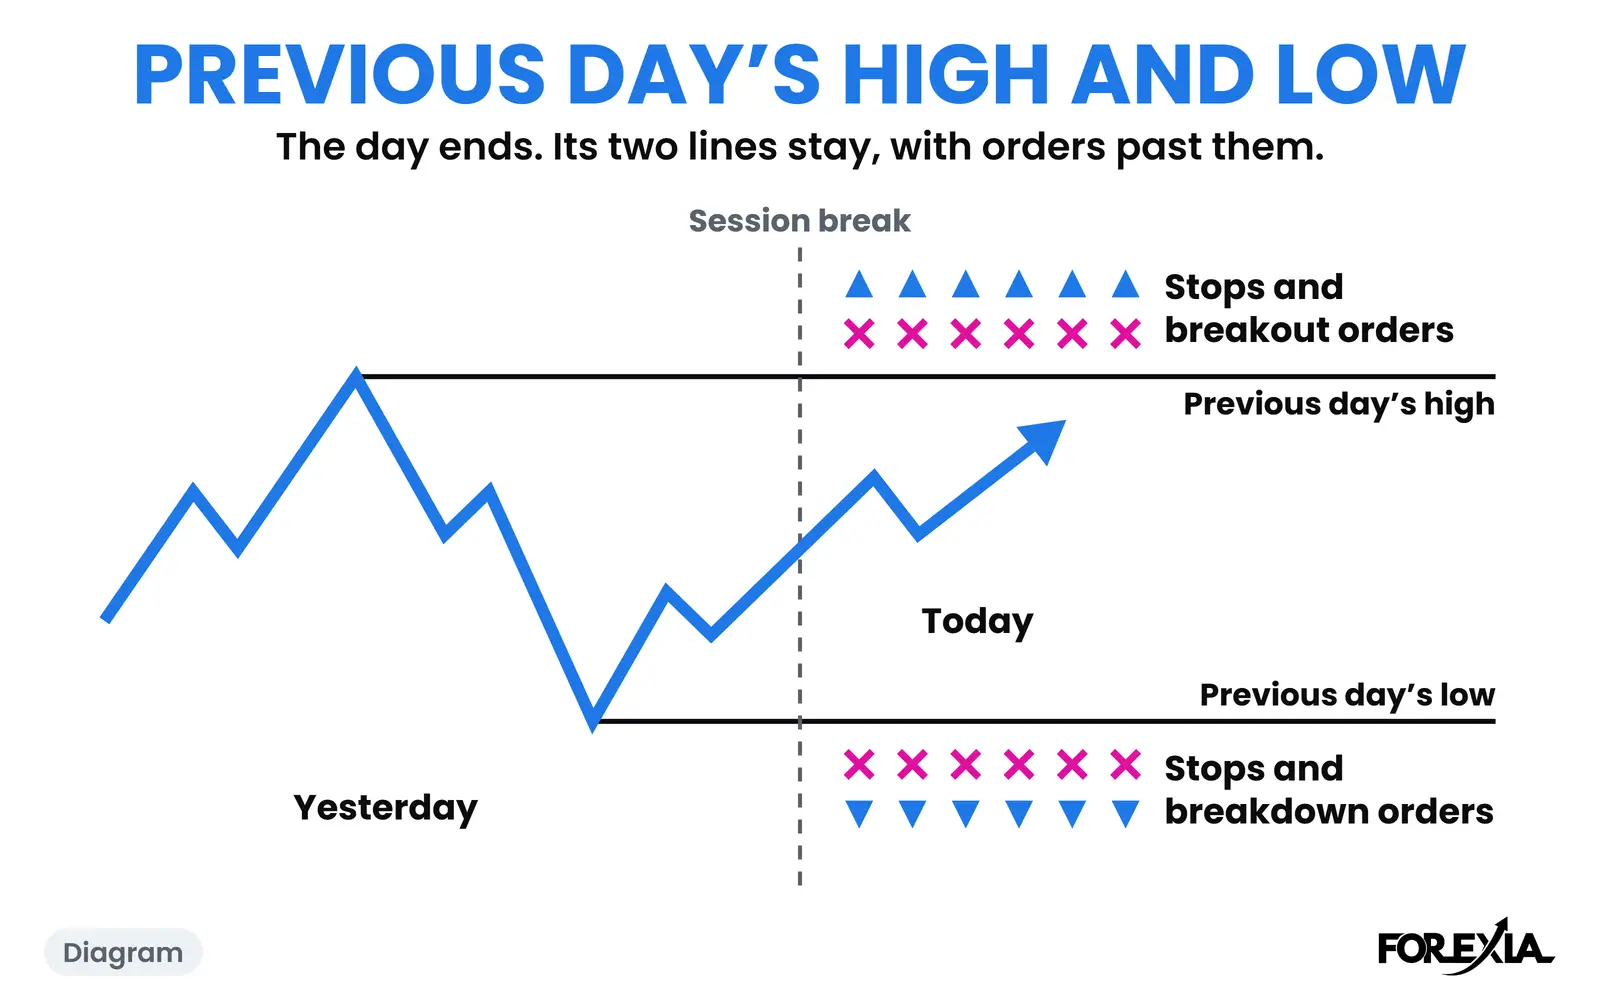
It is price trading past the high of the last completed trading day, in the hours when London is open. We run the day from the 17:00 New York session break to the next one, so on a Monday the previous day is Friday.
Above that line sit two kinds of order, and both are buys. There are the stops of everyone who sold the high, and there are the entries of everyone waiting to buy the break. That is why the line is a pool, and why a fast candle through it fills a lot at once. Whether the market then goes on or turns is what the count measures.
How often is a previous day high breakout a trap?
We counted every time a previous day's high or low was traded through by at least 3% of the average daily range, from the London open to 17:00 New York, on seven dollar majors and gold from 6 April to 1 October 2026. A level Asia had already passed is left out.
| First close back | Levels |
|---|---|
| On the same candle | 118 |
| Within the next hour | 146 |
| Later that day | 77 |
| None by 17:00 | 81 |
| Total | 422 |
341 of the 422 closed back, 81%. After 205 of those, price went past that wick again the same day. The median trip past the line was about a tenth of an average day when it closed back, and about two thirds when it did not. So the trap and the real break are both there. The 81 without a close back are the real ones, and they look the same as the rest until the day ends. This counts candles, not trades, with no entry, stop or cost.
Does it matter when in the day the level is taken?
A little, and not the way the clock suggests. We split the same 422 by when the first candle through the level opened.
| When it was first taken | Taken | Closed back the same day |
|---|---|---|
| The 90 minutes after the London open | 59 | 47 |
| The window around the New York open, 06:30 to 09:15 | 117 | 99 |
| Outside both | 246 | 195 |
Two in five came inside a window around an open, and three in five outside. The share that closed back is close to the same in each row, 47 of 59, 99 of 117 and 195 of 246. The count starts at the London open, so the hour and a half before it is not counted. A candle through the level at the open is not more likely to turn than one at another hour on this evidence. The Window of Opportunity says when to look, never what to do.
What does the trap look like on a real day?
EUR/USD on Monday 21 September 2026. Friday's high, 1.14918, sat 6 pips over the Asian Box. Above it we read Friday's sellers' stops and the entries of those waiting to buy the break. The 08:00 New York candle reached 1.14957, 4 pips through, and closed at 1.14885, back under it. No 15-minute candle closed over Friday's high all day, and by 14:30 price was at 1.14619, 34 pips off the top.
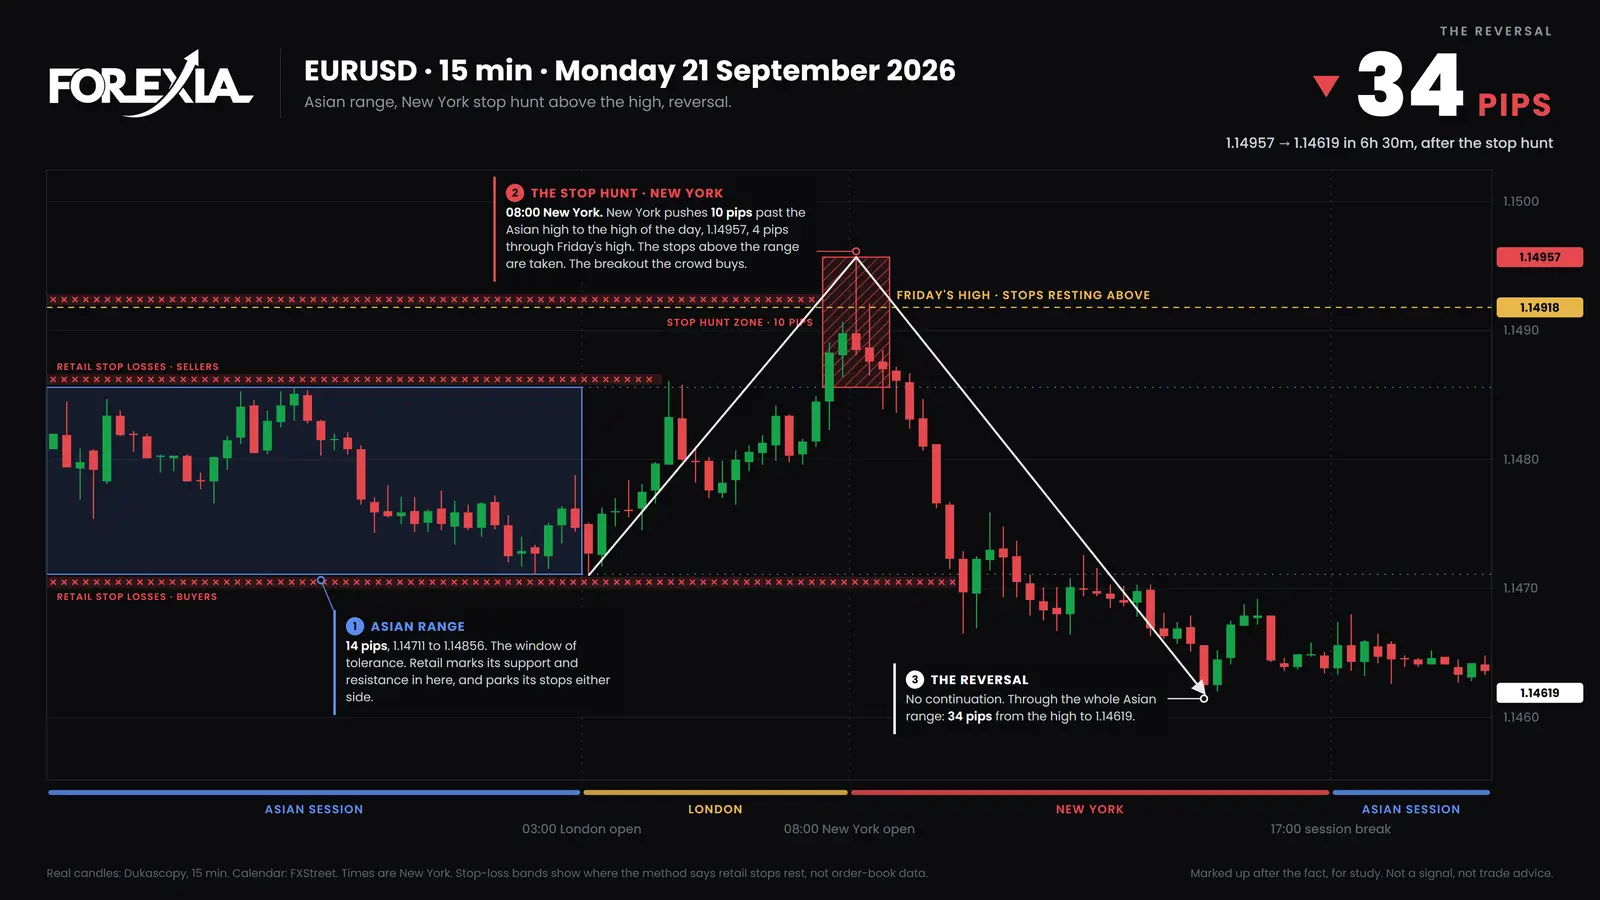
That is one of the 118 that closed back on the same candle. It is a picked day, so it proves nothing alone. A reversal seen afterwards is not a setup.
What does a close back that takes its time look like?
On USD/JPY on Monday 28 September, Friday's low was 156.938. This is a low and not a high, and it is the mirror of the same thing. The 04:00 candle closed at 156.697, 24 pips under it: a close beyond, and the crowd sees a break. The 04:15 candle reached 156.506, 43 pips under, and that candle and the next two also closed under the line. The 05:00 candle closed at 156.991, back above, and by 11:00 price was at 157.583, 108 pips off the low.
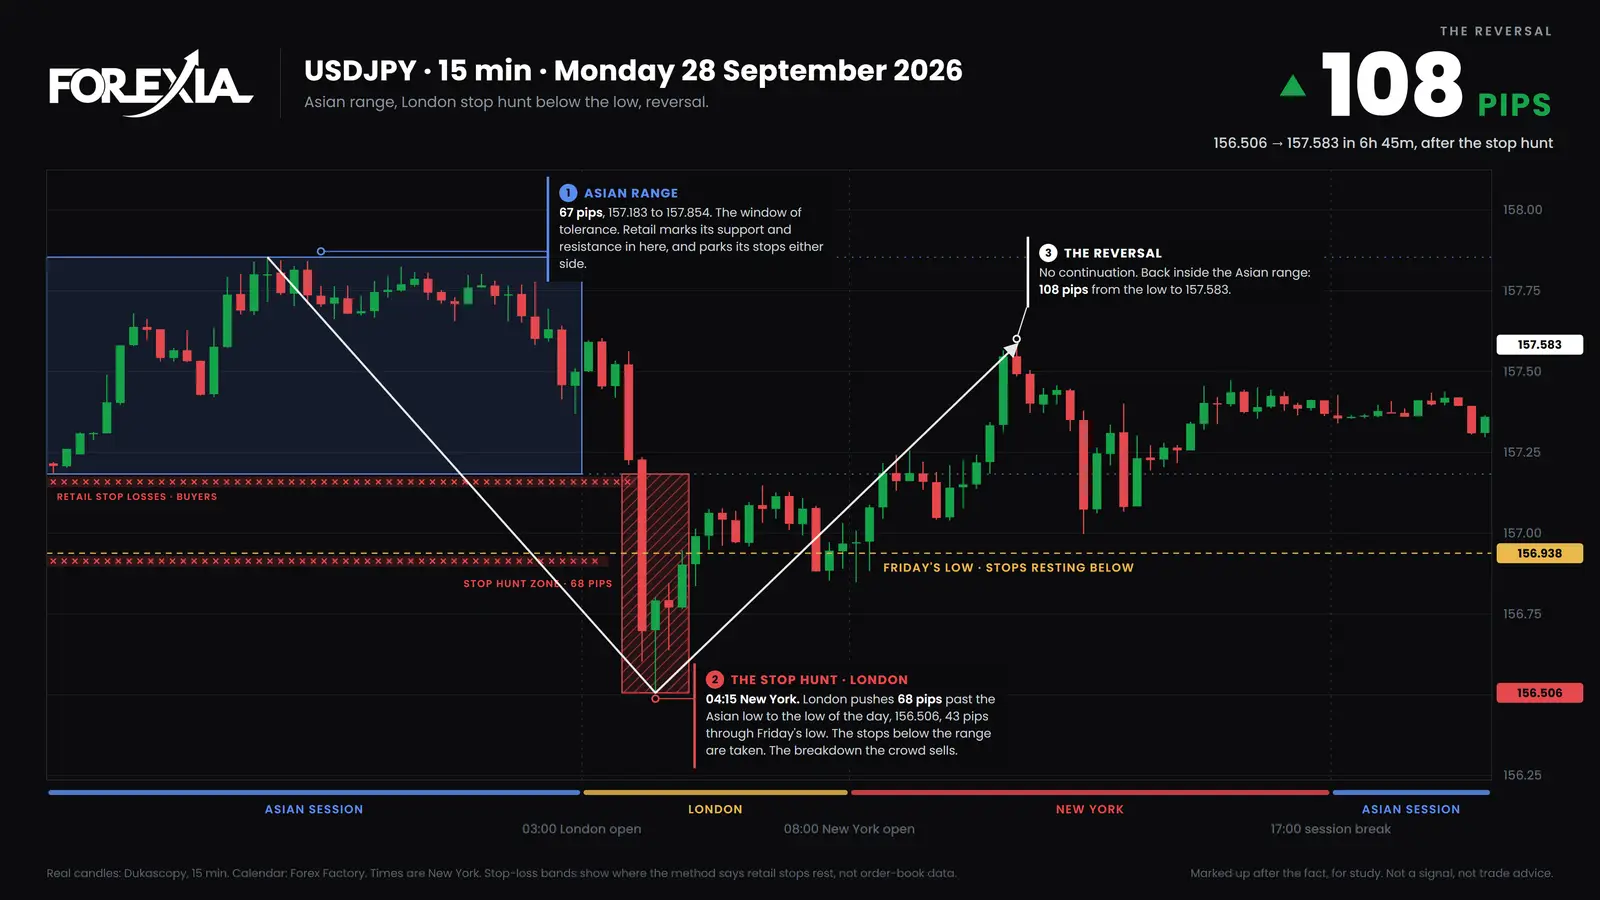
For an hour the break looked real. A trader who called it on the first close beyond would have called it wrong.
What does a real break look like?
On AUD/USD on Thursday 10 September, Wednesday's low was 0.72095. The 05:30 candle closed under it, the 05:45 candle closed back at 0.72110, and the 06:00 candle closed under at 0.72064. No candle closed back after that. By 08:30 on Friday price was at 0.71496, 60 pips under the line. There was no reversal to mark up.
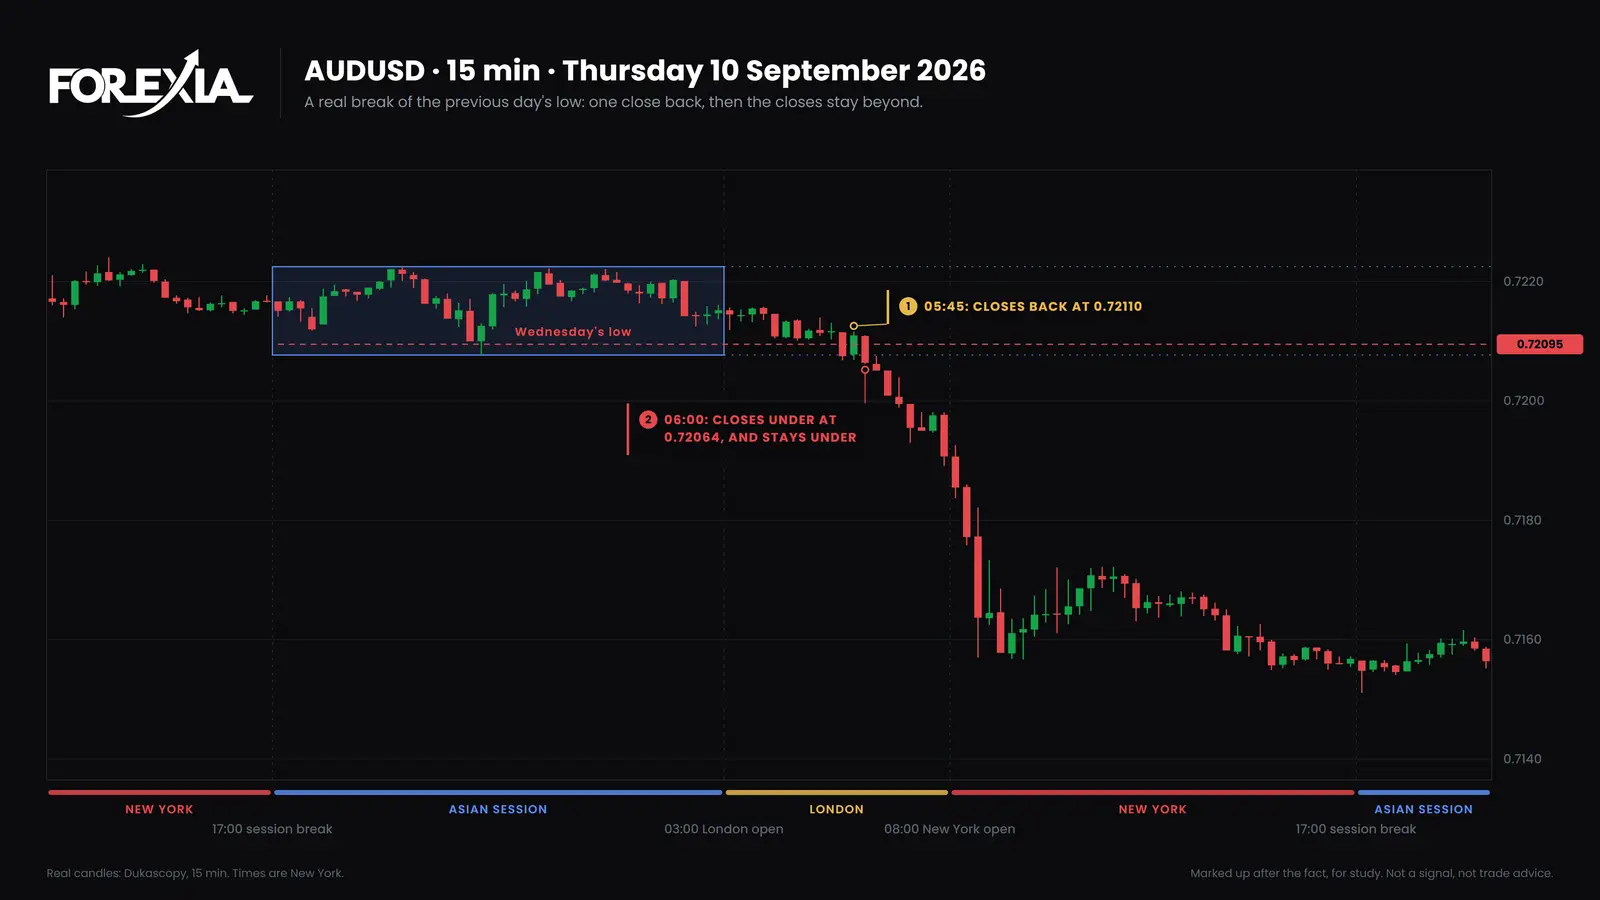
Some breaks are real, and one close back does not rule that out. We have no dated chart of a real break of a high on the site yet, so this one is a low.
How is this different from the London breakout?
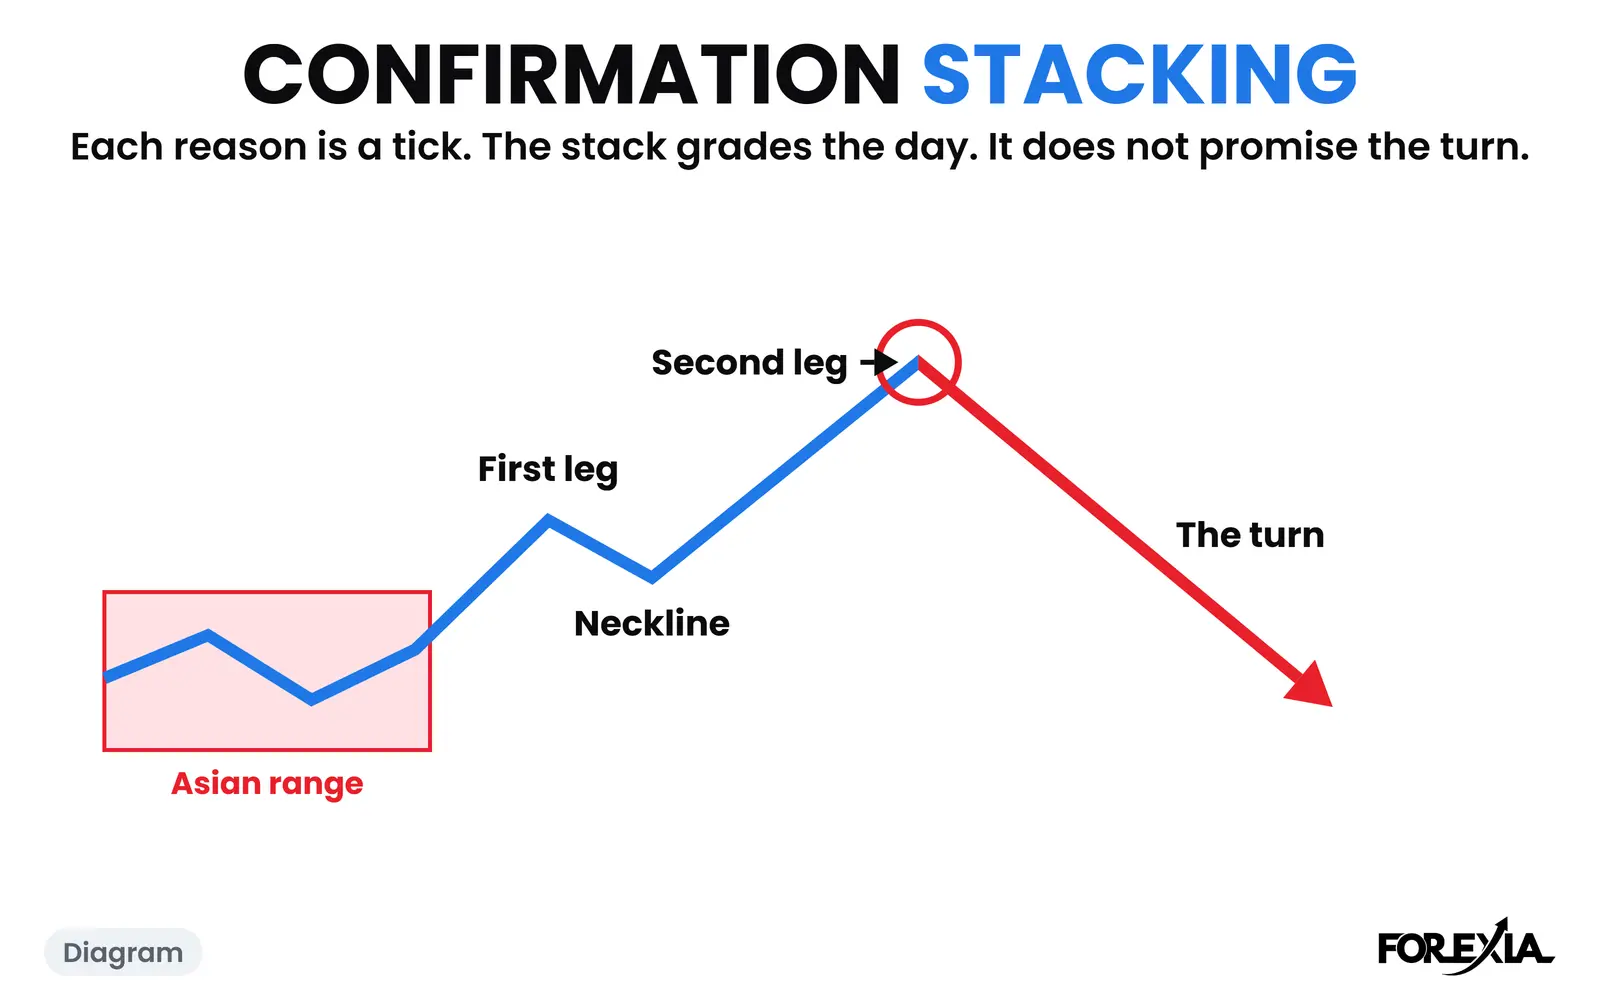
The London breakout is the move out of the Asian Box at the London open. A previous day high breakout is a break of yesterday's extreme, and that line can sit above the Asian range, inside it or well away from it. On some mornings the two are the same candle, and on others they are hours apart. In our sample London closed outside the Asian Box on 745 of 1,030 market-days, and the counts for that break are on the London Breakout page. We keep the two apart because a break of the box and a break of yesterday's high have different stops under them.
What should a reader take from the counts?
Three things, and none of them is a rule.
- The break is usually followed by a close back, and not always. 341 of 422 closed back. 81 did not.
- The clock does not decide it. The share that closed back was close to the same in the London window, the New York window and outside both.
- A first close beyond the line proves little. The yen's first close beyond came at 04:00, and the close back at 05:00.
Who is on each side of the level?
The retail seat buys the break, or sold the high and has a stop above it. The market maker's seat sees both as orders resting at one price. The observer's seat, ours, waits to see whether a candle closes back inside, and describes it afterwards. We read a quick close back as the stops being used. That is a reading, not an observation of anyone's orders. Why does the London breakout fail has the Asian Box version.
What does our own test say?
We tested the setup as a mechanical rule, with fixed conditions, and it did not make money. A close back after a break of the previous day's high is not a setup, and the 81 levels that did not close back are the reason. The figures and limits are in the backtest.
Course 5 of ForexiaPRO, The #SignatureTrade, teaches how this level fits the setup, in lesson 5.1.3. It is on ForexiaPRO.
Frequently asked questions
Is a previous day high breakout at the London open real or a trap?
Either, and a chart cannot tell you at the time. On seven dollar majors and gold from 6 April to 1 October 2026, a previous day's high or low was traded through by at least 3% of the average daily range 422 times. 341 closed back the same day, and on 81 nothing had closed back by 17:00 New York. Those 81 ran a median of about two thirds of an average day past the level.
Does the previous day high break at the London open or later?
Mostly later. Of the 422, 59 were first taken in the 90 minutes after the London open and 117 in the window around the New York open. 246 came outside both. So about two in five came in a window around an open, and the clock alone is not the condition.
How is this different from the London breakout?
The London breakout is the move out of the Asian range at the London open. A previous day high breakout is a break of yesterday's extreme, which can be above, inside or outside the Asian range. They overlap on some mornings and not on others, and the London breakout's own counts stay on its page.