Forex News Manipulation? We Counted the 8:30 Candle on 30 Release Mornings
Dylan Forexia8 min read
Forex news manipulation is the claim that someone moves price on purpose around an economic release. Part of the picture can be shown, and the motive cannot. We counted: the 08:30 candle held the day's high or low on 43 of 240 market-days with a high-impact US release, and on 14 of 790 without one. That shows the minute matters. It does not show who was behind it.
Our name for the orders a release brings in is News-Induced Liquidity. It is a read of when, and it is no accusation against anyone. This page sets out the evidence on both sides, including the part that goes against us.
Is forex news manipulation real?
Manipulation in forex is documented. Manipulation of the release minute is not, and those two claims get mixed up all the time.
In November 2014 the UK's Financial Conduct Authority fined five banks and said traders "attempted to manipulate fix rates and trigger client 'stop loss' orders", in a period running from January 2008 to October 2013. The same day the CFTC ordered five banks to pay over $1.4 billion for attempted manipulation of FX benchmarks. The stop hunt guide covers what those findings mean for your stop.
Look at what they cover. The FCA's concerns fix rates and client stop-loss orders and the CFTC's FX benchmarks, among particular traders, in particular years. Neither page mentions an economic release. So traders going after stops is on the record. Traders aiming the 08:30 candle at stops is a separate claim, and we know of no regulator's finding that says so. Saying "the banks were fined, so NFP is rigged" jumps from one to the other.
What we counted
We asked one narrow question: does the candle a release lands on hold an end of the day more often than an ordinary candle?
We took seven majors and gold on 15-minute Dukascopy candles, from 6 April to 1 October 2026, which is 25 whole weeks and four days. Those weeks hold 30 mornings with a high-impact US item at 08:30 on our calendar: the jobs report, CPI, producer prices, retail sales, core PCE or GDP. A candle holds when its high is the day's high or its low the day's low, with the day running session break to session break and leaving out the spread spike on its first candle.
With a release it held on 43 of 240 market-days, 18 at the high and 25 at the low. Without one it held on 14 of 790. That is about ten times as often, and it still did not hold on 197 of the 240.
Report by report it is lumpy. The jobs report held on 12 of 40, half of them on one Friday. The Fed's decision at 14:00 held on 5 of 32, all on one day. So the answer to "does FOMC affect forex" is yes, and On FOMC shows how unevenly; On NFP does the same for the jobs report. The news trading guide has the full table.
The limits belong beside the figure. Thirty mornings is a small sample, on one feed, and eight markets moving on one dollar are not independent. It is a count of candles and not a strategy. It says when to look, never which way.
Does the count prove manipulation?
No, and here is why it cannot.
Suppose nobody aims anything. A release candle is often several times the size of the candles around it, and a far larger candle is more likely to reach further than anything else that day, by size alone. So it would hold the day more often than a quiet candle, with no one behind it.
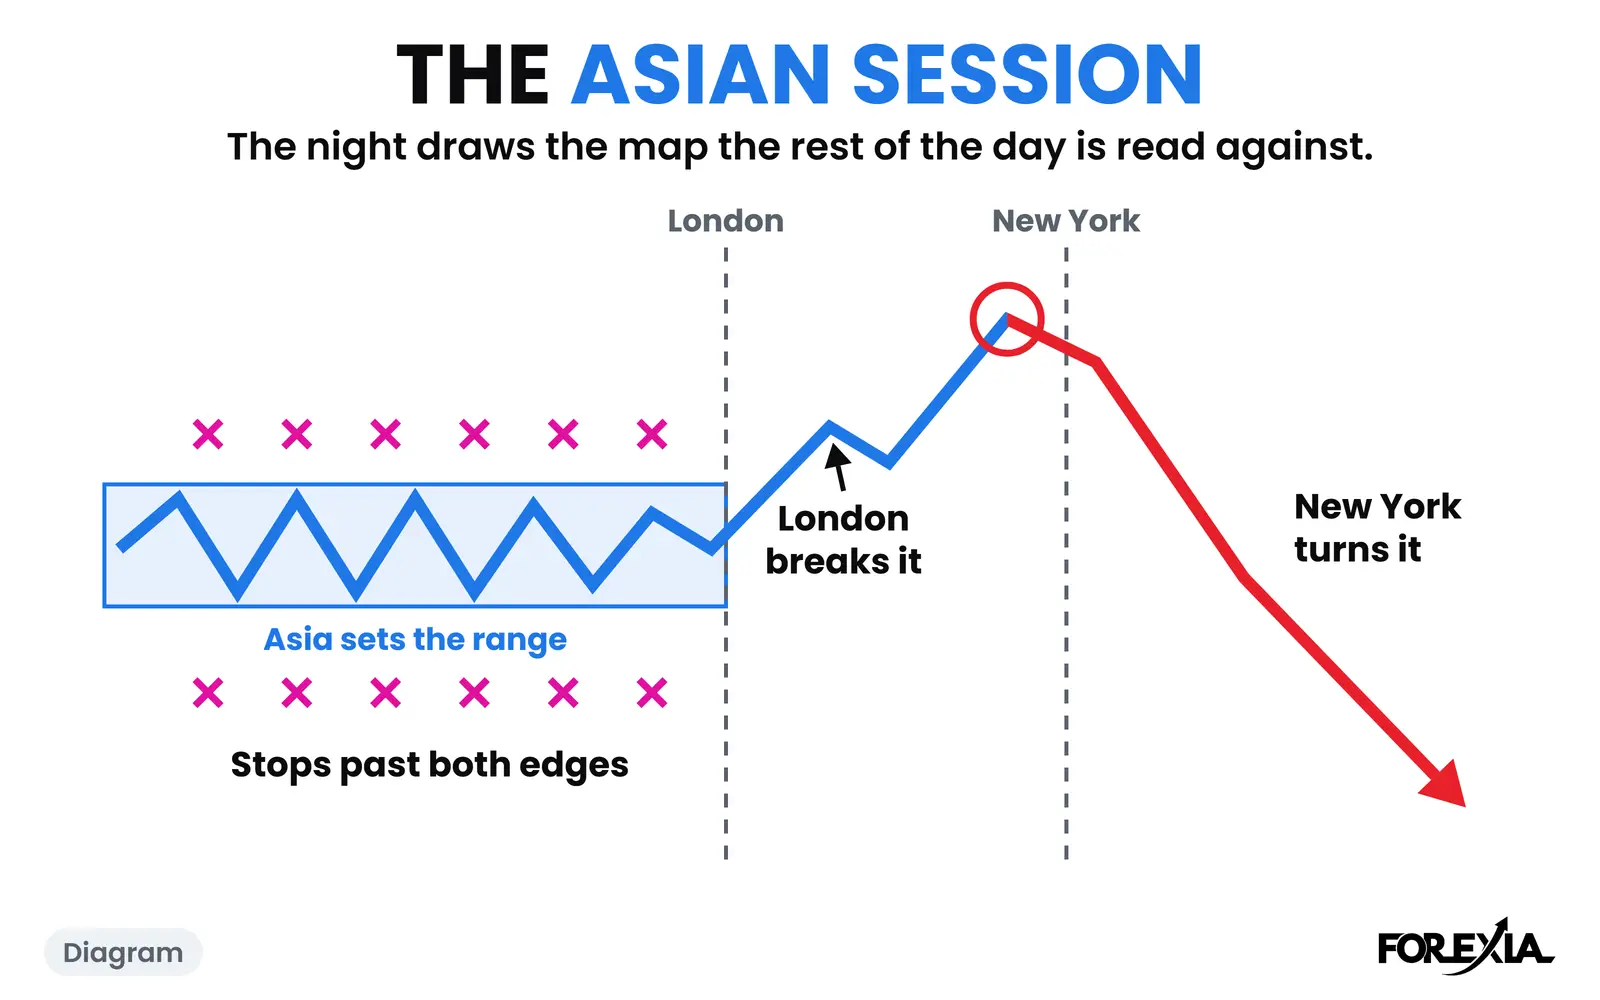
Now suppose market makers do use the minute, which is our read. The candle runs to the stops, the stops fill the other side, and the turn can come inside that candle. It would also hold the day more often than a quiet candle.
Both stories predict the same figure. We have not separated them, and we do not know a way to do so from candles. What the count can rule out is the loud version, in which every release is a scripted trap. On most release market-days the candle held neither end. Holding is not the only form a hunt can take, but a script that ran every time would look different from this.
A morning it held: gold, 30 September 2026
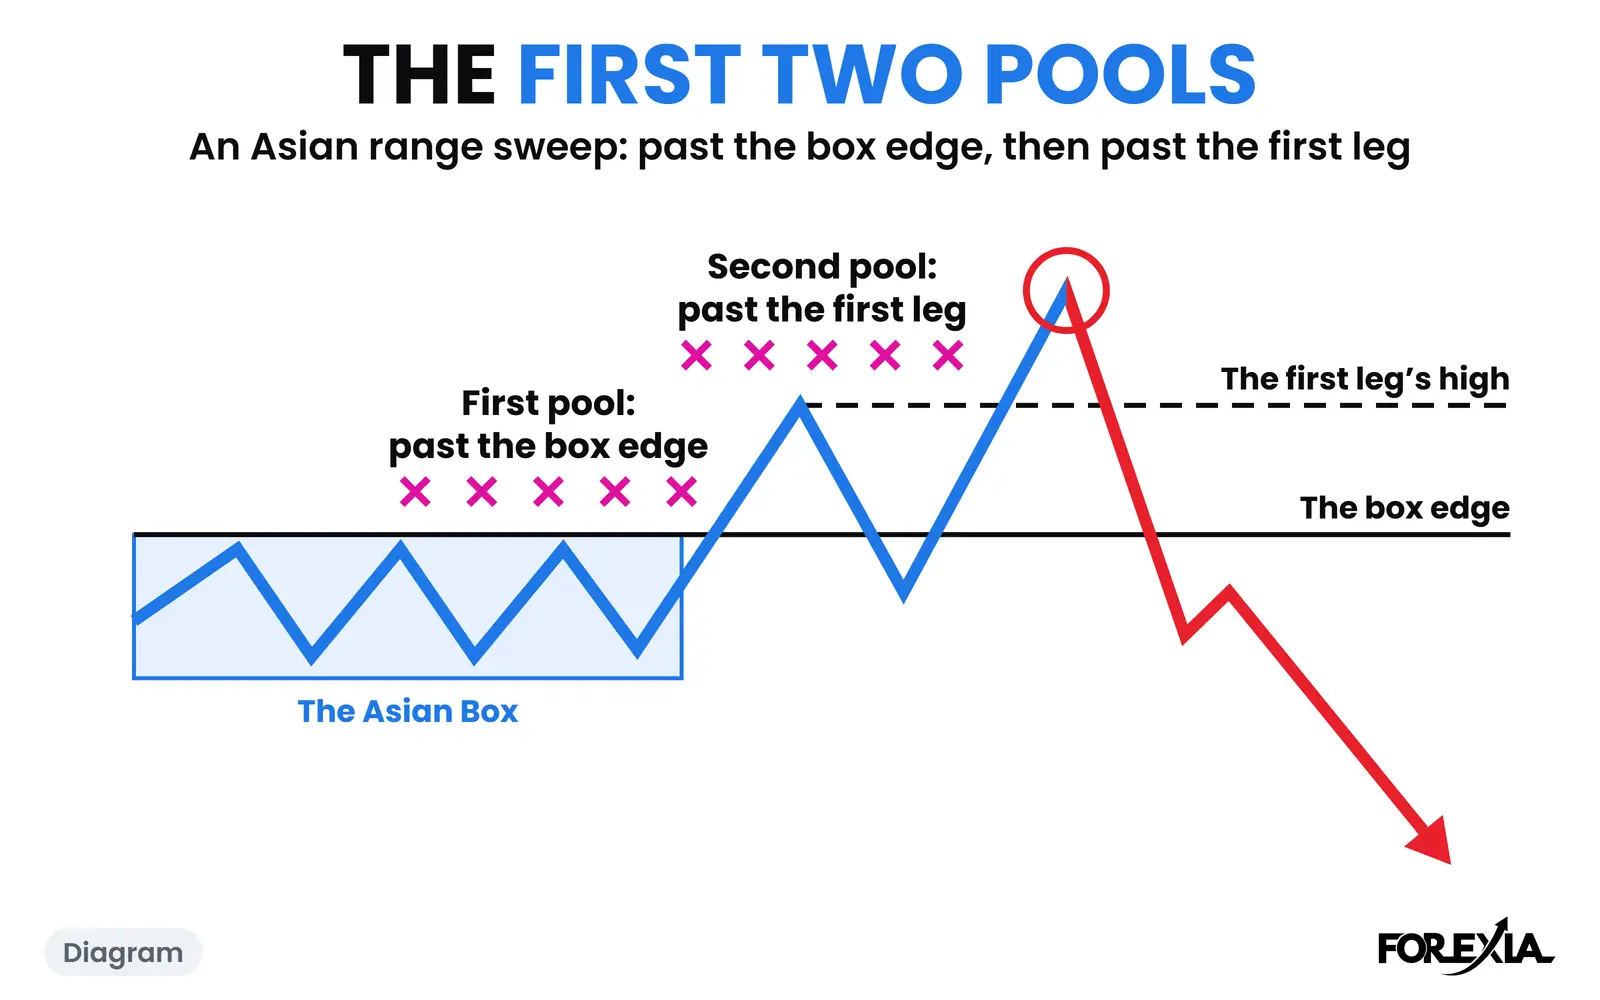
Core PCE prices and final GDP came out at 08:30 New York, and a candle here is named by the time it opens. Gold's box was 30 pips, 4165.26 to 4194.85, and on gold we count $1 as 1 pip. London went 7 pips over it to 4202.05 at 04:30 and fell back to 4176.15 at 07:15.
The 08:30 candle opened at 4192.82 and closed at 4214.48. Its second minute reached 4219.14, and the high of 4219.19 came at 08:35, 17 pips past London's high and 24 over the box. Nothing traded higher that day. By 13:45 gold was at 4147.18, 72 pips under that high and 18 under the box.
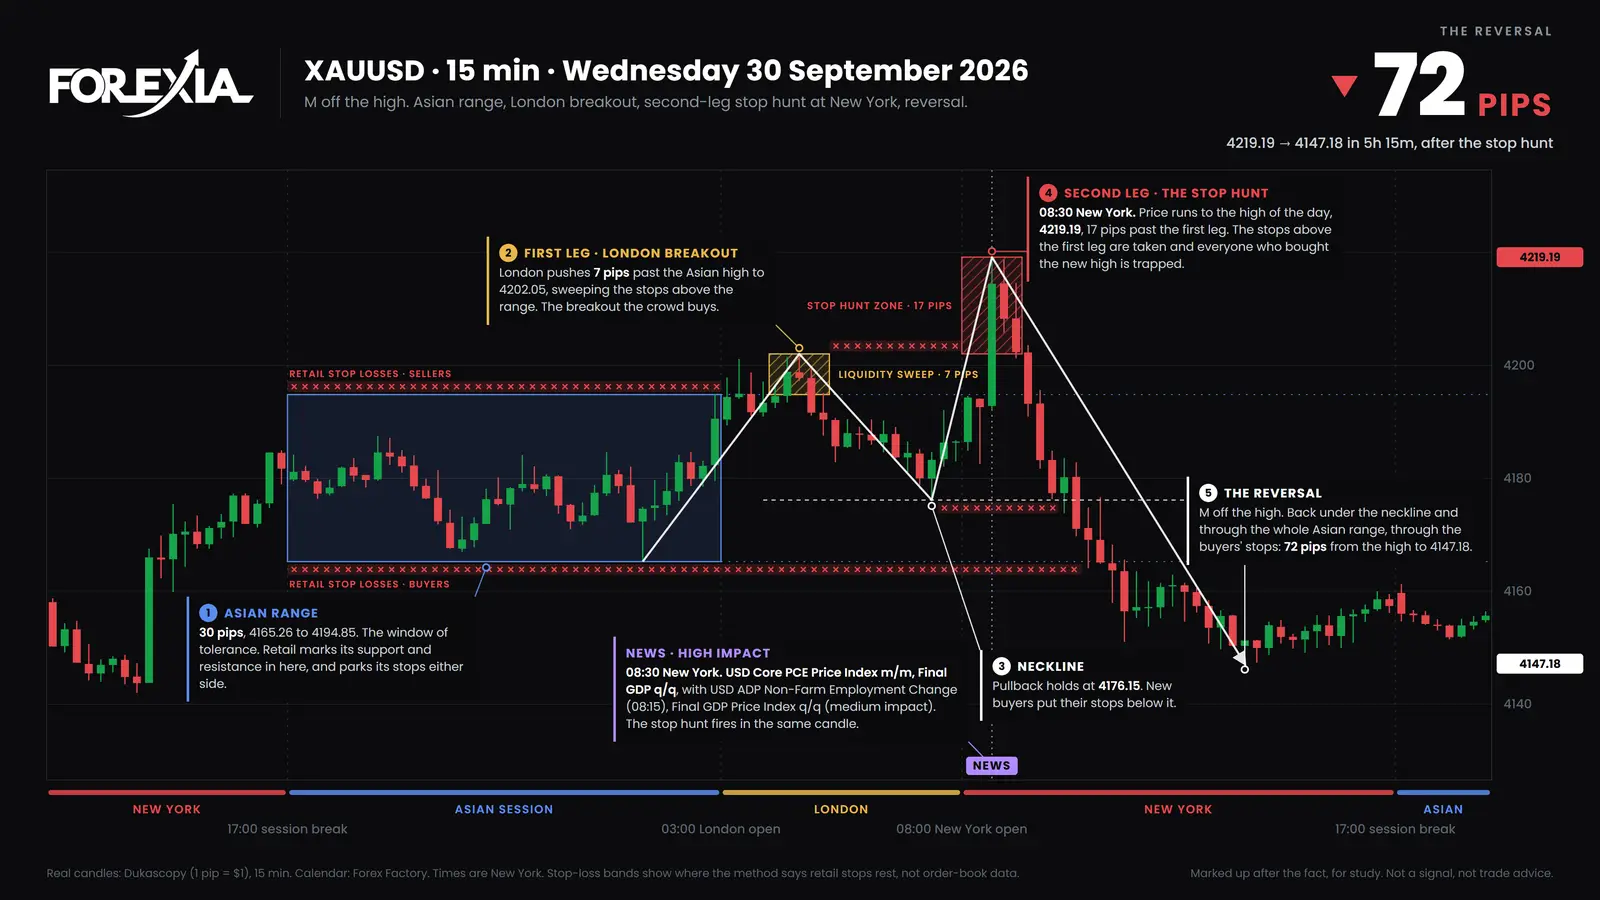
That morning six of our eight markets held: EUR/USD, GBP/USD, NZD/USD and gold their highs, USD/CHF and USD/CAD their lows. Notice when you could have known. At its close the candle was a big green body, 5 pips under its high. "Held" is a word for after the day.
A morning it did nothing: EUR/USD, 30 July 2026
The same two US releases came out at 08:30, core PCE and GDP. This time not one of the eight markets held.
The euro's box was 32 pips, 1.14430 to 1.14748. London took the low of the day at 03:30, 9 pips under the box at 1.14342, with no high-impact release within 15 minutes of it, though our calendar has medium-impact euro GDP and inflation figures at 03:00, half an hour before that candle. The 08:30 candle ran from 1.14724 to 1.14832. That is 11 pips, 38 over the day's low and 54 under its high, in the middle of nothing. The high came on the 10:00 candle, at 1.15369, 103 pips off the low.
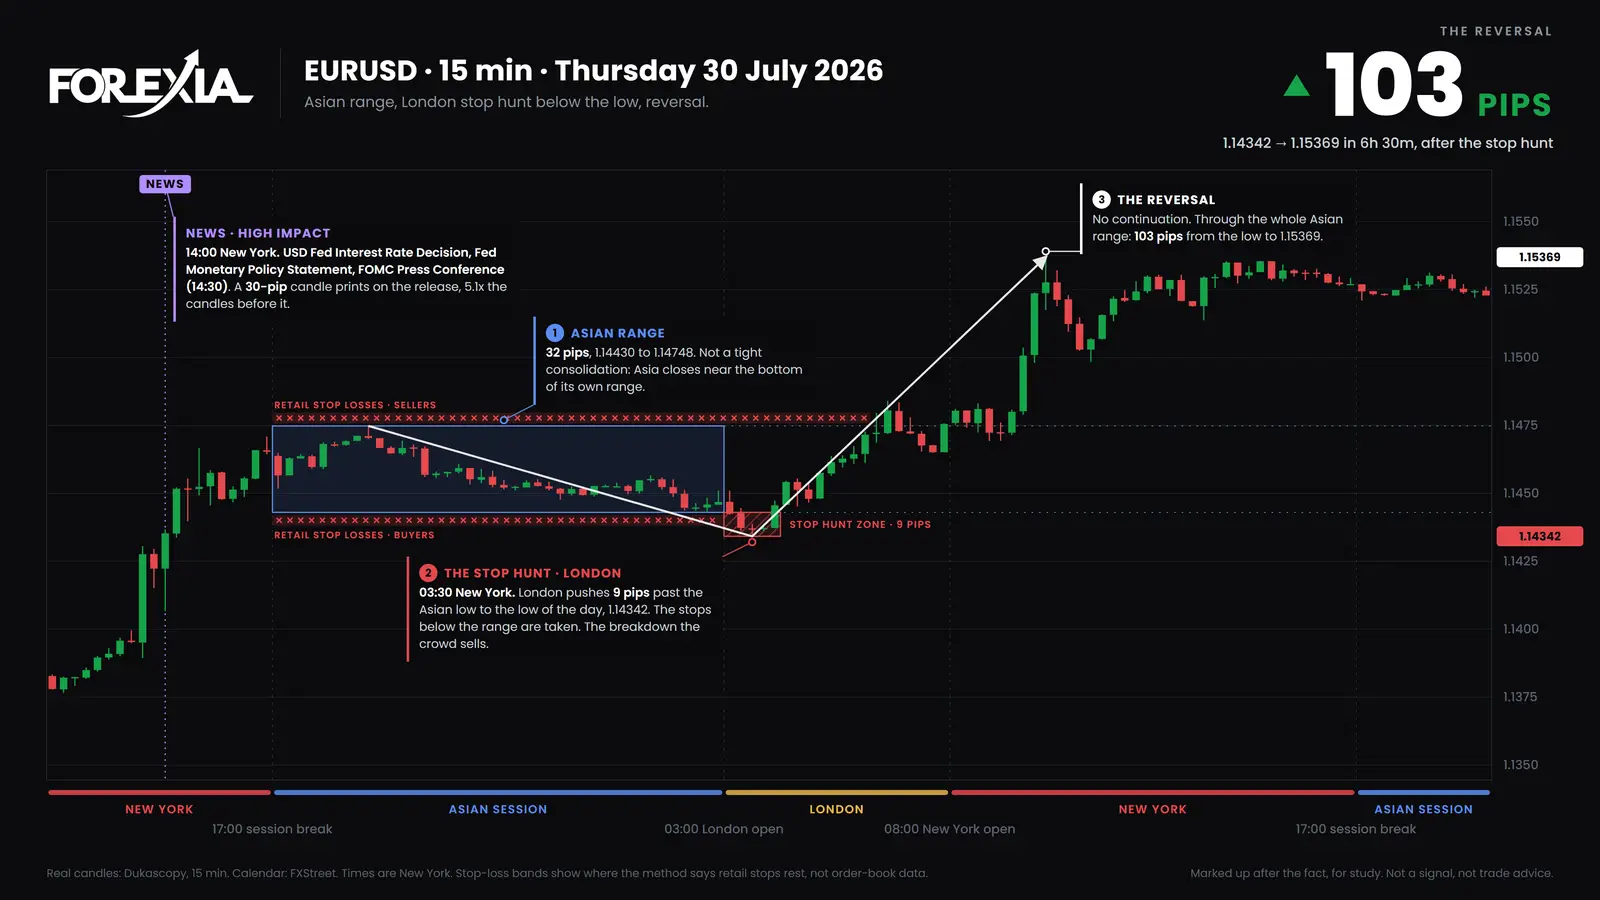
It was no quiet morning either. Our calendar has euro GDP figures at 04:00 and 05:00, the Bank of England at 07:00 and euro CPI figures at 08:00. That is the point of the day: everyone watched the US minute, and on this market the low was already five hours old. Same releases as 30 September, two months earlier, and the opposite result.
What can be shown, and what cannot
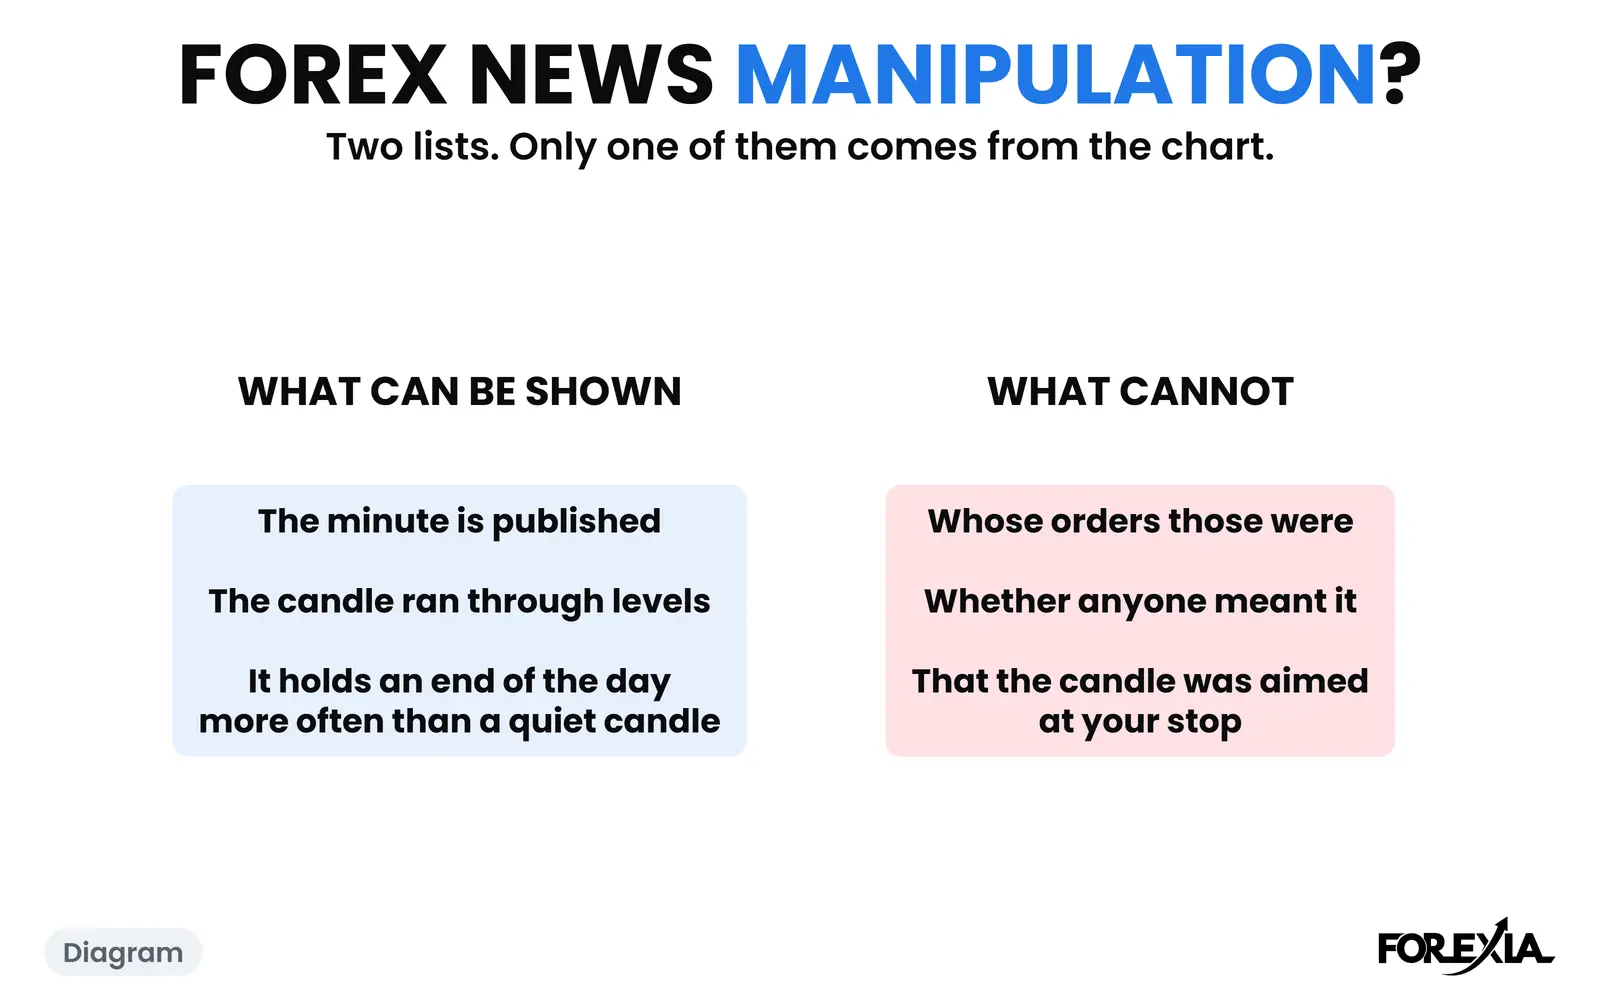
What can be shown:
- The time is published. The Bureau of Labor Statistics lists its dates and times in advance and the Federal Reserve its meeting dates, so nobody needs inside knowledge to gather around one.
- The candle's prices, and which levels it went through. You can check those on your own chart, allowing for small differences between feeds.
- That the release candle holds an end of the day far more often than an ordinary one, on the count above.
- That the FCA found traders attempting to trigger client stops, in the years and markets it looked at.
What cannot:
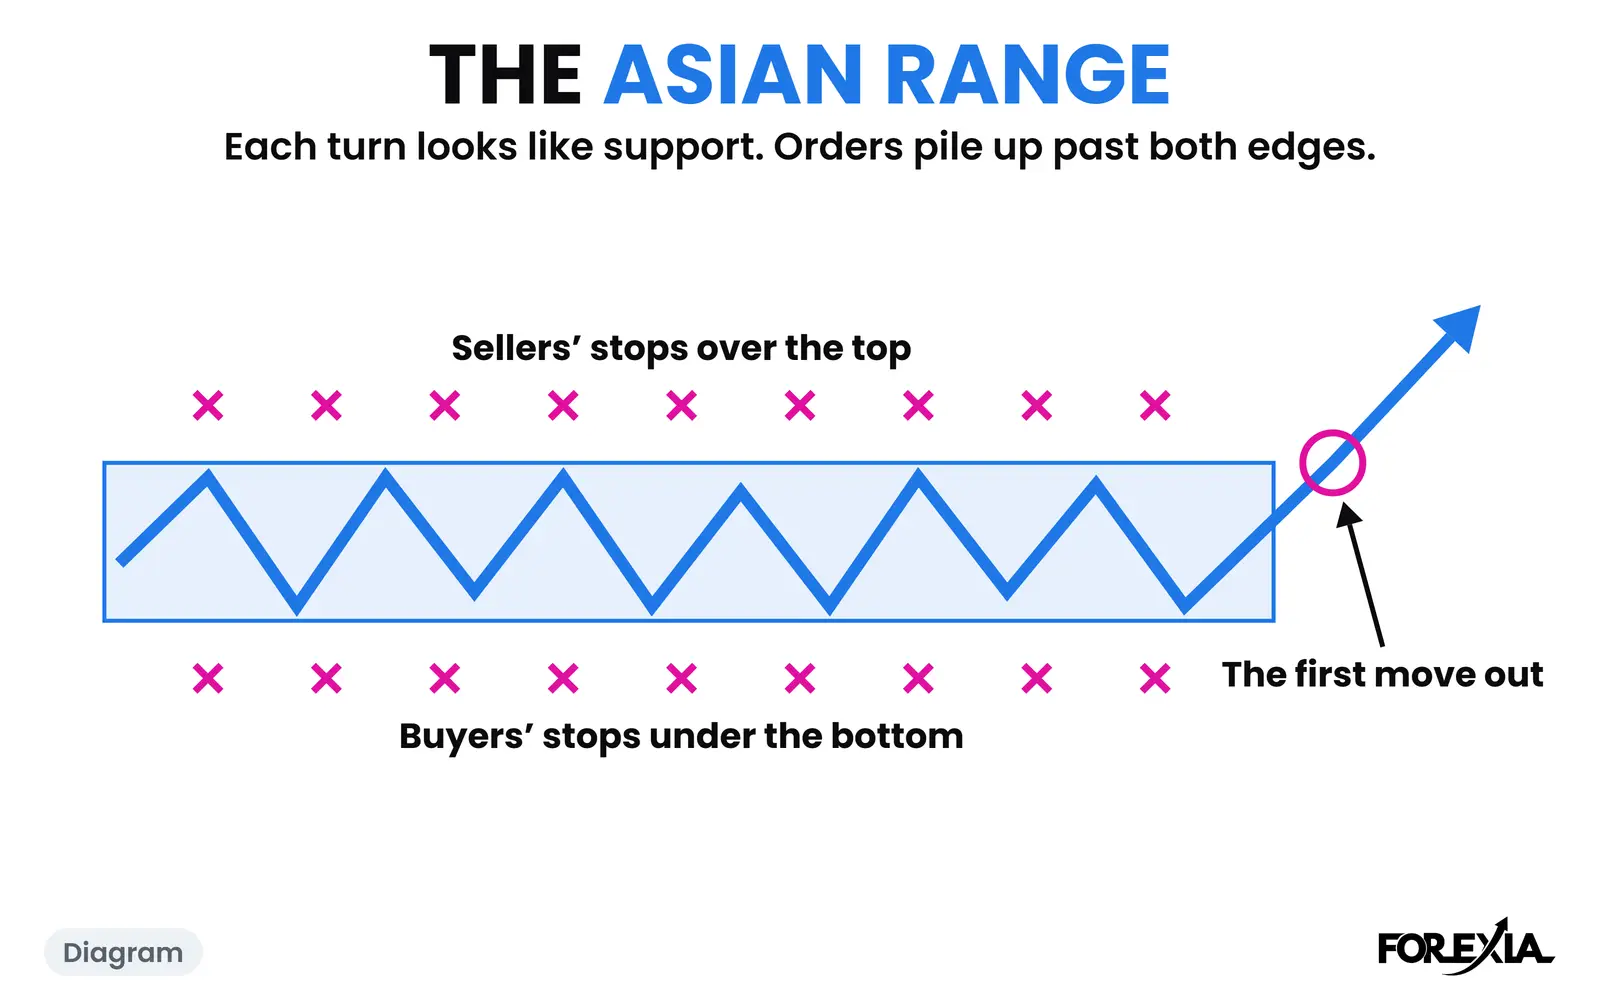
- Whose orders were in that candle, or how many stops it took. No retail trader sees the order book, and the red bands on our charts are a reading of the structure, not order-book data.
- Whether anyone meant it. A large order with nothing to do with your level, or stops firing into thin quotes, can print the same shape.
- That anyone knew the number early. A spike before a release is no evidence of that, and a chart cannot show it.
- That your broker did anything. Your stop fires on your broker's price, which can differ from the market's around a release. That is a separate question with its own test, and NFP spreads and slippage covers the fill.
How the three seats read it
The Three Seats split this cleanly.
- Retail treats a release as a forecast. A candle that goes against the number feels like cheating, because the number was supposed to decide.
- The market maker, as we read it, sees a known minute when everyone acts at once and stops near price can fill in one candle. Our read is that market makers build the chart and use this minute. That is a reading, not a proof.
- The observer takes neither on trust and counts. The count says the minute is unusual. It does not say why.
So our position, stated plainly: we read the release minute as used. We cannot prove it, the same figure fits a market with nobody aiming, and we say so. Nor does the read pay by itself: our own fixed rule of fading hunts on a high-impact release lost money after costs, which the news trading guide sets out, and the research page holds our other tests.
Common mistakes
Four misreadings turn a count into an accusation, or into a plan.
- Calling the candle a trap on a morning like 30 July. It held on 43 of 240. On the euro that day it was 11 pips in the middle of the day.
- Taking gold's green candle on 30 September for a buy. The 43 split into 18 highs and 25 lows, and that big green body was the top of the day.
- Building a plan on the 43. Gold on 30 September and the euro on 30 July had the same two releases, and one candle held while the other did nothing. It is a count of candles on one feed over six months, and it says which minute to look at, not what to do there.
- Calling every bad fill manipulation. A stop that fills past its price in that minute is what a market order does in a thin market. Why price spikes, then reverses, after news walks through the mechanics, and more dated release days are in the markups of 7 September 2026.
Course 2 of ForexiaPRO, The Chaos Pattern, teaches this read step by step in lesson 2.3.2, We Counted the 8:30 Candle.
Frequently asked questions
Is forex news manipulated?
Nobody can show that from a chart. The UK's regulator found traders at banks attempting to manipulate fix rates and trigger client stop-loss orders, from 2008 to 2013, and the CFTC found attempted manipulation of FX benchmarks, but neither finding concerns economic releases. Our count shows the release minute is unusual: the 08:30 candle held an end of the day on 43 of 240 release market-days. It cannot show who was behind any candle or why.
Why does the market move before and after news?
The time of a scheduled release is published, so orders and stops gather around it. A triggered stop becomes a market order, and quotes are often thin in that minute. On our reading that is enough to print a large candle. Whether anyone also aims it is a separate claim that the candles cannot settle.
Does FOMC affect forex?
Yes, it can move every dollar pair at once, and it does not always mark the day. On four Fed days from 29 April to 16 September 2026, on eight markets, the 14:00 decision candle held the day's high or low on 5 of 32 market-days, all five on one day. On every other day the 14:00 candle held on 20 of 998.
Is NFP Friday manipulated?
Nothing in our data can say. On five jobs reports from 8 May to 4 September 2026 the 08:30 candle held the day's high or low on 12 of 40 market-days, and half of those came on one Friday. A large candle on a known minute is what you would expect with or without anyone aiming it.