Why Does Price Hit Your Stop Loss and Then Reverse? The Stop Hunt on Two Real Days
Dylan Forexia8 min read
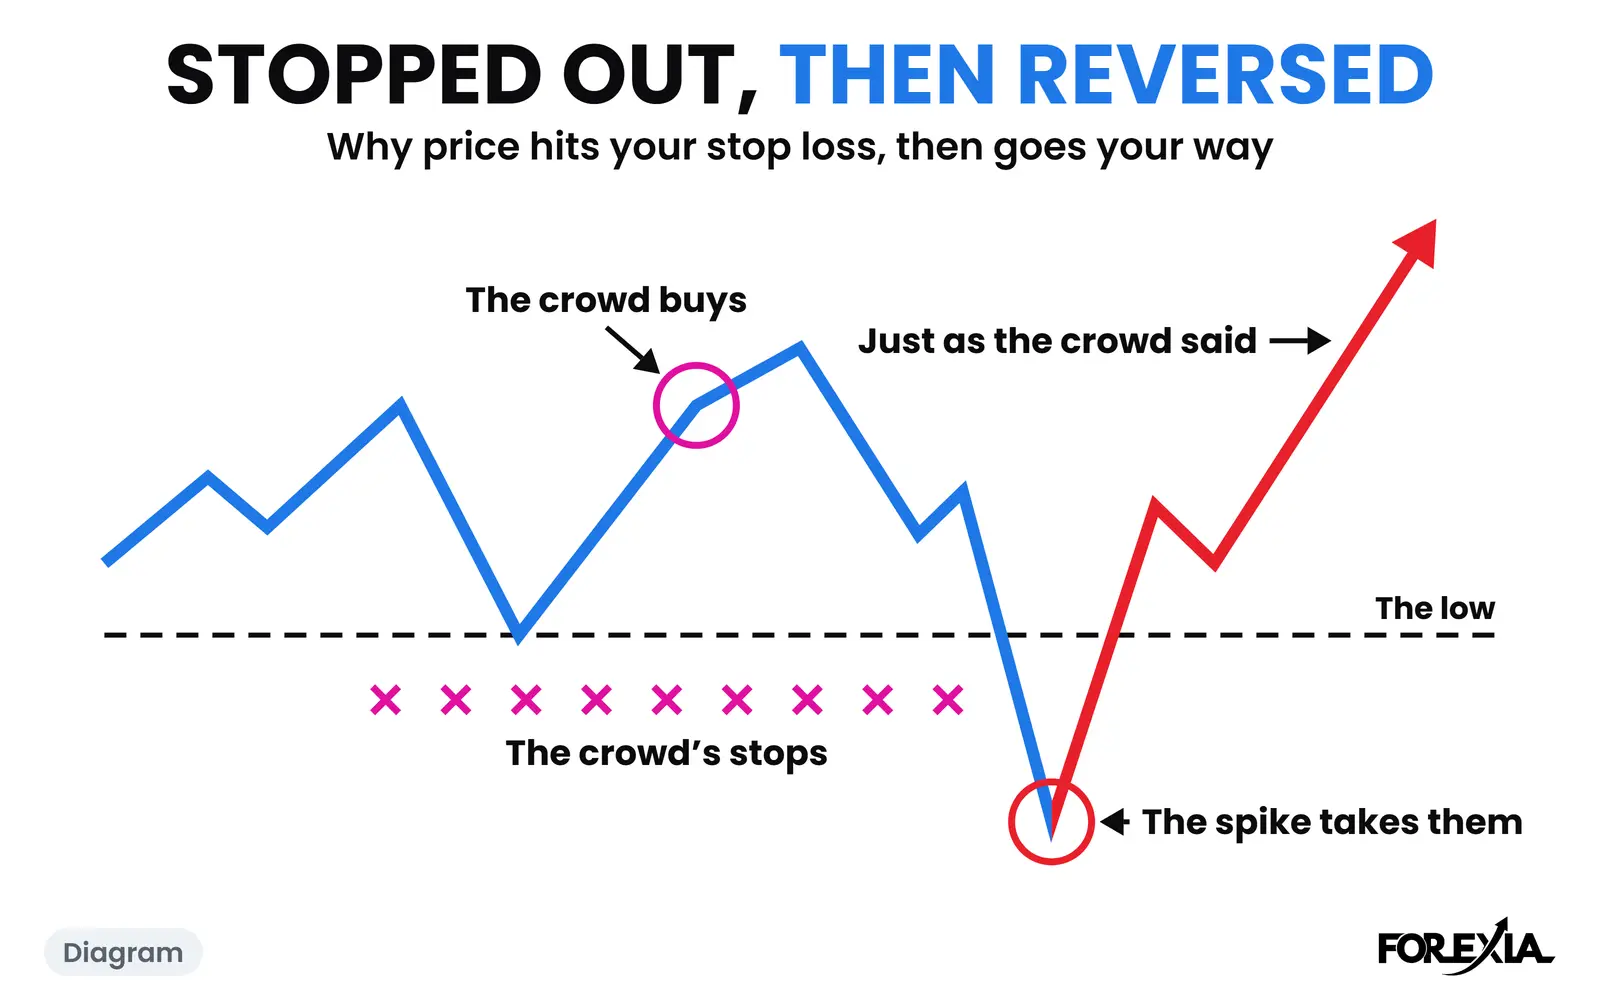
Price hits your stop loss and then reverses because stops rest in clusters where the chart tells everyone to put them, and each stop is an order waiting to fire. Price reaches the cluster, those orders fill whoever wanted the other side, and the push runs out. We call this the stop hunt. Most traders call it a liquidity sweep.
None of that needs anyone to know your stop. Yours was simply in the pool. Whether your own losses were hunts at all is a separate question, with a check you can run on them. Here are the mechanics, on two real days.
Why does price hit my stop loss and then reverse?
Because a stop loss is an order that has not fired yet. A buyer's stop is a sell order. A seller's stop is a buy order. So a level with many stops behind it is a pile of orders pointing the same way, all sent to market within moments of each other.
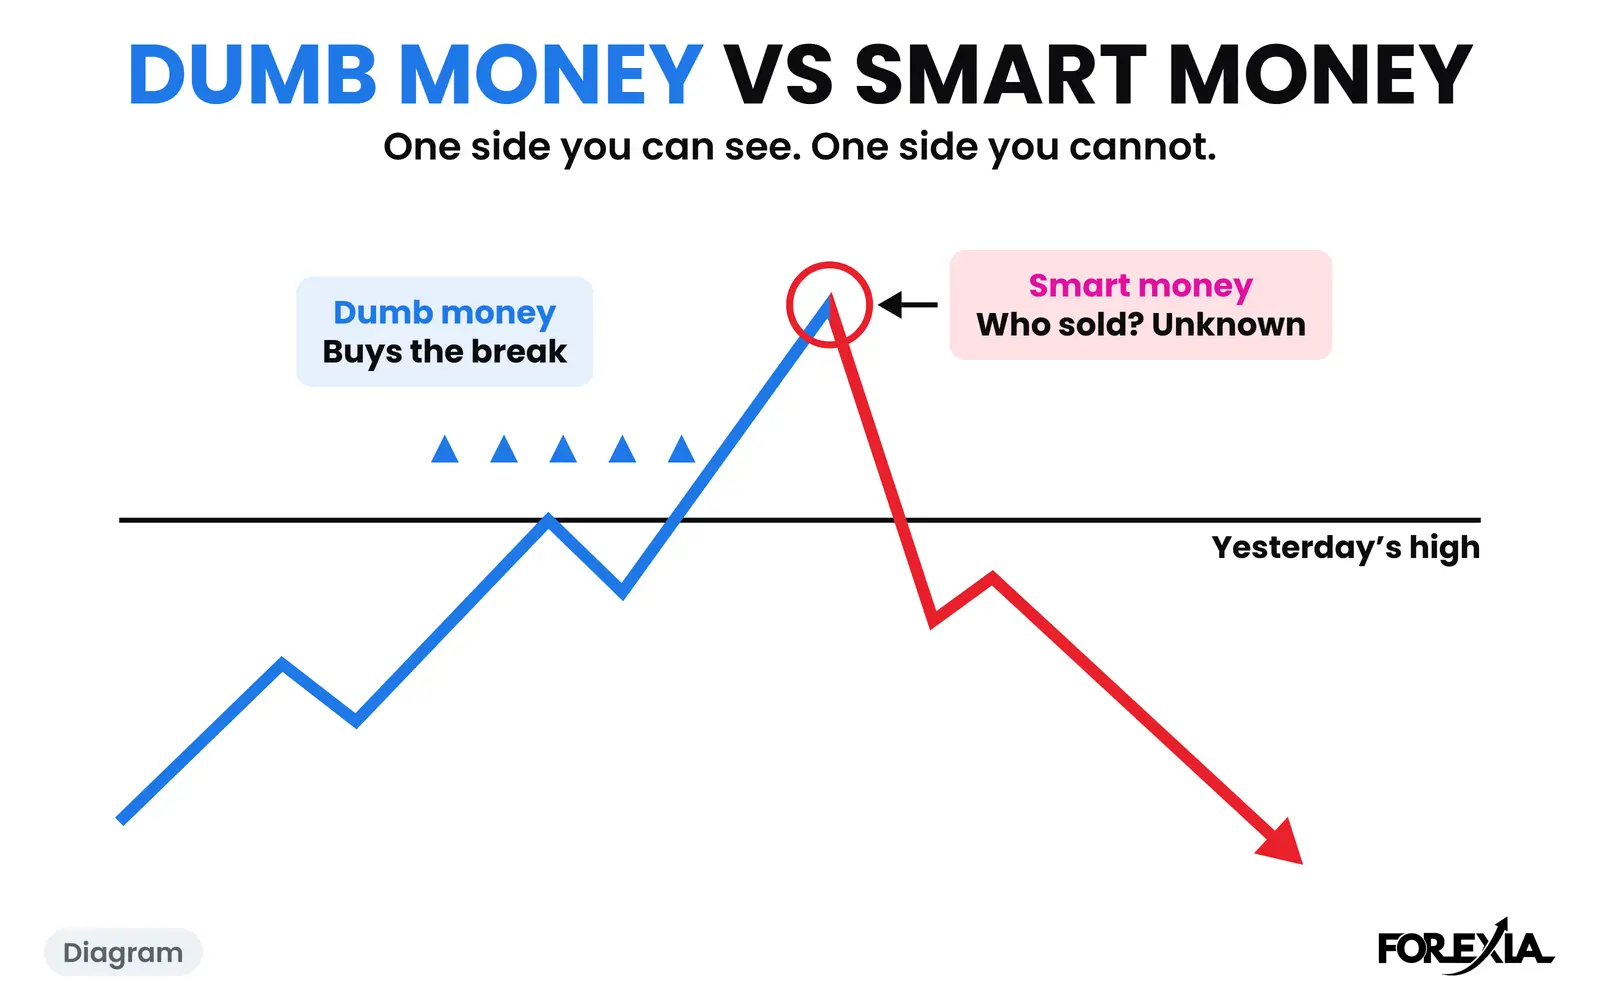
Now take the market maker's seat, or the seat of anyone with a large position to build. To sell size you need buyers, and a quiet market has few. Selling into it pushes the price against you. Above a flat top, though, sit the stops of everyone who sold it and the orders of everyone waiting to buy the break. Take price up there and those buyers arrive together. We read that as the purpose of the move: the crowd's exit is someone else's entry.
The turn comes next because stops fire only once. When they are gone, the buying that drove the last few pips is gone too. Anyone who bought the break now holds a losing trade, with a stop of their own underneath. Those stops are the fuel for the way back.
Research supports part of this. A New York Fed staff report used a major dealing bank's order book to show that stop-loss sell orders cluster just below round numbers and stop-loss buy orders just above them. Exchange rates moved unusually fast after reaching those levels, an effect it found over hours and not days. The data is decades old, the report says its statistics cannot prove the orders caused the move, and its evidence for reversals is about take-profit orders, not stops. So the cluster and the faster move after it are documented. The turn after a stop hunt is our reading, from watching real days.
A real day: USD/CAD, Thursday 17 September 2026
USD/CAD spent the Asian session in a 17-pip range, 1.39806 to 1.39979. Drawn on the chart, that range is the Asian box. Late in London price came back to the top of it. The candles at 07:00, 07:15 and 07:30 New York made highs of 1.39974, 1.39980 and 1.39972. With the Asian high, that is four touches within a pip: a flat top, the most visible line on a chart.
London's last candle, at 07:45, ran to 1.40011, 3 pips over the box, and closed at 1.39989, 1 pip over. New York's first candle took it straight back. It closed at 1.39912, 7 pips inside the box and under the breakout candle's low of 1.39947. That is the close back, and no high-impact release for either currency came within 15 minutes of that high. By 10:15 price was at 1.39735, 28 pips under the high and through the whole box, 2 hours 30 minutes later.
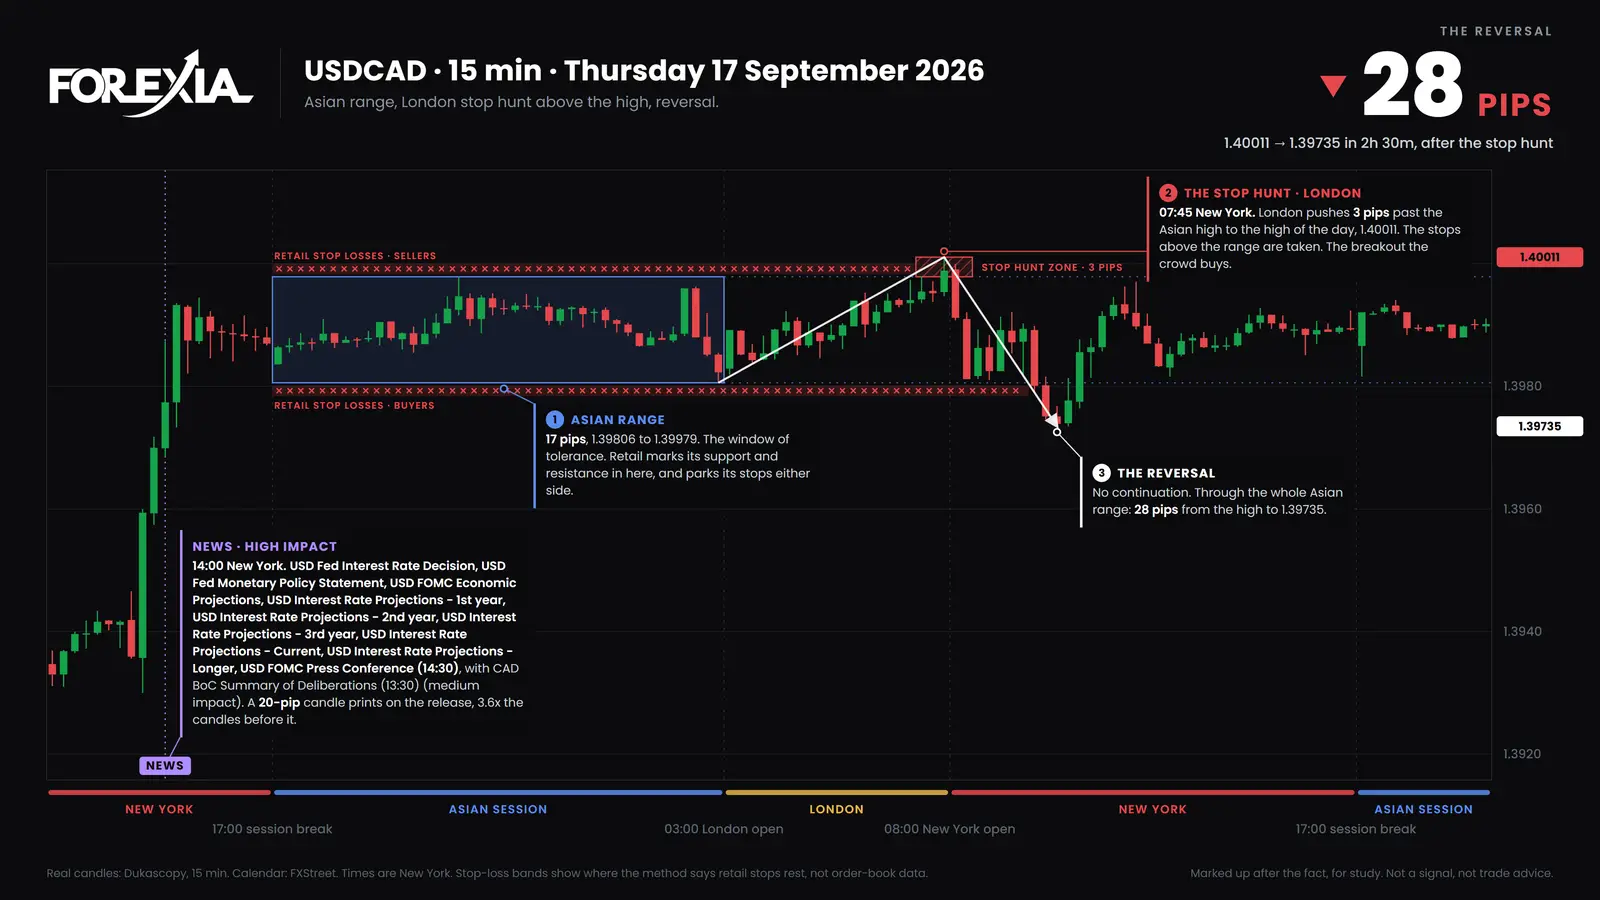
The real thing is messier than a textbook drawing. Around noon price was back up at 1.39971, within a pip of the top of the box, and on Friday it traded 13 pips through that high. A hunt can explain a few hours. It does not promise that the level holds for the week.
What did each seat see?
The same candles read three ways, depending on which of the three seats you take.
- Retail saw resistance. The textbook offers two trades: sell the flat top with a stop just over it, or buy the break with a stop under the breakout candle. Both stops could be marked before the candle printed.
- The market maker, as we read it, saw a pool. Sellers' stops over 1.39979 and the breakout buyers' orders were all buying, in the same few pips. Just below sat the next pool: the breakout buyers' own stops under 1.39947.
- The observer saw the order of events. A line everyone could see, a push just past it, a close back one candle later. The observer cannot say who sold. The observer can say that anyone who chased 1.40011 was 10 pips under water when the next candle closed.
Marking those pools before the session is Liquidity Mapping. Reading a pattern backwards, from where its traders' stops sit, is Reverse Price Action.
Does it look different on a news release?
It looks the same, and it can go much further in one candle. On GBP/USD on Friday 11 September 2026 the Asian box ran 31 pips, 1.34953 to 1.35264. That is more than half the pair's 50-pip average daily range, so this was no clean box. Thursday's low sat just beneath it at 1.34910.
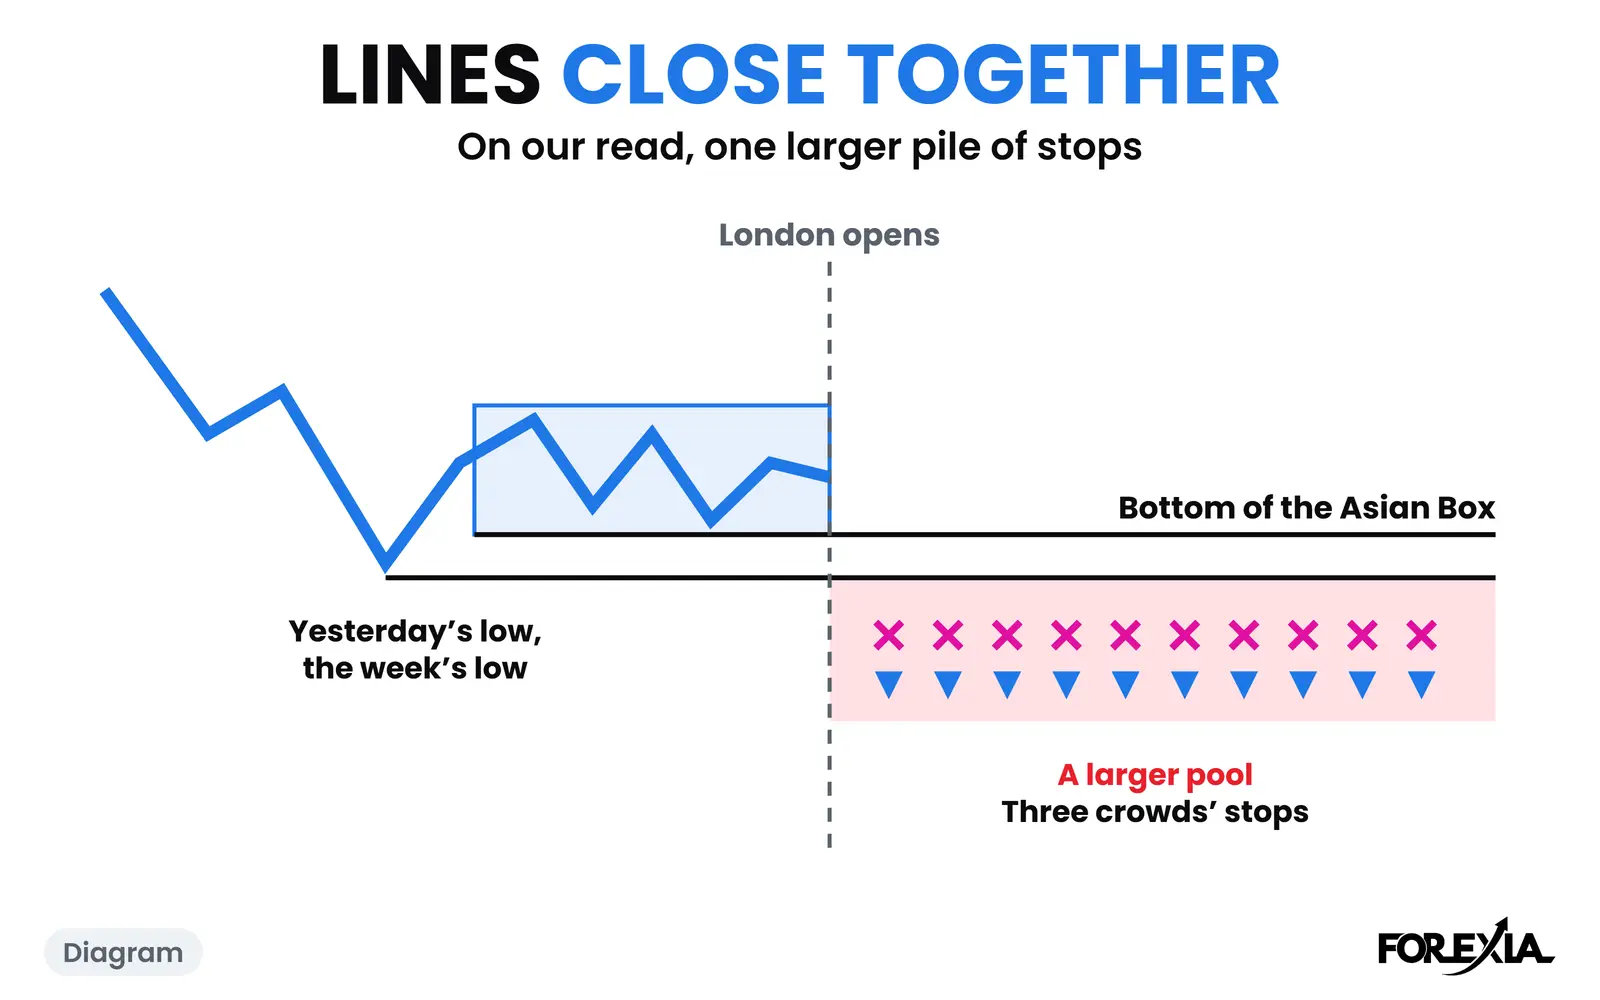
At 05:00 New York a London candle dipped to 1.34976 and held, 2 pips above the box. Two lows in the same place read as a double bottom, and the textbook says buy the second with a stop underneath. The stops under the Asian low and those under Thursday's low, 4 pips lower, made one pool.
US inflation data was due at 08:30. That candle opened at 1.35158, fell to 1.34801 and closed at 1.35081. Its low was 15 pips under the box and 11 under Thursday's low, and it closed 13 pips back inside. At 38 pips it was about six times the day's average candle, the kind we call the Reversal Candle. By 09:45 price had reached 1.35345, 54 pips off the low, and that candle closed at 1.35313, the first close over the top of the box.
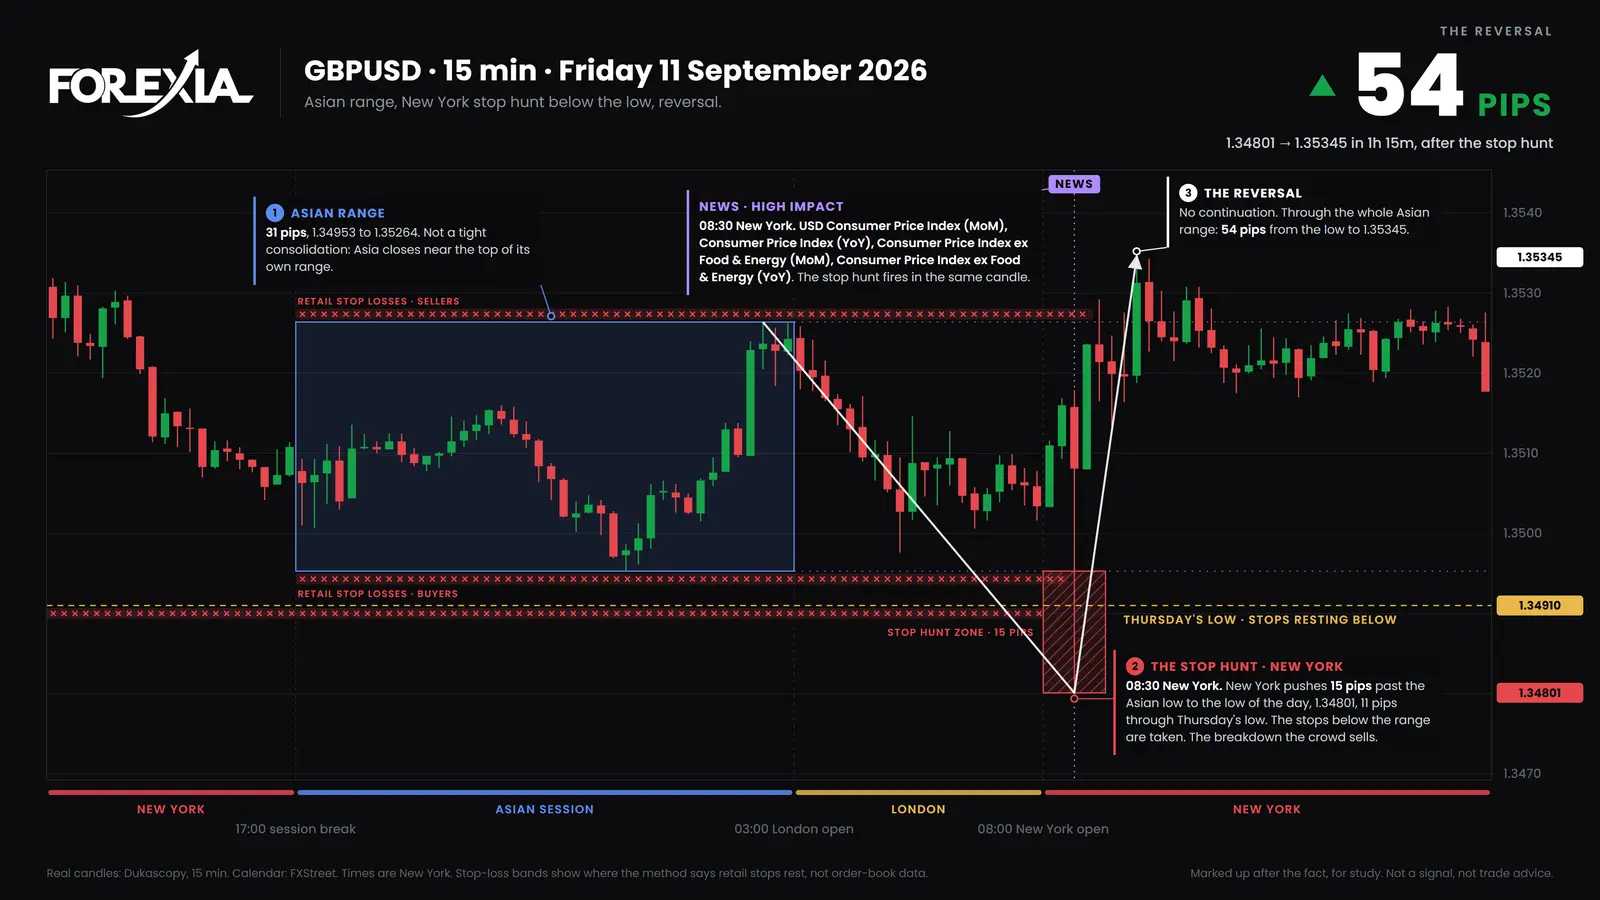
Keep one caution beside this day. The release moved every dollar pair, so this is one dollar move and not several confirmations, and nothing on a chart shows that anyone aimed that candle at that level. What the chart does show is where it went and where it closed. That low stayed the low of the week.
Is stop loss hunting a real thing?
The move is real, and the motive cannot be shown.
What can be shown: that stops cluster, from the research above, and that price went past a visible level and closed back, from the candles. You can check both days on your own chart, allowing for small differences between feeds.
What cannot be shown: who moved the price, whether it was deliberate, or where any one stop sat. No retail trader sees the order book, and the red bands on our charts are a reading of the structure, not order-book data. We do not say a broker did this to anyone. Whether a broker ever does has its own test.
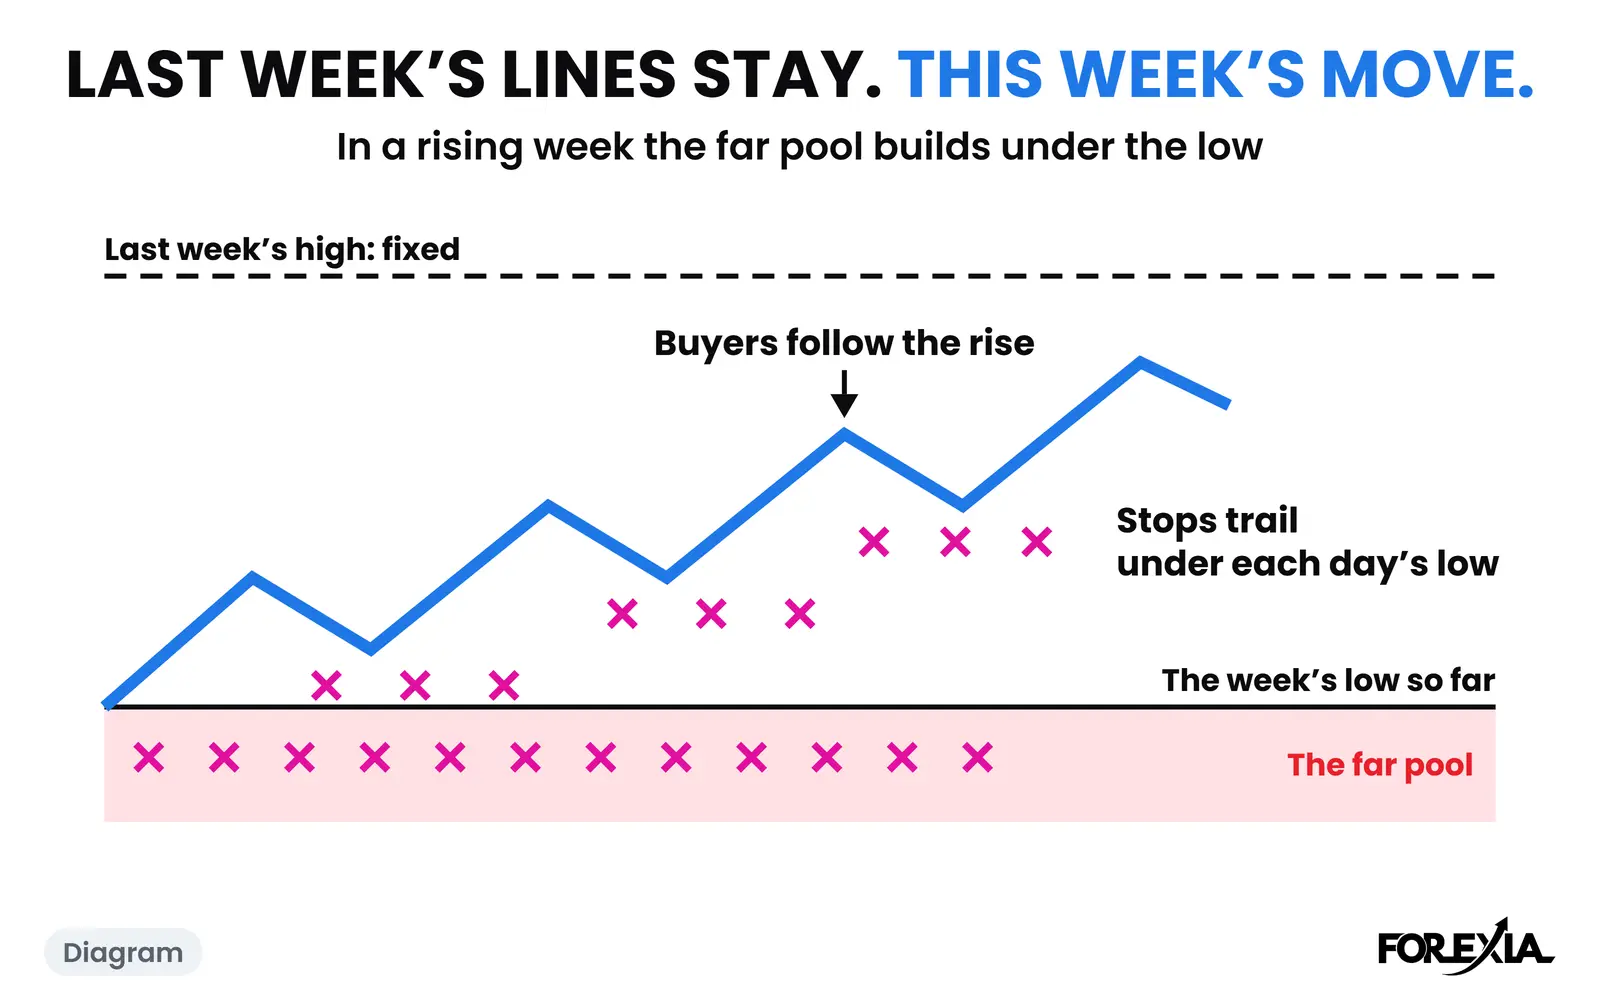
Noise adds to the picture: a stop a few pips from the market can be taken by an ordinary hour's movement, with no pool involved. So does memory, because the stops that reversed are the ones you remember, which is why the check on your own losses starts from your broker's history.
We tested the idea as well. Run as a mechanical rule, trading against the hunt did not make money: many hunts have another leg, and some are the start of a trend. That work is written up in what we found when the hunt kept going. The read explains why a stop was taken. It does not make the next trade pay. For the full picture of stop loss hunting, including fakeouts and false breakouts, start at the hub.
How can you test this read without risking money?
Keep your own record. Each time a stop of yours is hit, write down what price did over the next few hours. After a few weeks you will know how often yours turned and how often they kept going, and that is worth more than our examples.
For a third dated example, the USD/CAD markup from the week of 20 April 2026 shows a hunt under Monday's low that set the low of the week.
Common mistakes
All three come from staying in the first seat.
- Trusting the place the pattern gives you. On USD/CAD the stops over the flat top went at 07:45, all together. Moving a stop a few pips is no cure, because the depth is not fixed: 3 pips that morning, 15 on the pound's release.
- Reading the hunt as the move. Anyone who sold the pound's break saw a 38-pip candle, and that same candle closed back inside the box.
- Calling every stopped trade a hunt. A hunt closes back inside the level. If price went through your stop and stayed through, your read was wrong and the stop did its job.
Course 3 of ForexiaPRO, Reverse Price Action, teaches this read step by step in lesson 3.2.1.
Frequently asked questions
Is stop loss hunting a real thing?
The move is real: stops cluster at visible levels, and price can run through them quickly. Who caused a given move, and whether it was deliberate, cannot be shown from a chart. We read it as price going where the orders are, and we say that it is a reading.
How far past a level does a stop hunt go?
There is no fixed distance. On USD/CAD on 17 September 2026 it went 3 pips past the Asian high. On GBP/USD on 11 September 2026 it went 15 pips past the Asian low, on a data release. Our own testing found no depth at which hunts tend to end.
Does a stop hunt mean price will reverse?
No. Many hunts have another leg, and some are the start of a trend. USD/CAD fell 28 pips after its hunt, gave most of it back by noon and went through that high the next day. Run as a mechanical rule, trading against the hunt did not make money in our own test.
Why does price turn right after taking my stop?
Because stops fire only once. When they are gone, the orders that drove the last few pips are gone too, and anyone who chased the break now holds a losing trade with a stop of their own on the other side. That turn is our reading: the research documents the cluster and the faster move, not the reversal.