NFP Breakout vs Pullback vs Staying Out: What Real Fridays Show
Dylan Forexia7 min read
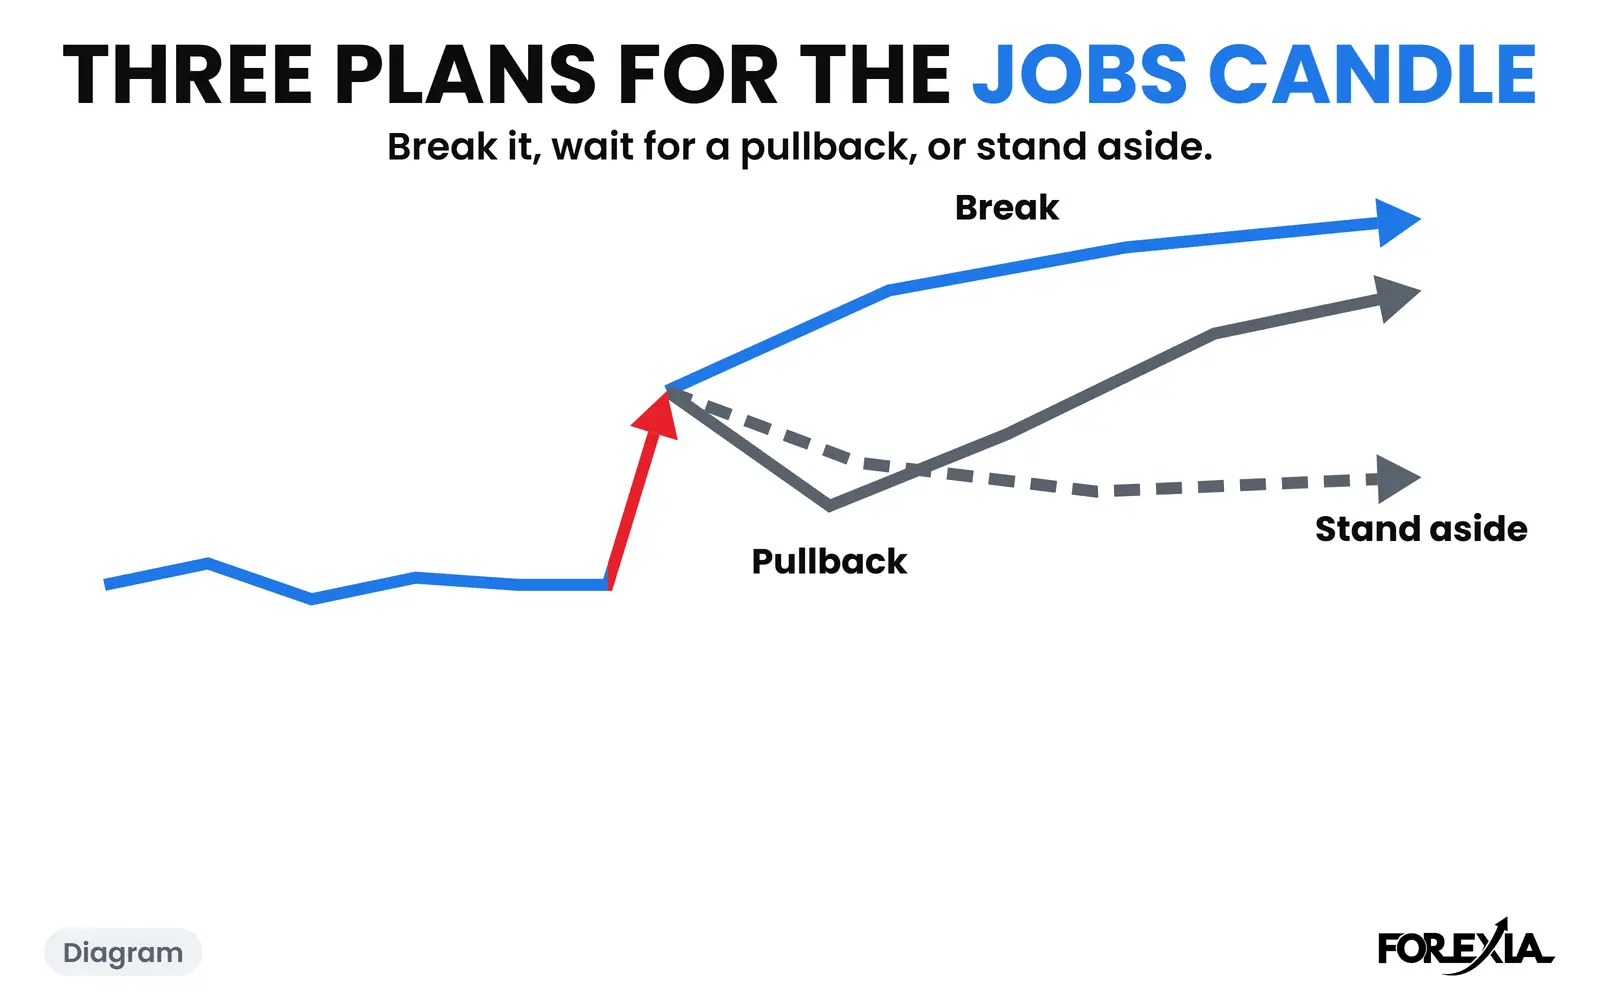
NFP breakout vs pullback is the oldest argument about the jobs report: trade the break of the first move, wait for a pullback, or stay out. We did not test either as a trade. We counted what price did after the 08:30 candle on 40 market-mornings: it broke the candle's extreme within two hours on 27, and came back to the candle's middle on 23.
NFP is nonfarm payrolls, the headline of the US Employment Situation report, out at 08:30 New York. All times here are New York, a candle is named by the time it opens, and on gold we count $1 as 1 pip. The wider subject is in news trading.
What are the three plans?
Page-one guides offer these:
- Breakout. Trade the first move once it has gone, in its direction, usually when price passes the 08:30 candle's high or low.
- Pullback. Wait for price to come back part of the way, then trade the resumption.
- Stay out. Take no position through the release, and perhaps for some minutes after.
The guides show hypothetical levels and no results. We are in the same position on results, and we say so. What we have is a count of how often price gave each plan its chance.
NFP breakout vs pullback: what did price do on 40 market-mornings?
We took the five jobs reports from 8 May to 4 September 2026 (8 May, 5 June, 2 July, 7 August and 4 September) on seven dollar majors and gold. For each market-morning, the 08:30 15-minute candle, then the next eight candles, 08:45 to 10:45. The candle's direction is its close against its open.
| What price did from 08:45 to 10:45 | Market-mornings of 40 |
|---|---|
| Traded past the candle's extreme (a break) | 27 |
| Traded back to the middle of the candle's range (a pullback) | 23 |
| Both | 12 |
| Closed back through the candle's open | 5 |
So 27 plus 23 minus 12 is 38: on all but two mornings price did one or both. Of the 12 that did both, the break came first on 9 and the pullback first on 3. On 17 market-mornings price never came back to the middle of the candle, and on 13 it never passed the extreme.
The count is nfpAfter in scripts/seo-counts.mjs. It stops on Thursday 1 October 2026 and counts candles, not trades.
By market the picture is lumpy. Gold passed the candle's extreme on all five mornings and came back to the middle on three. USD/JPY passed it on two and came back on all five, because its candles were the largest. EUR/USD passed the extreme on four mornings and came back to the middle on four, both on three.
One more figure, with a warning. On 39 of the 40 market-mornings the day's last candle closed on the side of the 08:30 open that the candle had closed on. That is a low bar, since price only has to be on the right side of one price at 17:00. It says the first move rarely turned into the opposite day. It does not say what an entry would have made.
What does a break look like when it works? Gold, 2 July 2026
Thursday 2 July is a day where a pullback plan would never have filled. Gold's 08:30 candle opened at 4065.05, ran to 4140.19 and closed at 4132.48, a 76-pip candle through Wednesday's high of 4115.48. The middle of its range was 4102.15.
- 08:45. The low was 4111.81.
- 09:15. The lowest low after the jobs candle, 4109.22, still 7 pips above the middle.
- 09:30. A candle of 28 pips closed at 4134.51.
- 09:45. The high of the day, 4143.72, 3.5 pips over the jobs candle's high.
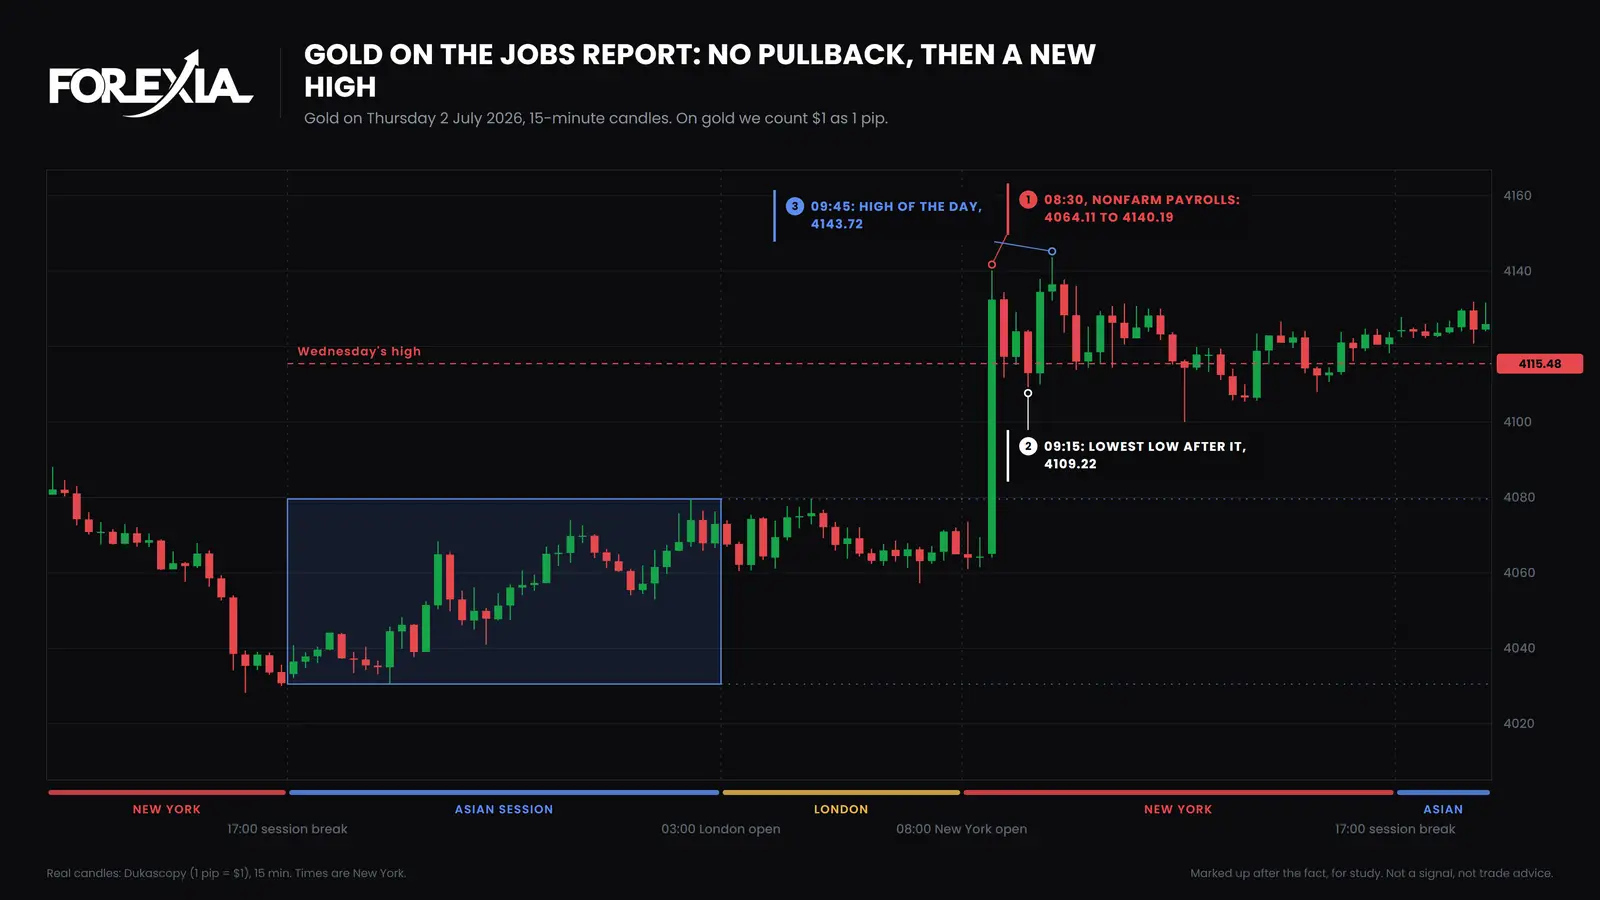
A trader waiting for a pullback to the middle would have waited all morning. A trader who bought the break at 09:45 would have bought the high of the day. Both are facts of the candles, and neither says what either would have done with a stop.
What does a break look like when it does not follow through? EUR/USD, 4 September 2026
Friday 4 September is the reverse. EUR/USD's 08:30 candle opened at 1.16260, fell to 1.15847 and closed at 1.15990, 41 pips from end to end. It stopped 1 pip over Thursday's low of 1.15835. The 09:15 candle was the first to trade back to the middle, 1.16054, and no candle traded under 1.15847 for the rest of the day.
By 11:30 price reached 1.16226, 38 pips off the low and 3 under the candle's open.
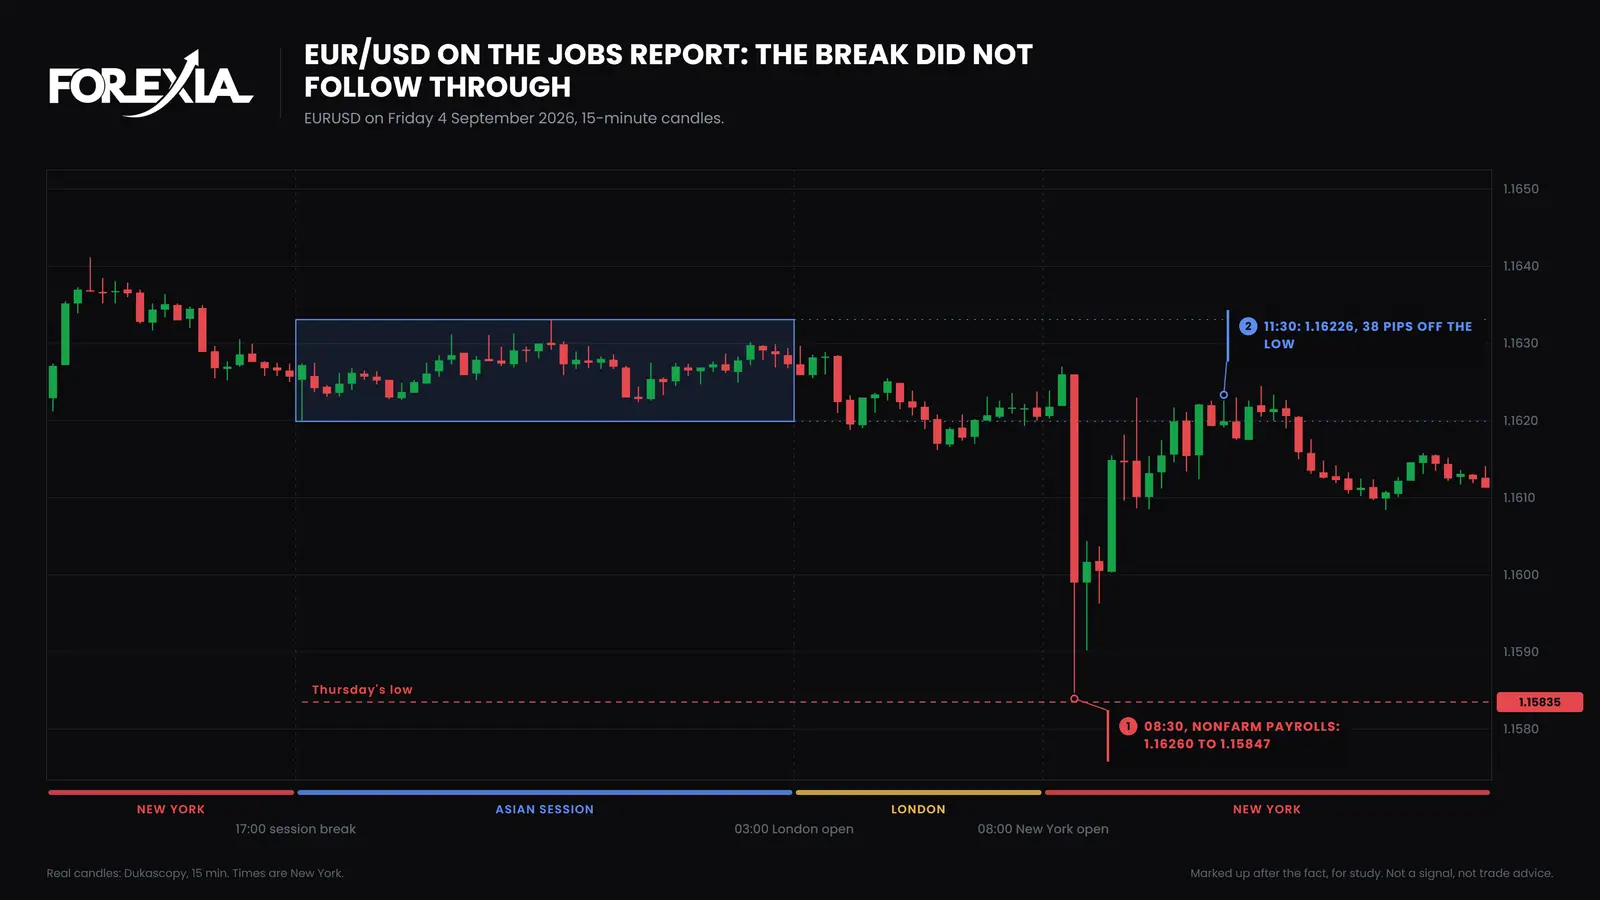
A break plan on the downside would have had no break to trade, and a trader selling at the close of the candle would have been 38 pips against by 11:30. We read it as the crowd's stops under the morning's lows funding a turn, though a chart cannot show whose they were. On the pound the same minute made the hunt of Thursday's low, as the NFP stop hunt shows.
What does staying out give up, and what does it avoid?
It gives up the move: the candle ran 76 pips on gold and 41 on EUR/USD on these two days, and 27 of 40 market-mornings had a chance to join a break. It avoids the minute in which the fill is worst, and the candles on which a break did not follow through, such as 4 September. We cannot weigh those against each other with the data we hold, and the guides that say they can show no result either.
What the count does say is that the candle was rarely the end of the story: price did one or both of the two things on 38 of 40 mornings. A plan that stands aside for the minute and watches the next two hours is watching a period in which, on these mornings, something usually happened. Whether that is worth trading is the part nobody here has tested.
What about costs?
We cannot count them, and that is the missing half of any NFP plan. A candle count has no entry, stop or target. It has no spread either, because our candles are drawn from the bid alone, and the fill in the first minutes can be far from the last price. NFP spreads and slippage measures how far one minute travels.
What we have run is a fixed rule near this. A program that faded each hunt printed in the release candle, on seven dollar majors and gold on 5-minute candles with real bid and ask from February 2021 to December 2024, came to -0.12R a trade after costs. R is the amount risked. Fills had the real spread and no extra slippage, so real fills would be worse. It is one rule and not a breakout or a pullback, and it says nothing about a person reading the chart. It does say a release is not an edge by itself.
What do the three seats see?
The Three Seats read the candle three ways.
- Retail sees a trend started. The break is the confirmation, and the pullback is the better price.
- The market maker, as we read it, sees stops resting past the morning's levels. The candle reaches them, which is News-Induced Liquidity, and what follows is not decided by them. Nobody outside can see those orders.
- The observer sees a count. A break on 27 of 40 and a pullback on 23, in different mixes on different days. That is the evidence and it is not a plan.
What does this not tell you?
It does not tell you whether any plan made money. It is five reports on one feed, and the eight markets move on one dollar, so the 40 market-mornings are not independent. These days were picked afterwards for study, and a reversal seen afterwards is not a setup. Should you trade the news takes the wider question, the average NFP move by pair gives the size of the candle, and why price spikes, then reverses, after news looks at more of these days.
Course 2 of ForexiaPRO, The Chaos Pattern, teaches this read step by step in lesson 2.3.3, NFP, CPI, FOMC: One Read, Three Calendars.
Frequently asked questions
Should you trade the NFP breakout or the pullback?
We cannot say which pays, because we have not tested either as a trade. What we counted is how often each chance came. On 40 market-mornings from May to September 2026, price traded past the 08:30 candle's extreme within two hours on 27 and came back to the middle of that candle on 23. On 17 it never did, so a pullback entry would not have filled.
Does price pull back after NFP?
Often partly, rarely fully. On our count price came back to the middle of the jobs candle's range on 23 of 40 market-mornings within two hours, and closed back through the candle's open on 5. A pullback to the middle and a move to a new extreme both happened on 12, and the new extreme came first on 9 of those.
Is it better to stay out of NFP?
It depends on what you can measure about your own fills. The jobs candle runs 6 to 10 times an ordinary candle, and our own fixed rule of fading hunts printed on a release came to -0.12R a trade after costs. That is one rule, and it does not say standing aside is right. It says a release alone is no edge.
What does an NFP strategy test need to include?
Entry, stop, target, costs and the spread at the minute, none of which a chart of candles gives. Our feed is the bid only, so we do not claim a result for any NFP plan. We report what price did, which is the part a chart can show.